Gold (XAUUSD) remains in a sideways range; the market awaits US inflation statistics
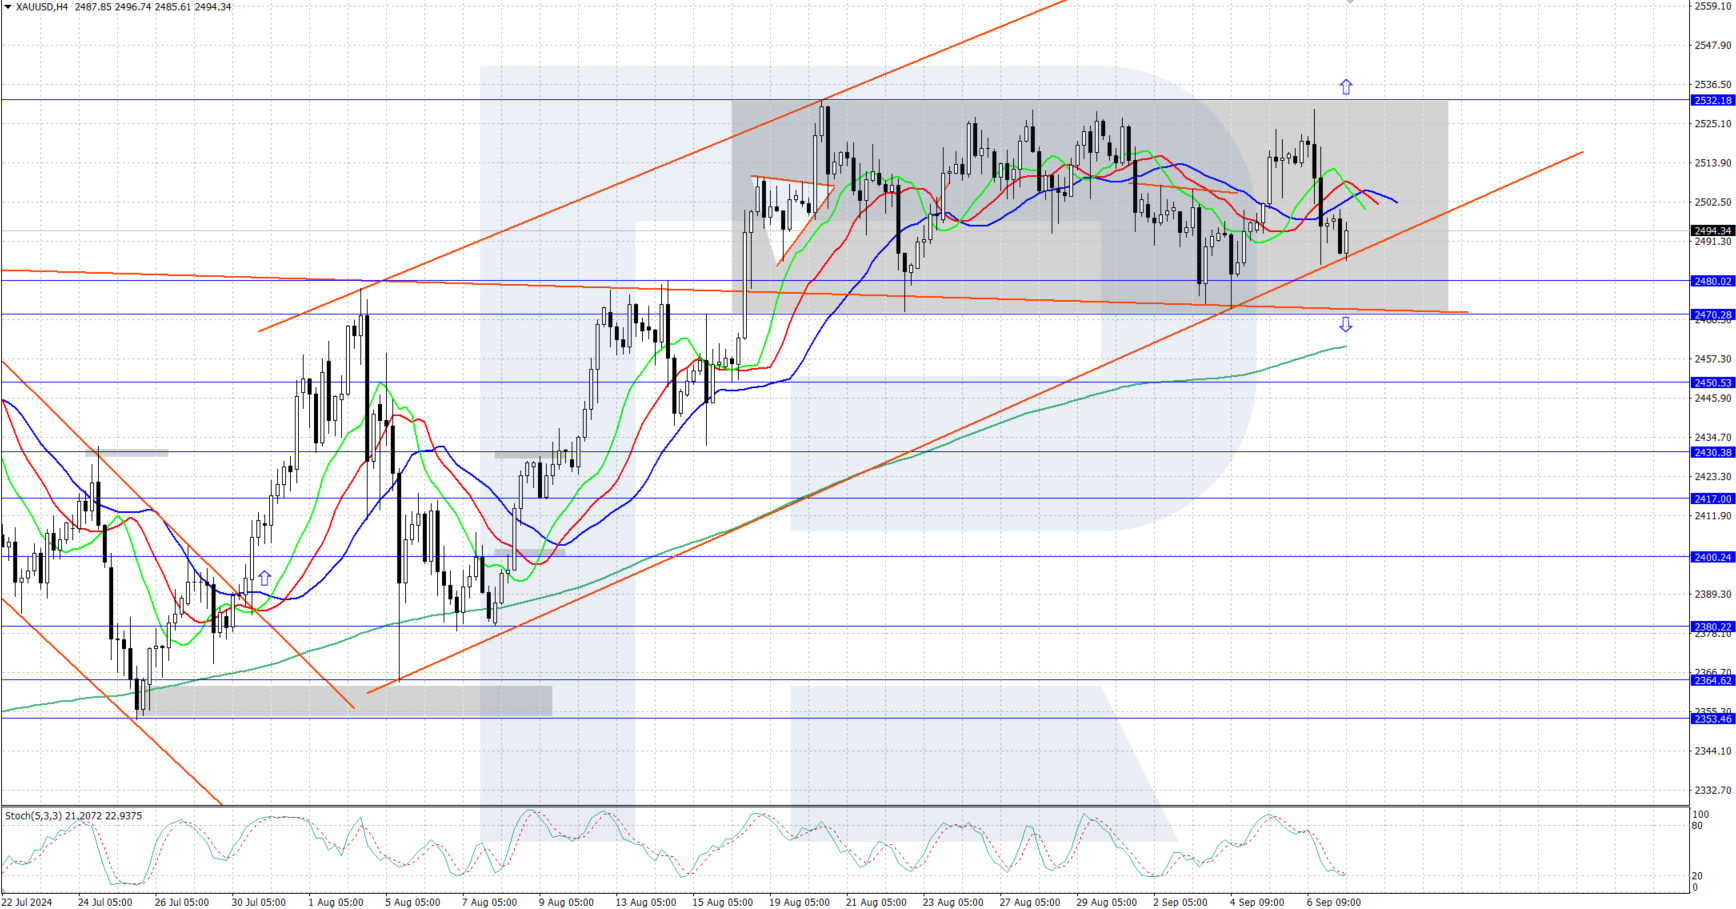
The XAUUSD price has been trading in a sideways range for three weeks; the direction of the price movement out of the range may determine the future trend. The market will focus on US inflation data this week. Find out more in our XAUUSD analysis for today, 9 September 2024.
XAUUSD forecast: key trading points
- Market focus: market participants are awaiting US inflation statistics this week
- Current trend: gold is consolidating within a sideways range
- XAUUSD forecast for 9 September 2024: 2,532 and 2,470
Fundamental analysis
Friday’s US employment market statistics aligned with the forecasts, with nonfarm payrolls showing growth of 142,000 and the unemployment rate declining to 4.2%. US stock indices responded to this data with a fall, and gold also corrected downwards from its annual high of 2,532 USD to 2,500 USD.
Market participants will focus on US inflation statistics this week, with the Consumer Price Index (CPI) and the Producer Price Index (PPI) scheduled for release. A decline in inflation will exert pressure on the USD and help strengthen gold. Conversely, a rise in inflation will support the US dollar, potentially causing XAUUSD quotes to fall.
XAUUSD technical analysis
On the daily chart, the XAUUSD pair is experiencing a long-term uptrend. A sideways price range has formed on the H4 chart, with the upper boundary at 2,532 USD and the lower at 2,470 USD. The range’s lower boundary coincides with the upper line of the previously formed triangle pattern. The direction of the price movement out of the sideways range may determine a further trend in gold price movements.
The short-term XAUUSD price forecast suggests that the price could rise further to 2,600 USD if it breaks above the sideways range (surpassing an all-time high of 2,532 USD). If bears secure a hold below 2,470 USD, the daily trend could reverse downwards, with the price expected to decline to 2,400 USD.
Summary
Gold continues to consolidate sideways within a range between 2,470 and 2,532 USD. This week, US inflation statistics could drive gold out of the range.
Los pronósticos de los mercados financieros son la opinión personal de sus autores. El análisis actual no es una guía de trading. RoboForex no se hace responsable de los resultados que puedan ocurrir por utilizar las recomendaciones presentadas.


