US 500 analysis: US employment market data only accelerated the fall in the index price
The US 500 stock index tumbled by 4.46% from its early-month levels, with US employment market data only accelerating the fall. The US 500 forecast is negative until the end of the week.
US 500 forecast: key trading points
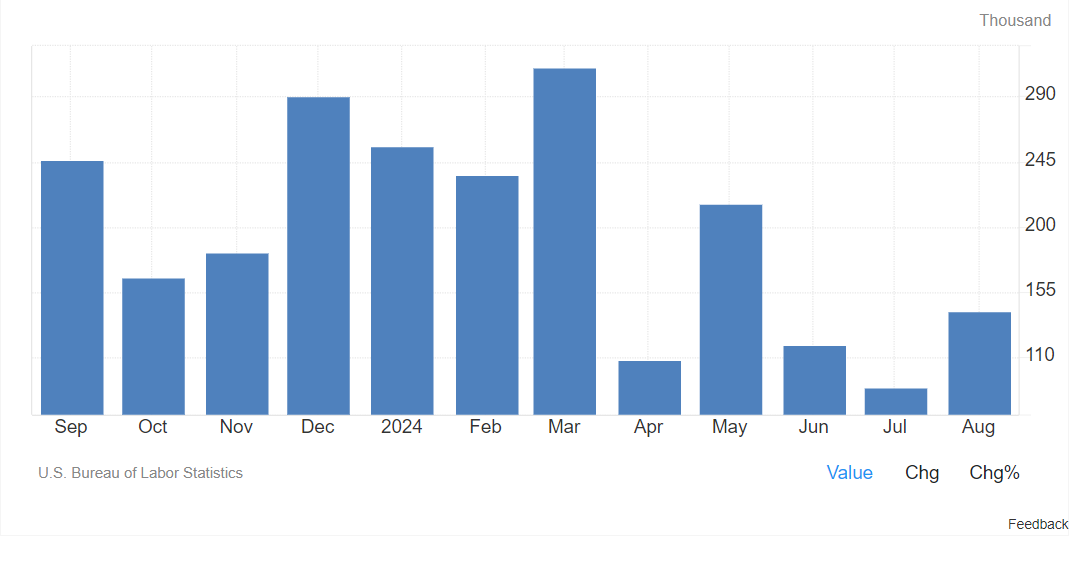
- Recent data: the number of jobs in the US increased by 142,000 in August, according to the US Department of Labor report
- Economic indicators: employment market statistics are the main gauge for the US Federal Reserve in determining further monetary policy
- Market impact: the data boosted demand for US government bonds and led to reduced investments in stocks as investors sought to lock in the current yield on this instrument before a Federal Reserve interest rate cut
- Resistance: 5,655.0, Support: 5,560.0
- US 500 price forecast: 5,330.0
Fundamental analysis
US job growth in August was below expectations. According to the US Department of Labor report, the number of jobs in the US increased by 142,000 in August, falling short of the expected 160,000.
Source: https://tradingeconomics.com/united-states/non-farm-payrolls
The previous reading was revised down to 89,000 from 114,000. The unemployment rate decreased from 4.3% to 4.2%, aligning with expectations of 4.2%. The average hourly earnings rose by 0.4%, exceeding the forecasted 0.3%.
All the above indicates a stable trend towards the weakening of the employment market and the increasing probability of a US recession. Additionally, rising unemployment will have a deflationary effect on prices. In this situation, the Federal Reserve has no other option but to lower interest rates at the upcoming September meeting, which will cause a fall in the yield of US government bonds. As a result, market participants are reducing their stock investments at this stage. The US 500 forecast for next week is negative.
US 500 technical analysis
The US 500 stock index failed to form a support level due to active sell-offs. The price will likely break below the channel between the current resistance and potential support levels. Subsequently, it will be possible to consider various scenarios for a reversal from a downtrend to an uptrend.
Key levels for the US 500 analysis include:
- Resistance level: 5,655.0 – a breakout above this level could drive the price to 5,780.0
- Support level: 5,560.0 – if the price breaks below the support level, a potential decline target will be at 5,330.0
Summary
As reported by the US Department of Labor, the number of jobs in the US increased by 142,000 in August. The data released boosted demand for US government bonds, which led to reduced investments in stocks as investors sought to lock in the current yield on this instrument before a Federal Reserve interest rate cut. The US 500 price forecast is negative and suggests a fall to 5330.0.
Los pronósticos de los mercados financieros son la opinión personal de sus autores. El análisis actual no es una guía de trading. RoboForex no se hace responsable de los resultados que puedan ocurrir por utilizar las recomendaciones presentadas.


