World indices overview: news from US 30, US 500, US Tech, JP 225, and DE 40 for 24 December 2024
The stock indices resumed growth after a correction. Find out more in our analysis and forecast for the leading global indices for 24 December 2024.
US indices forecast: US 30, US 500, US Tech
- Recent data: the PCE Price Index came in at 2.4% year-on-year
- Market impact: easing inflationary pressures, coupled with expectations of a stable or accommodative Federal Reserve monetary policy, are likely to support the US indices, particularly growth and technology stocks
Fundamental analysis
The stable core PCE (+2.8% y/y) and the decline in the overall PCE (2.4% y/y) provide conditions for maintaining an accommodative monetary policy. US indices are expected to respond positively in the short term, particularly if other macroeconomic data affirm the economy’s resilience. However, the market will also closely watch Federal Reserve statements to assess the regulator’s future strategy.
US 30 technical analysis
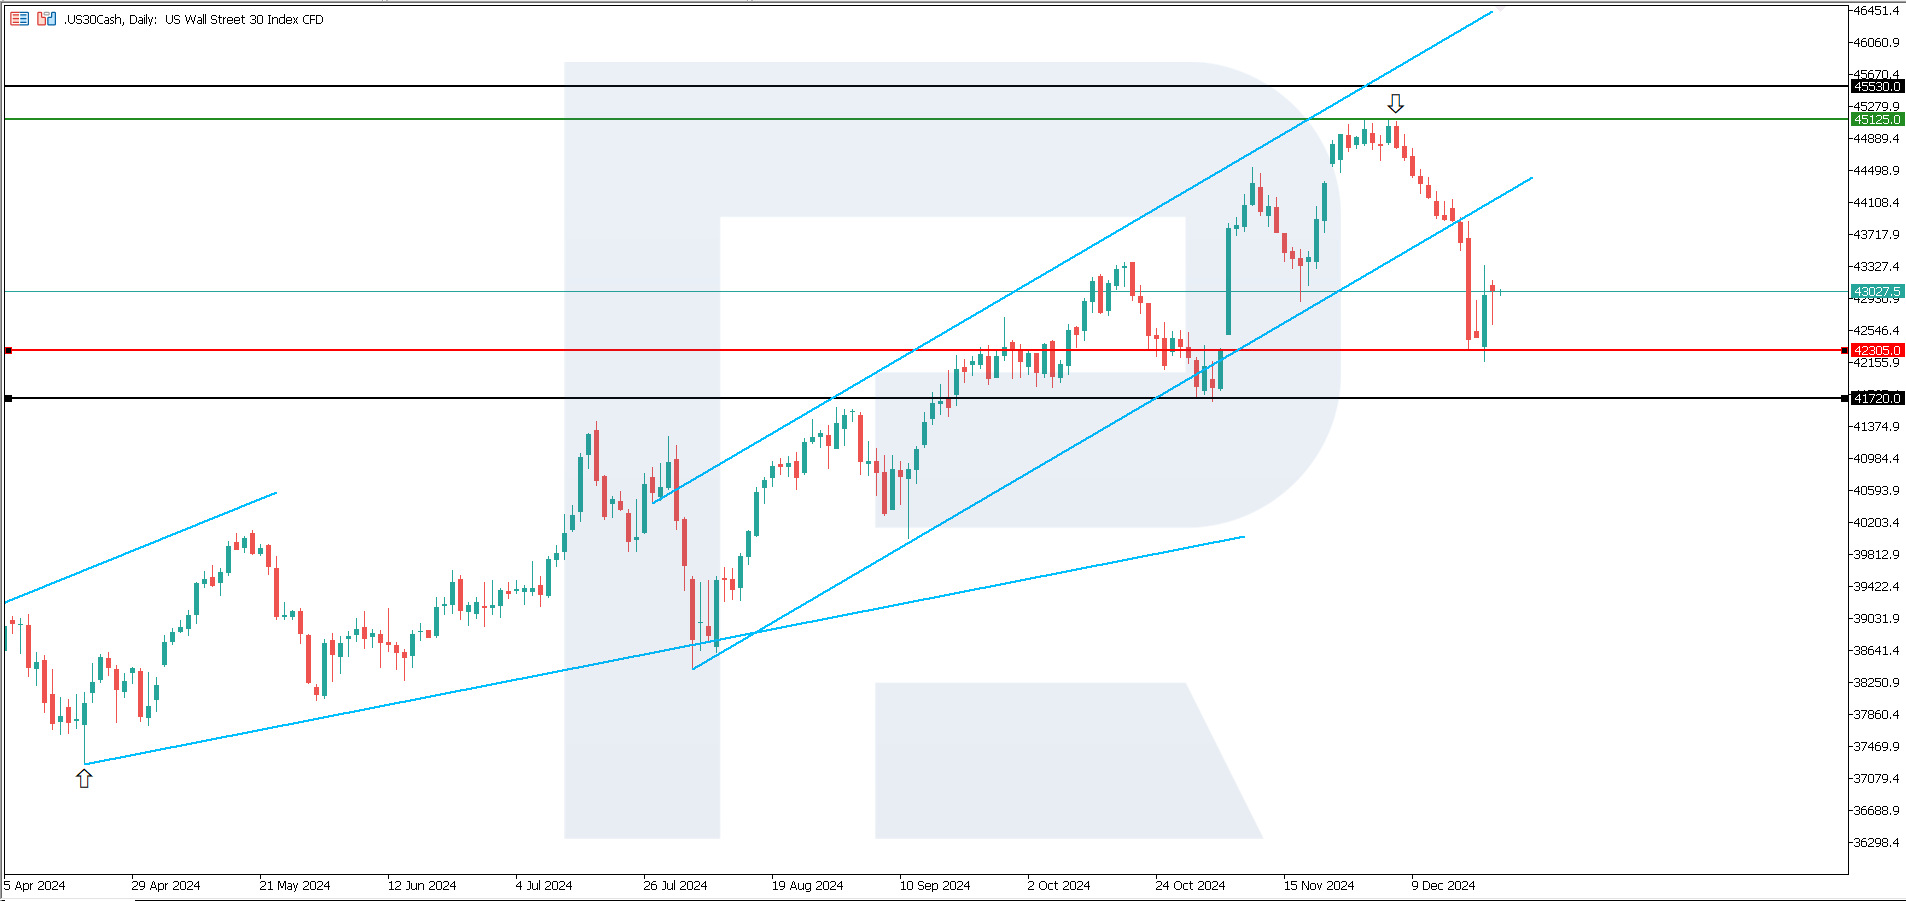
The US 30 stock index has resumed its uptrend after falling more than 6%. The technical analysis indicates signs of resuming the uptrend. Even if the price briefly breaks below the support level during a single trading session, a sustained downtrend is not anticipated.
The following scenarios are considered for the US 30 price forecast:
- Pessimistic US 30 forecast: a breakout below the 42,305.0 support level could push the index down to 41,720.0
- Optimistic US 30 forecast: a breakout above the 45,125.0 resistance level could drive the price up to 45,530.0
US 500 technical analysis
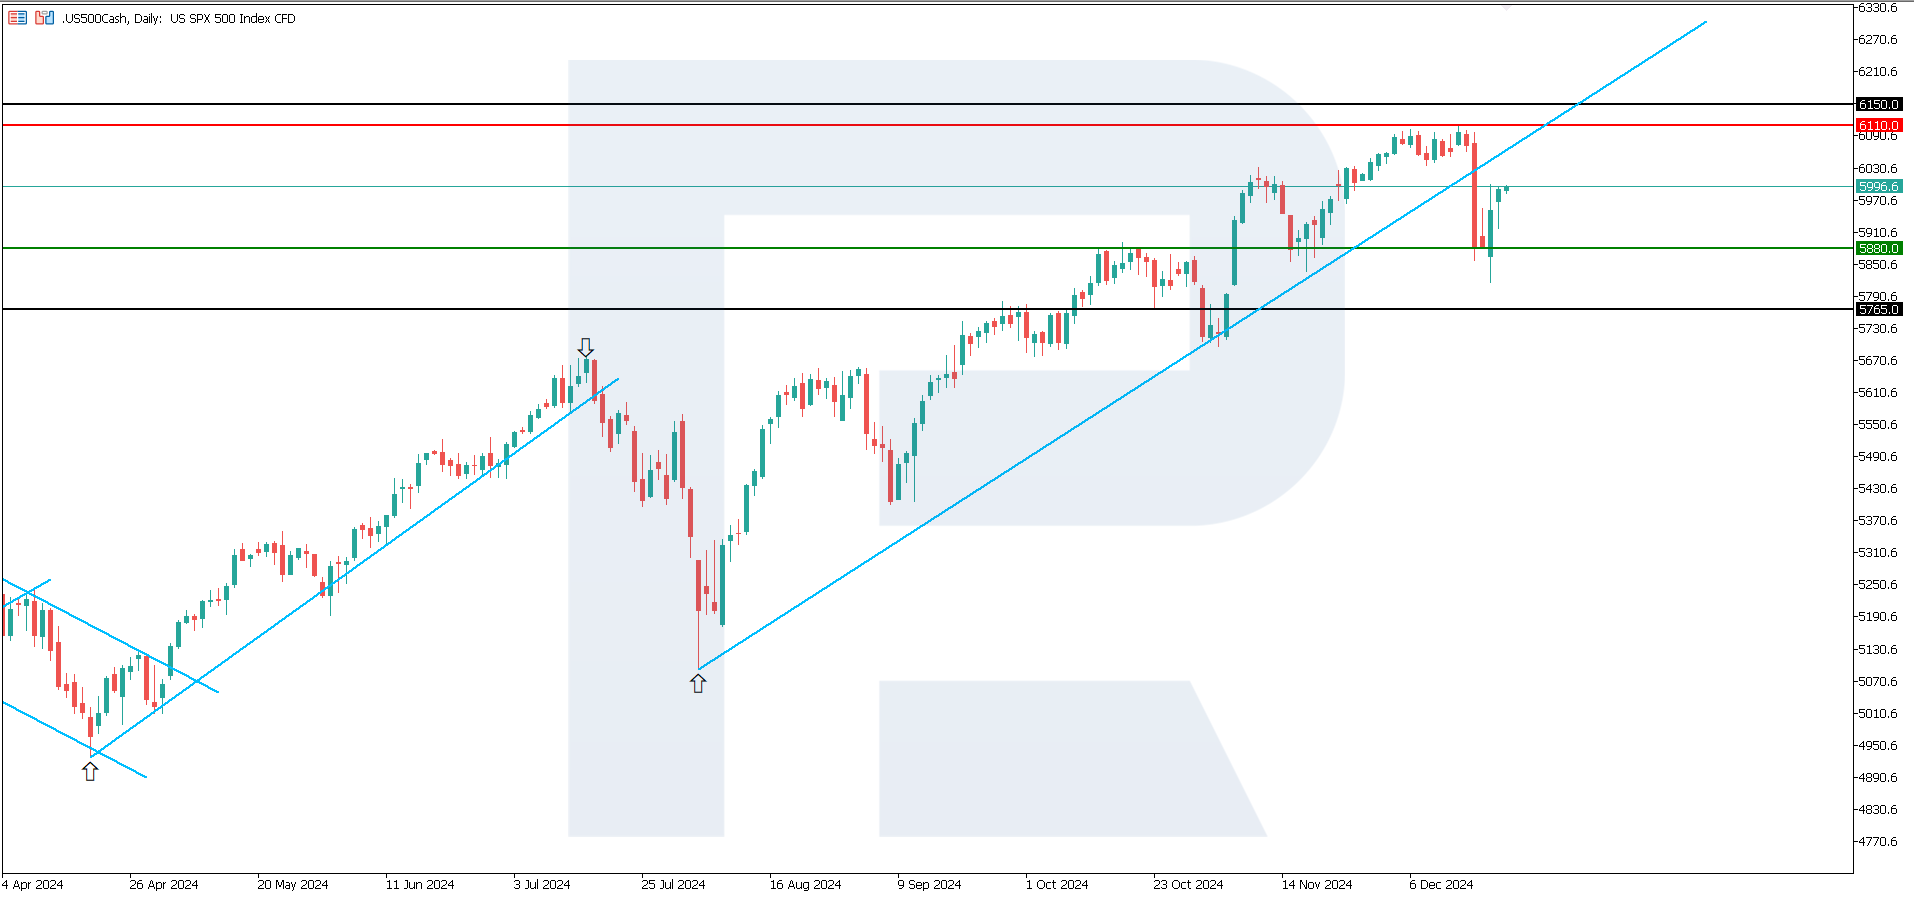
The following scenarios are considered for the US 500 price forecast:
- Pessimistic US 500 forecast: a breakout below the 5,880.0 support level could send the index down to 5,765.0
- Optimistic US 500 forecast: a breakout above the 6,110.0 resistance level could propel the index to 6,150.0
US Tech technical analysis
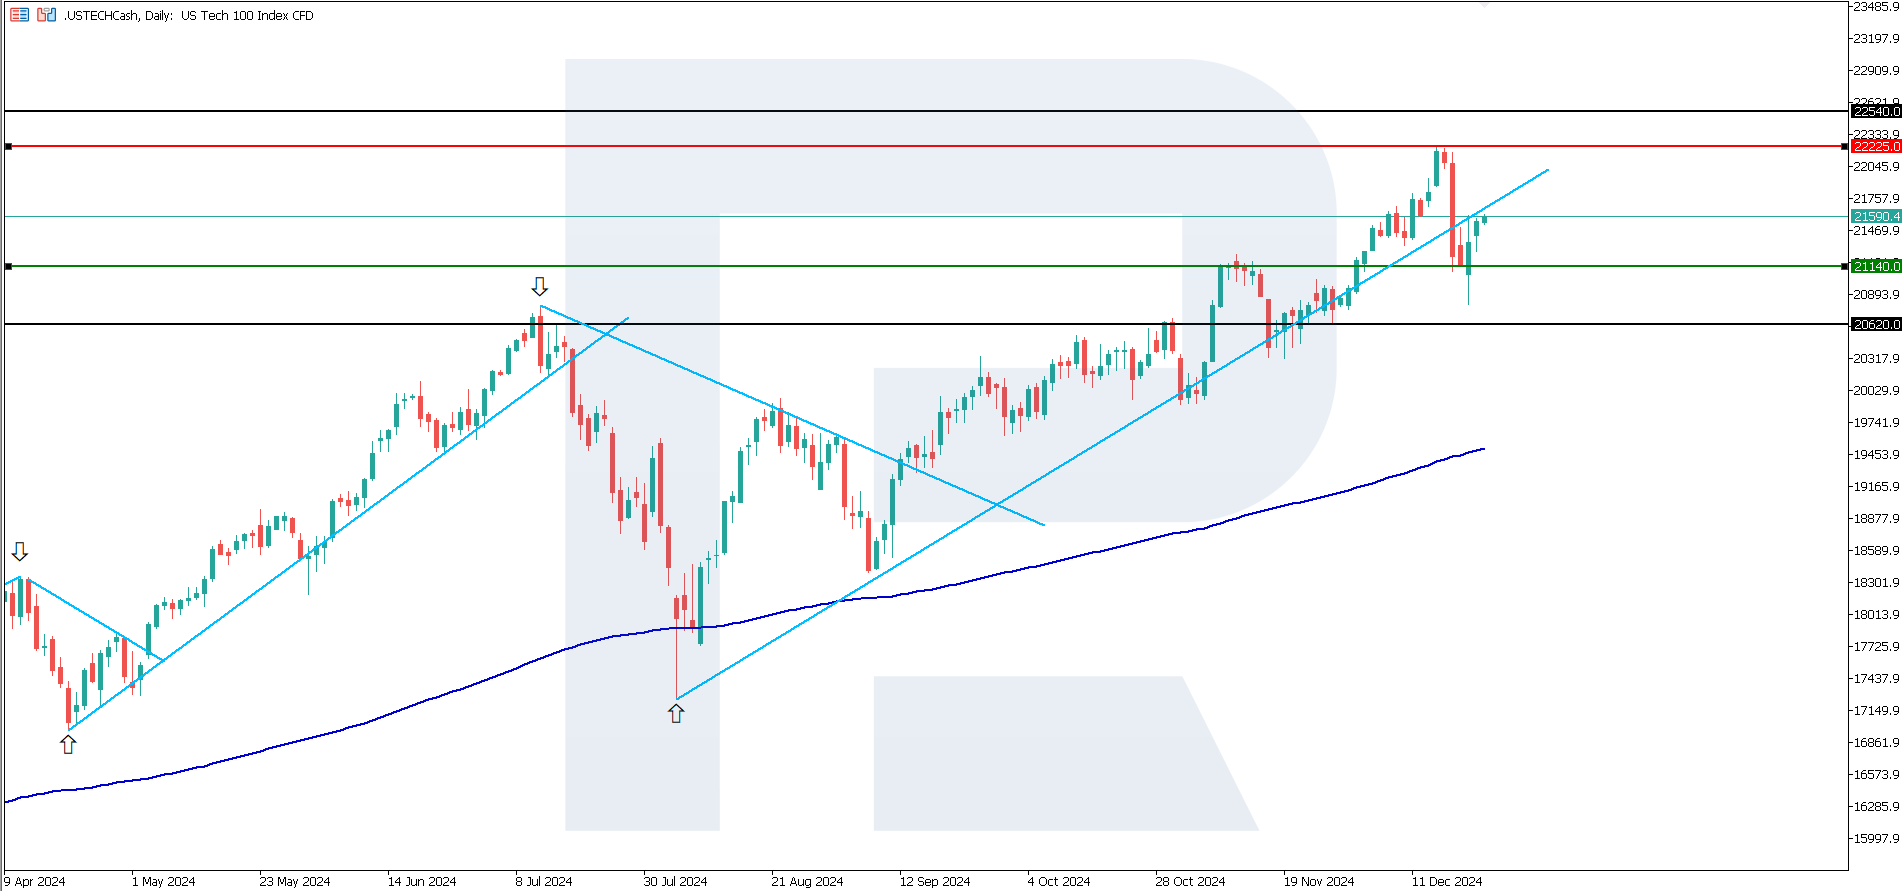
The US Tech stock index is actively recovering from its previous downturn. A new uptrend appears likely, and technical analysis suggests this trend may be medium-term.
The following scenarios are considered for the US Tech price forecast:
- Pessimistic US Tech forecast: a breakout below the 21,140.0 support level could push the index down to 20,620.0
- Optimistic US Tech forecast: a breakout above the 22,225.0 resistance level could propel the index to 22,540.0
Asia index forecast: JP 225
- Recent data: the Bank of Japan’s policy rate was 0.25%
- Market impact: the ultra-low rate supports cheap lending, which is advantageous for businesses and boosts the stocks of exporters
Fundamental analysis
Maintaining the rate at 0.25% supports economic stability; however, a statement about uncertainty could heighten market volatility. In the short term, low borrowing costs and a weak yen may support the JP 225 index and exporters’ stocks. In the long term, however, market sentiment will hinge on external factors and the policies of other major central banks.
JP 225 technical analysis
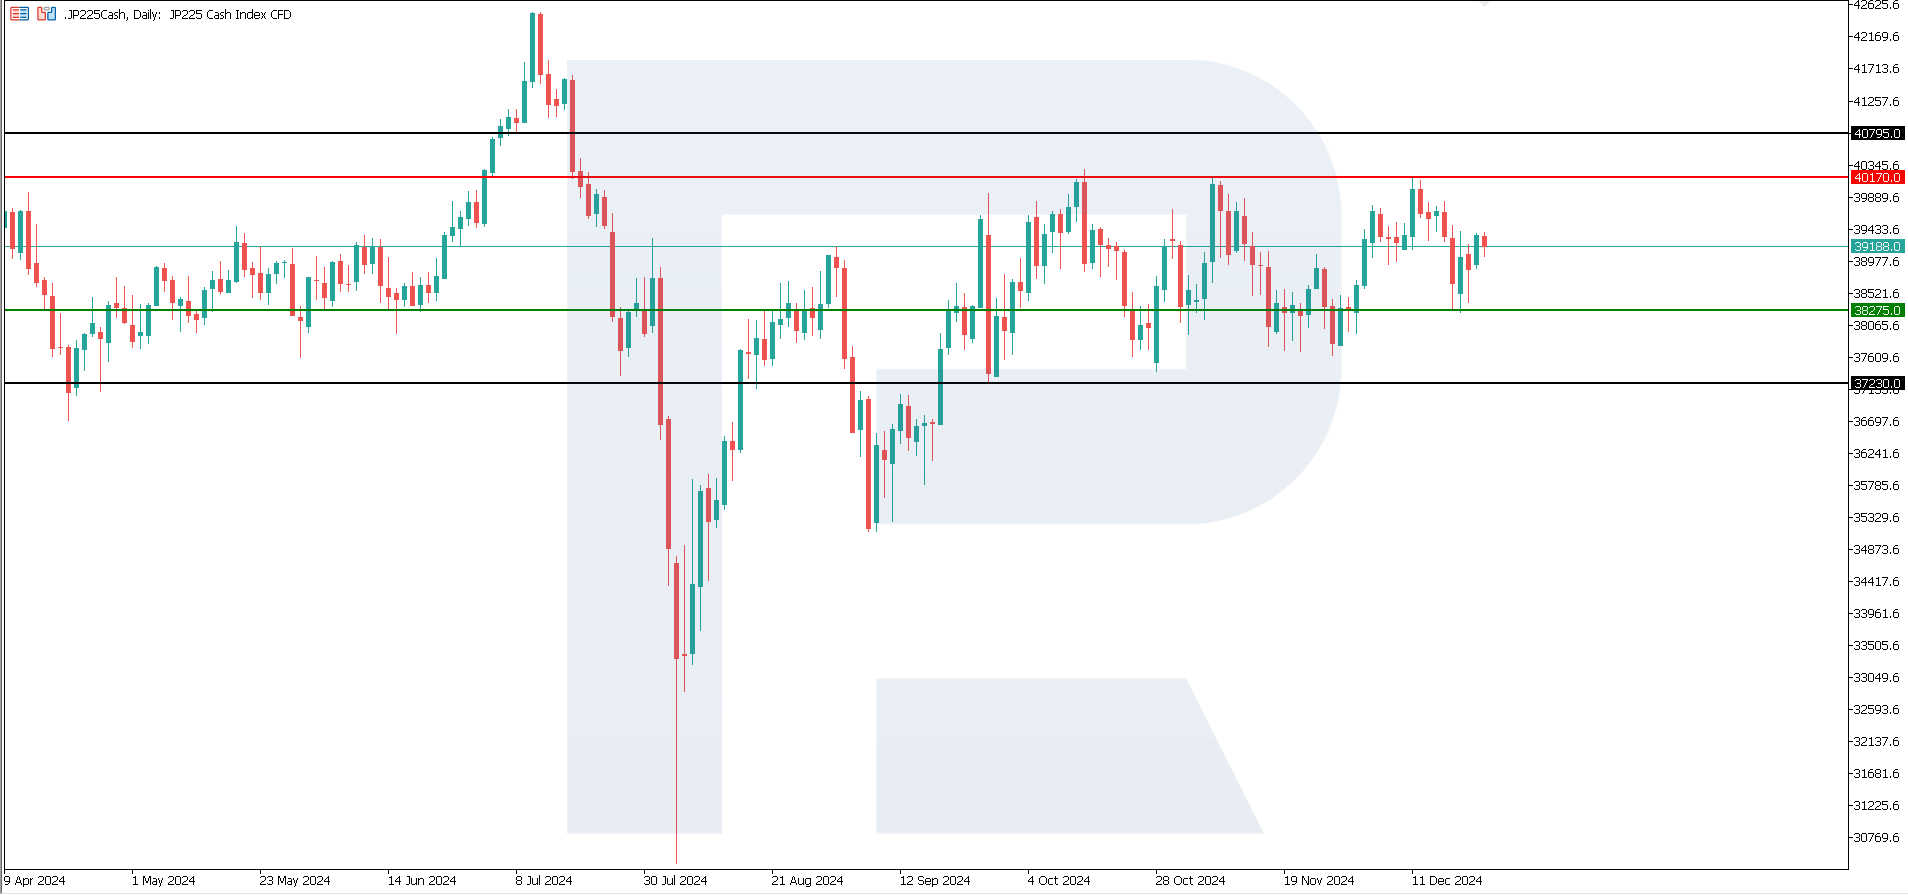
The JP 225 stock index is trading in a sideways channel between 40,170.0 and 37,250.0. No clear trend has been evident since early August 2024. JP 225 technical analysis does not indicate any factors that could trigger the formation of an uptrend or a downtrend. The quotes will likely continue trading within this range.
The following scenarios are considered for the JP 225 price forecast:
- Pessimistic JP 225 forecast: a breakout below the 38,275.0 support level could send the index down to 37,230.0
- Optimistic JP 225 forecast: a breakout above the 40,170.0 resistance level could push the index to 40,795.0
European index forecast: DE 40
- Recent data: the Composite PMI was preliminarily 47.8 in December
- Market impact: the manufacturing sector (the backbone of the German economy) continues to contract, which may weigh on industrial production stocks
Fundamental analysis
Germany’s economic performance has steadily declined, but the pace of contraction is slowing. A Composite PMI below 50.0 points indicates stagnation of the economy as a whole, which may heighten investor concerns. The market will also consider other macroeconomic indicators, such as inflation and the European Central Bank’s (ECB) monetary policy. If the ECB continues its accommodative approach, it could mitigate some of the adverse effects of the weak manufacturing industry.
DE 40 technical analysis
The DE 40 stock index remains in an uptrend after falling by over 4%. The price is expected to rise and attempt to reach a new all-time high. However, according to the DE 40 technical analysis, the uptrend will likely be short-term.
The following scenarios are considered for the DE 40 price forecast:
- Pessimistic DE 40 forecast: a breakout below the 19,665.0 support level could send the index down to 19,145.0
- Optimistic DE 40 forecast: if the price breaks above the 20,455.0 resistance level, it could climb to 20,680.0
Summary
US stock indices are actively recovering after the decline, with the US 500 and US Tech seeing the most significant gains. Technical analysis indicates that these indices will likely form a steady uptrend. Japan’s JP 225 index continues to trade within a sideways channel, with no signs of breaking out of its boundaries. Germany’s DE 40 index still has potential for further growth, but much will depend on the ECB’s future policy decisions.
Los pronósticos de los mercados financieros son la opinión personal de sus autores. El análisis actual no es una guía de trading. RoboForex no se hace responsable de los resultados que puedan ocurrir por utilizar las recomendaciones presentadas.


