Pronóstico del oro (XAUUSD) para 2026 y más allá: perspectivas de expertos, predicciones de precios y análisis
Descargo de responsabilidad: la información de este artículo se basa en el análisis de fuentes financieras de confianza y en los datos analíticos de los especialistas de RoboForex. Refleja las conclusiones de una investigación exhaustiva, pero debe tenerse en cuenta que los cambios económicos pueden afectar significativamente a las condiciones del mercado, lo que puede provocar cambios en los pronósticos del oro. Recomendamos realizar su propia investigación y consultar con profesionales antes de tomar decisiones financieras importantes.
El oro sigue siendo una de las herramientas más fiables para cubrir riesgos durante las crisis globales. Su popularidad confirma el atractivo duradero de este activo, que se proyecta que persista a largo plazo.
Tras un impresionante rally hasta octubre de 2025, el mercado del oro entró en una fase de consolidación y actualmente cotiza en torno al nivel de 4.000 USD por onza. El metal fijó un nuevo récord de precio, alcanzando los 4.381 USD por onza el 20 de octubre de 2025. A pesar de la estabilización actual, los analistas siguen confiando en el potencial del oro en 2026 y pronostican un crecimiento adicional.
La escalada del conflicto en Ucrania, el aumento de las tensiones en Oriente Medio y la inestabilidad política en Europa siguen incrementando la incertidumbre económica. Estos riesgos respaldan la creciente demanda de oro entre los inversores y los bancos centrales. En particular, el Banco Popular de China continúa sus compras, manteniéndose como uno de los mayores compradores de este metal precioso.
Tabla de contenidos:
- Puntos clave: pronóstico del precio del oro (XAUUSD)
- ¿Cómo hacer un pronóstico del precio del oro?
- ¿Por qué ha subido el precio del oro?
- Gráfico en tiempo real de XAUUSD
- Análisis técnico semanal del oro (XAUUSD)
- Análisis técnico a largo plazo del oro (XAUUSD)
- Pronóstico experto del precio del oro para 2026 y más allá
- Pronósticos expertos del precio del oro para 2030
- Ventajas y desventajas de invertir en oro
- Conclusión
- FAQ
Puntos clave: pronóstico del precio del oro
Los analistas pronostican que los precios del oro seguirán subiendo, con nuevos máximos históricos posibles en 2026. Se espera que los precios de XAUUSD bajen hasta 3.800 USD para finales de 2025 y luego suban hasta 4.500 USD en los dos años siguientes, impulsados por la fuerte demanda de los principales bancos centrales y los cambios en la política monetaria de la Reserva Federal.
El oro sigue siendo un activo atractivo en medio de la debilitación de la confianza en el dólar estadounidense en Asia y las persistentes tensiones geopolíticas. Morgan Stanley esperaba que los precios del oro se estabilizaran en 2.700 USD en el primer trimestre de 2025, mientras que UBS pronosticó un aumento hasta 2.900 USD para finales de año. Los analistas de Goldman Sachs consideraban que el oro podría alcanzar los 3.700 USD en 2025. Pero en realidad, los precios del oro probaron los 4.381 USD.
Los analistas prestan especial atención a las compras de reservas de oro por parte de los bancos centrales de los países en desarrollo, cuyo objetivo es reducir la dependencia del dólar y disminuir los riesgos asociados a las sanciones. Señalan que el creciente endeudamiento nacional de EE. UU. ejercerá presión sobre la confianza en la moneda estadounidense a largo plazo, lo que también impulsará los precios del oro al alza.
¿Cómo hacer un pronóstico del precio del oro?
Los pronósticos del precio del oro se basan en el análisis de los principales factores que determinan su oferta y demanda. También tienen en cuenta los patrones de precios en el gráfico, la evaluación de los indicadores técnicos, así como la dinámica de los mercados emergentes. Los expertos e inversores distinguen tres enfoques principales para elaborar un pronóstico preciso de XAUUSD:
- Política monetaria de EE. UU.
- Compras de los bancos centrales
- Riesgos geopolíticos
Estos factores clave están fuertemente influenciados por el nivel de confianza en el dólar estadounidense y su fortaleza o debilidad actuales. Otros factores importantes incluyen cambios en el sentimiento de los inversores, inestabilidad política durante los períodos electorales, amenaza de recesión, salida de capital de los ETF, sensibilidad de la demanda física, niveles de desempleo en EE. UU., así como riesgos en el sector bancario y en diversas industrias de EE. UU., la Unión Europea y China.
Factores fundamentales
El análisis fundamental del oro (XAUUSD) se basa en los cambios en la política monetaria de los bancos centrales, especialmente de la Reserva Federal de EE. UU., así como en otros factores clave que influyen en los precios del oro. Entre ellos se encuentran el nivel de consumo mundial, la demanda de inversión, el aumento de la demanda de los bancos centrales, los cambios en el tipo de interés de la Reserva Federal y las compras de oro de China. Estos factores afectan fuertemente al comportamiento del precio y constituyen la base para posteriores pronósticos del oro.
Recortes de los tipos de interés de la Reserva Federal
Tradicionalmente, el oro muestra una fuerte correlación con la dinámica de los tipos de interés de los bancos centrales. Históricamente, el oro tiende a subir de manera constante cuando los tipos de interés bajan y la inflación se acelera, actuando como instrumento de cobertura de riesgos. El cambio en el ciclo monetario de EE. UU. se convirtió en uno de los factores que impulsaron los precios del oro al alza en 2025. En septiembre de 2025, el regulador redujo el tipo de interés al 4,25%. En octubre de 2025 se produjo otro recorte, que lo llevó al 4,0%. El regulador también señaló que había comenzado una nueva etapa del ciclo de flexibilización y que las decisiones en 2026 se tomarían de forma más prudente.
Demanda mundial de oro
Según el informe del World Gold Council (WGC) para el tercer trimestre de 2025, la demanda total de oro aumentó un 3% en comparación con el mismo período del año anterior y alcanzó las 1.313 toneladas, una cifra récord para un tercer trimestre. El valor total de la demanda superó por primera vez los 384.000 millones de USD, impulsado por una sólida actividad inversora a precios récord del oro.
La demanda mundial de inversión aumentó en 538 toneladas debido al creciente interés por los ETF, principalmente por parte de inversores occidentales. Según el WGC, en el segundo trimestre de 2025 la demanda total de inversión en oro (incluidos lingotes y monedas) aumentó un 41% en comparación con el mismo período de 2024.
La demanda de oro en el sector tecnológico cayó un 2% interanual.
Compras de oro de los bancos centrales
Según el informe Gold Demand Trends del WGC de septiembre de 2025, los bancos centrales compraron 39 toneladas de oro, un 79% más que en agosto, lo que supone las compras netas mensuales más altas de 2025. En general, la demanda de los bancos centrales sigue siendo sólida. En los tres primeros trimestres de 2025, la demanda acumulada alcanzó las 3.717 toneladas. Los bancos centrales planearon comprar alrededor de 1.000 toneladas de oro en 2025, lo que podría marcar el cuarto año consecutivo de aumento de compras de oro por parte de los bancos centrales.
Una encuesta realizada entre bancos centrales mostró que el 43% de los encuestados planeaba aumentar sus reservas de oro en 2025, la proporción más alta desde que comenzaron estos estudios en 2018. Entre las principales razones se encuentran el deseo de alcanzar un nivel óptimo de reservas, apoyar la producción de oro nacional y protegerse frente a crisis financieras y riesgos de inflación.
Los bancos centrales de los países desarrollados suelen mantener una mayor proporción de oro en sus reservas. Por ejemplo, en EE. UU., Francia, Alemania e Italia, el oro representa alrededor del 70% de las reservas. En los mercados emergentes, esta proporción es mucho menor: en China, el oro representa solo el 5,1% de las reservas. Sin embargo, los bancos centrales de los mercados emergentes están incrementando activamente sus reservas de oro con el objetivo de alcanzar niveles similares a los de las economías desarrolladas, lo que podría sostener los precios del oro en el futuro.
China reanudó las compras de oro
El Banco Popular de China aumentó sus reservas de oro en 23,95 toneladas adicionales durante los tres primeros trimestres de 2025.
Según los últimos datos a finales de septiembre de 2025, el volumen de oro en las reservas del Banco Popular de China asciende aproximadamente a 2.303,5 toneladas. El banco ha reanudado la acumulación de reservas, lo que confirma la intención de China de diversificar sus activos a pesar de los elevados precios del oro.
Análisis técnico
Este enfoque implica analizar los datos históricos en los gráficos del oro para identificar tendencias de precios utilizando varios indicadores técnicos, patrones de velas y otras herramientas analíticas. El análisis técnico ayuda a identificar niveles clave de resistencia y soporte, líneas de tendencia y a pronosticar posibles reversiones de precios a largo plazo.
Basándonos en los datos históricos, vemos que XAUUSD suele mostrar una tendencia alcista a largo plazo. Por tanto, se suelen utilizar indicadores de tendencia, como las medias móviles, las Bandas de Bollinger y el indicador Ichimoku, para analizarlo. Los osciladores como el RSI y el MACD ayudan a identificar dónde podría finalizar la corrección bajista y señalan posibles puntos de reversión al alza.
Sentimiento del mercado
Los principales factores fundamentales que respaldan el crecimiento de los precios de XAUUSD siguen siendo estables. La demanda sostenida por parte de los principales bancos centrales, que están aumentando activamente sus reservas de oro, continúa impulsando el sentimiento positivo en el mercado. Esta tendencia es especialmente notable en las economías emergentes, donde los bancos centrales buscan diversificar sus activos y reducir la dependencia del dólar estadounidense.
El aumento de las tensiones geopolíticas, incluidas las de Oriente Medio, añade incertidumbre global y anima a los inversores a buscar activos refugio como el oro. En 2026, los impulsores clave de la demanda de oro incluirán el aumento de compras por parte de los bancos centrales, las entradas de capital en fondos cotizados en bolsa en un contexto de flexibilización de la política monetaria, así como los riesgos geopolíticos y la posible escalada de las tensiones comerciales. Tras un periodo de caída de la demanda, estos fondos han registrado entradas netas, lo que indica una reasignación activa de capital por parte de los inversores institucionales y respalda la continuación de la subida de los precios del metal precioso.
¿Por qué ha subido el precio del oro?
El aumento de los precios del oro en 2025 estuvo impulsado por múltiples factores, incluida la inestabilidad geopolítica. Los conflictos en Ucrania y Oriente Medio, junto con las crisis políticas en Alemania y Francia, incrementaron la preocupación de los inversores. Además, la flexibilización de la política monetaria de la Reserva Federal de EE. UU. y de los aranceles comerciales en un contexto de desaceleración de la inflación redujo el atractivo de los activos de deuda, lo que a su vez impulsó la demanda de oro. Los bancos centrales de los países en desarrollo y de China incrementaron sus compras de este metal precioso para reducir su dependencia del dólar estadounidense y minimizar los riesgos asociados a las sanciones. Los inversores minoristas de países como China, India, Turquía y Rusia también aumentaron sus compras de oro, utilizándolo como protección frente a la depreciación de sus monedas nacionales.
La demanda de oro también estuvo influenciada por factores macroeconómicos. El creciente endeudamiento nacional de EE. UU., el cierre del gobierno de duración récord en términos de días de inactividad y la disminución de la confianza en el dólar estadounidense incrementaron el interés por el oro como activo refugio. Las políticas de la administración Trump, incluida la introducción de aranceles a la importación y la negativa a respetar el techo de deuda, aumentaron la incertidumbre y reforzaron la posición del oro. El renovado interés por los ETF de oro y la débil correlación del metal con otras clases de activos lo convirtieron en una opción popular entre los inversores minoristas. En 2026, estos factores seguirán reforzando el estatus del oro como un activo capaz de preservar valor en medio del aumento de la volatilidad del mercado y la inestabilidad política.
Gráfico en tiempo real de XAUUSD
Análisis técnico semanal del oro (XAUUSD)
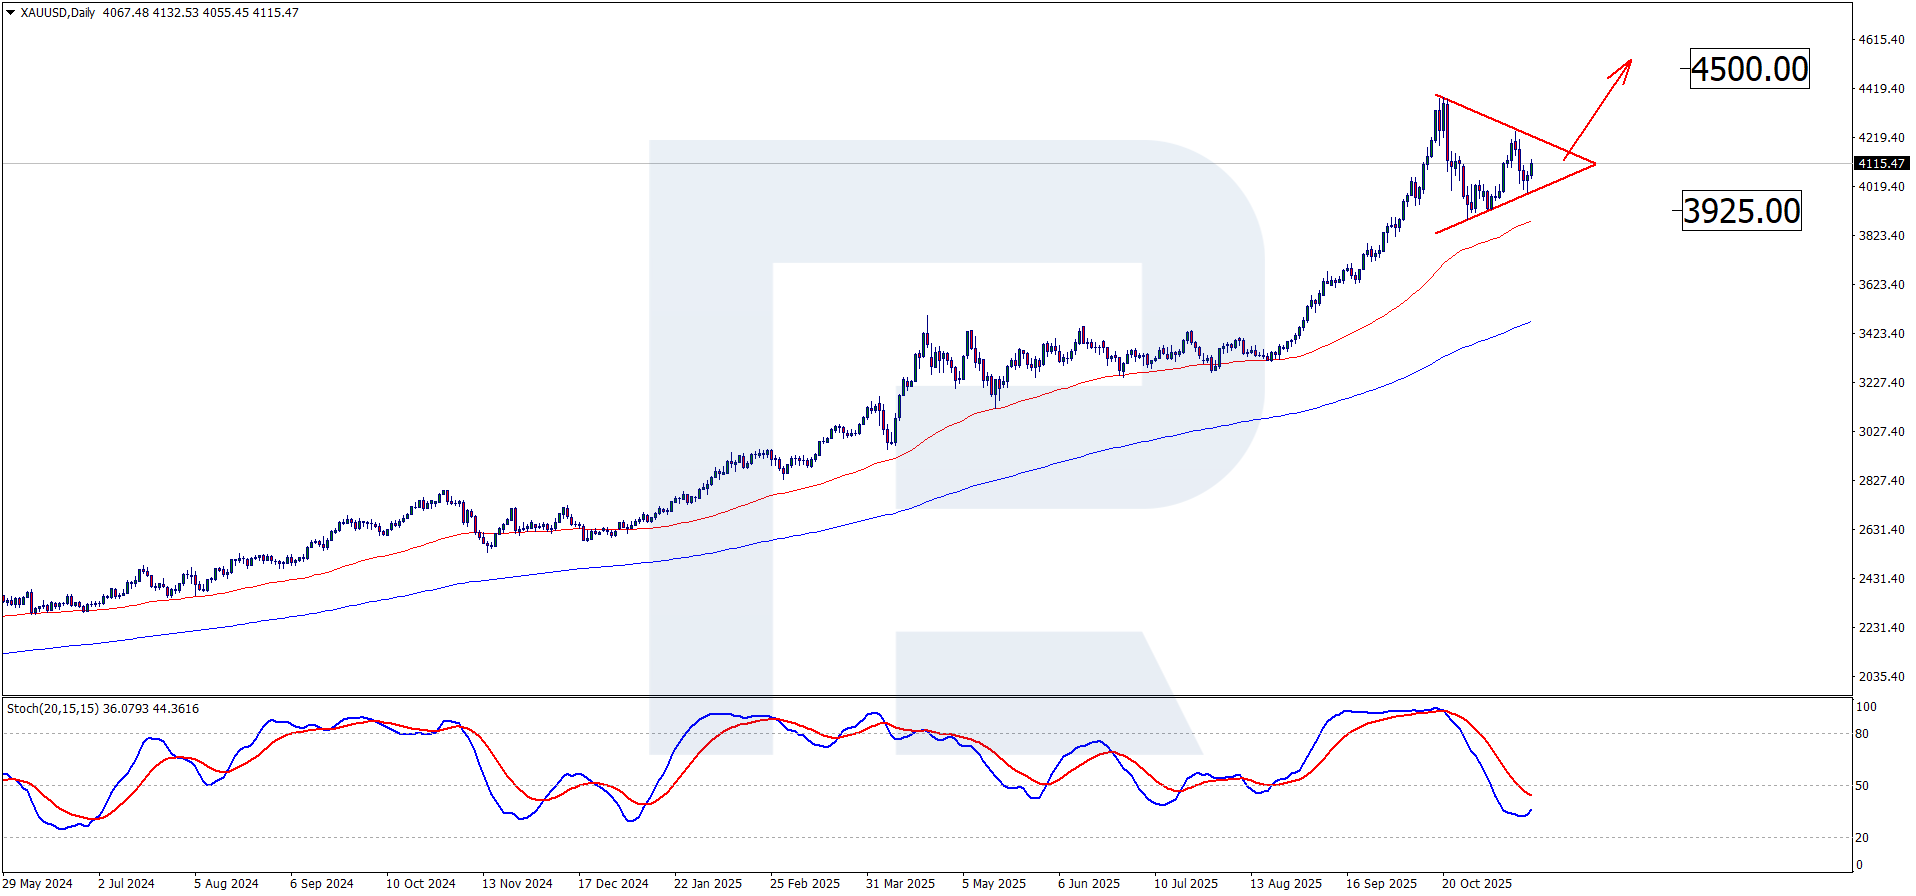
En el gráfico diario, el oro se está moviendo hacia la frontera superior del patrón de “Triángulo”. El soporte clave se situó en 3.925 USD, y el rebote desde este nivel abrió la vía para un nuevo crecimiento del precio dentro del desarrollo del patrón. En este escenario, el nivel objetivo es 4.500 USD. El oscilador estocástico indica que la corrección puede estar cerca de completarse, ya que las líneas %K y %D están convergiendo. La zona de resistencia se encuentra cerca de 4.200 USD, y una ruptura por encima de ella puede señalar la continuación del movimiento alcista.
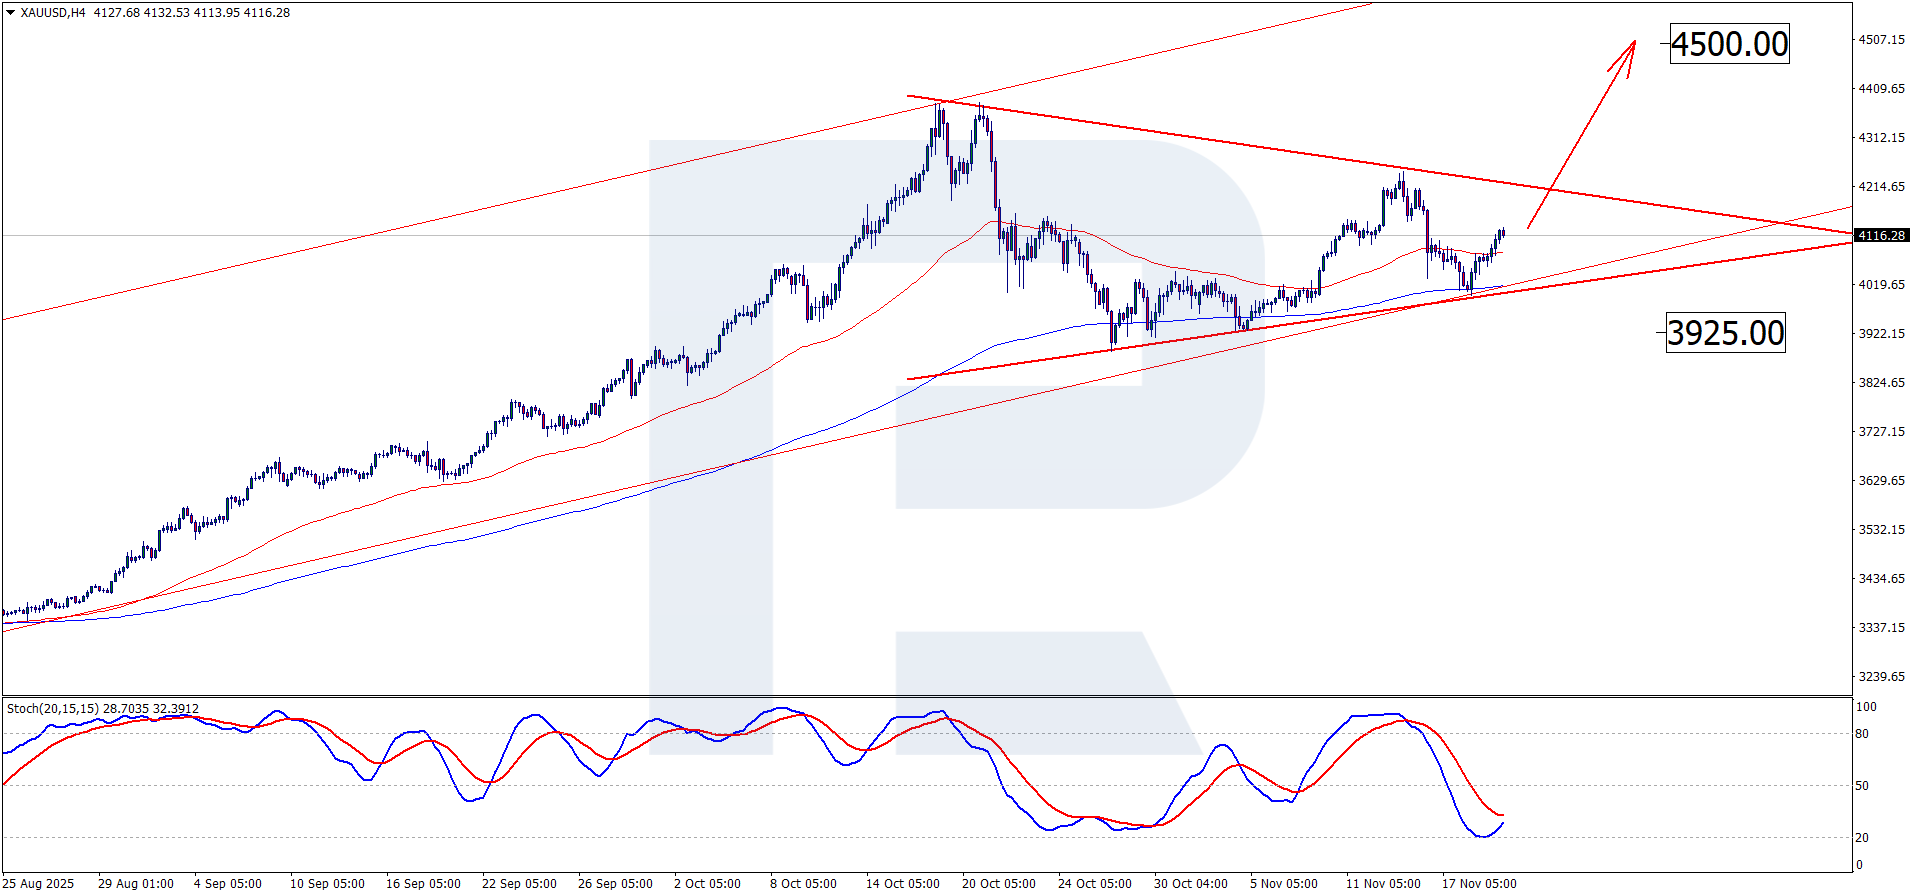
En el gráfico H4 de XAUUSD, los precios siguen moviéndose dentro de una tendencia alcista de medio plazo. Las líneas EMA-65 y EMA-200 se están acercando y pueden cruzarse en un futuro próximo. En este caso, es muy probable que los compradores continúen acumulando posiciones y aumentando la presión sobre el USD. Tras el cruce, las EMA-65 y EMA-200 pueden volver a divergir, confirmando la continuación de la tendencia alcista. Según el escenario principal del pronóstico de XAUUSD para 2026, la onda alcista puede continuar hacia 4.500 USD, tras lo cual es probable que se forme una onda correctiva. Un rebote desde la línea de soporte en el oscilador estocástico aumenta la probabilidad de un crecimiento adicional. La consolidación del precio por encima del nivel de 4.200 USD servirá como señal para la continuación del movimiento alcista.
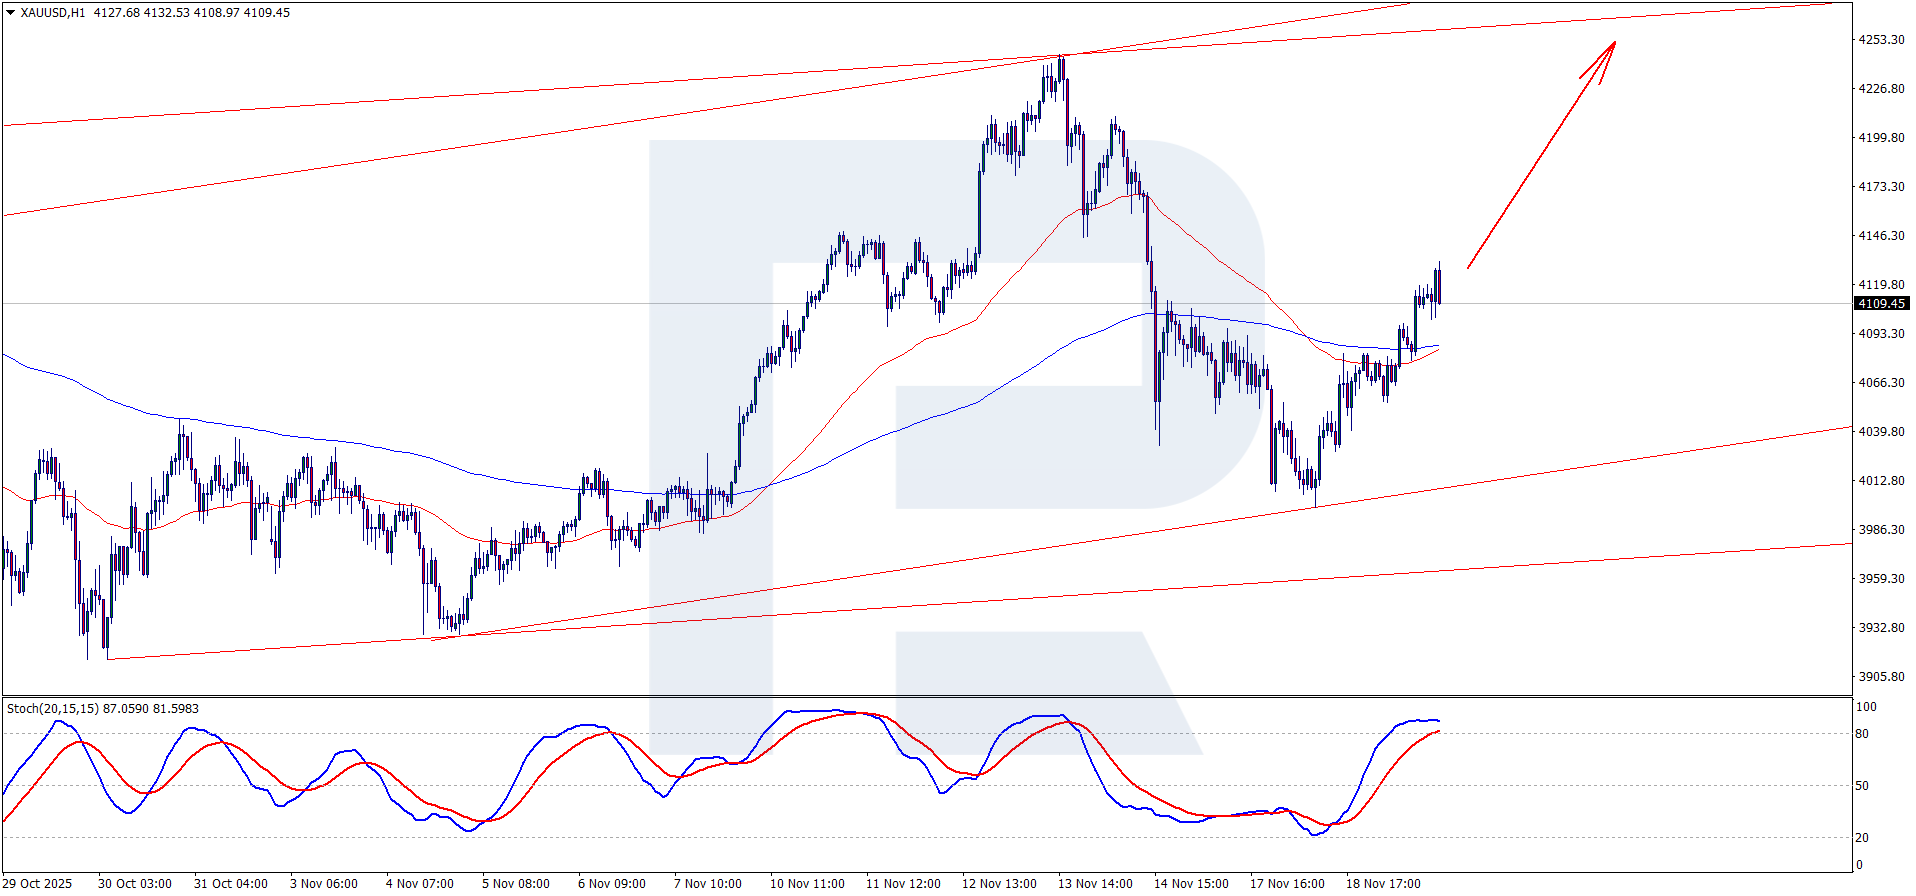
En el gráfico horario de XAUUSD, el precio ha cruzado la línea EMA-65, continuando su movimiento dentro del canal alcista. A corto plazo, el impulso alcista puede continuar hacia la marca de 4.500 USD. Un apoyo adicional para el escenario alcista viene del cruce de las líneas %K y %D en el oscilador estocástico.
Análisis técnico a largo plazo del oro (XAUUSD)
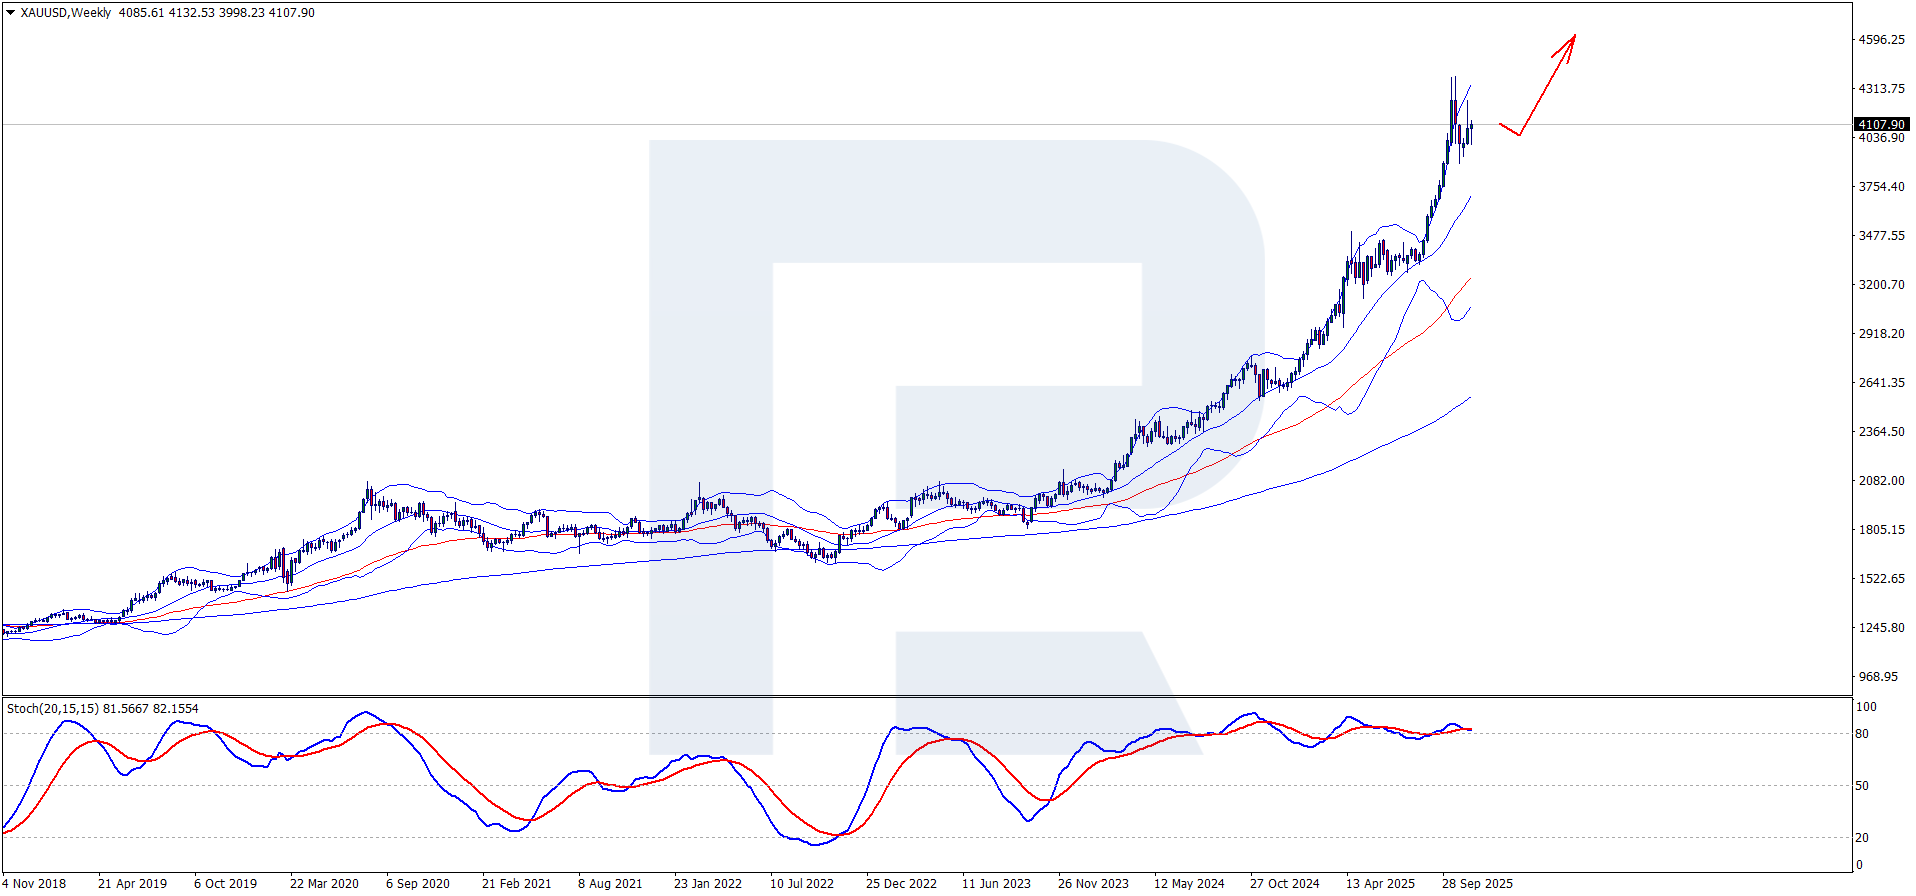
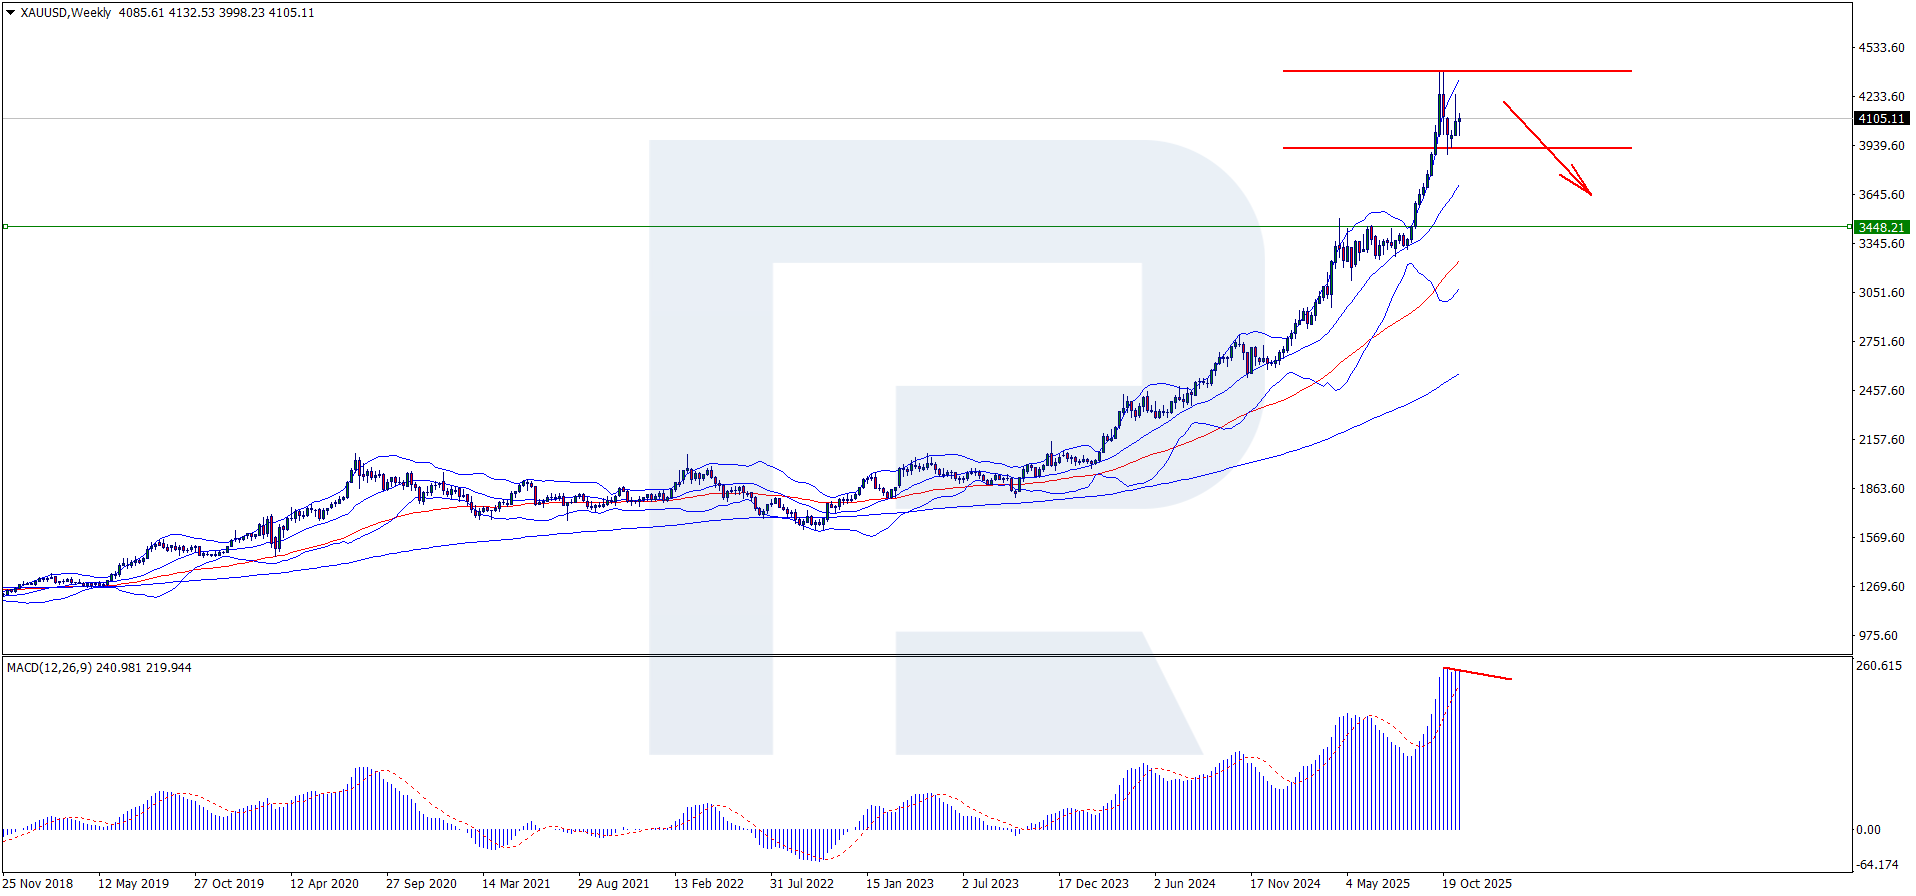
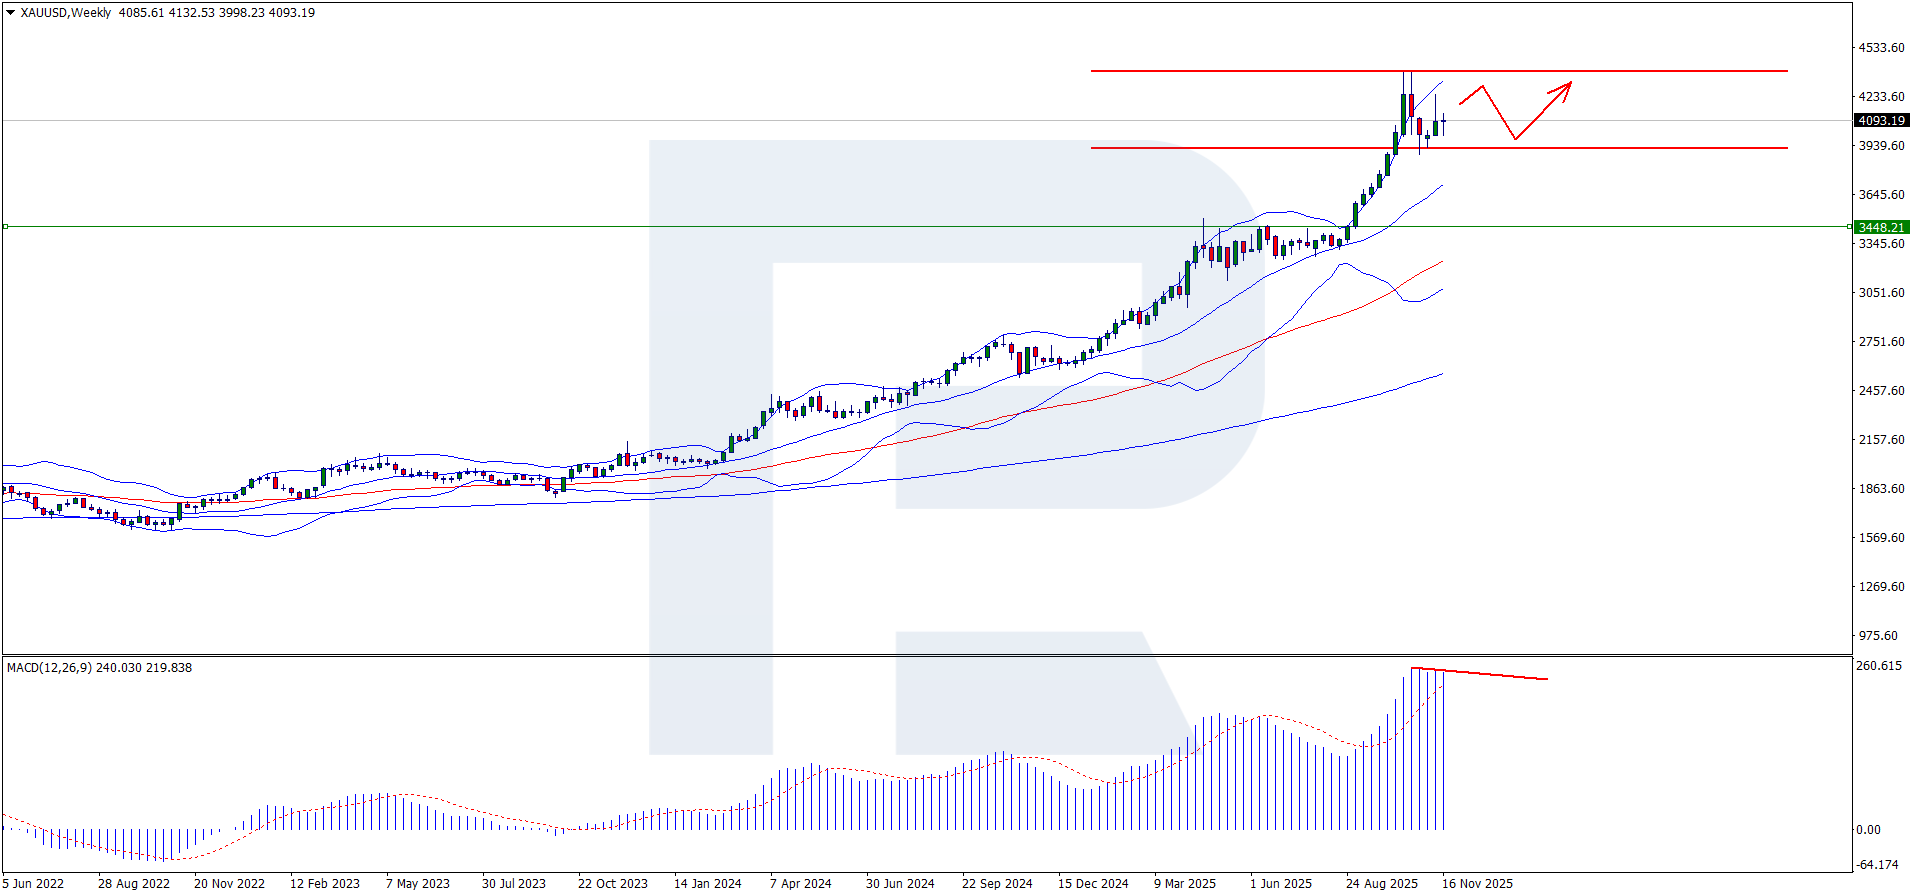
Al preparar un pronóstico a largo plazo del precio del oro, es importante considerar varios escenarios posibles. Este pronóstico destaca los niveles clave de soporte y resistencia y analiza el comportamiento del precio dentro de las Bandas de Bollinger. Examina con qué frecuencia y en qué medida los precios logran romper cualquiera de los lados de este indicador de tendencia, lo que ayuda a comprender mejor las tendencias actuales del mercado y el sentimiento de los inversores. Cabe señalar que, cuando se rompen niveles clave, el oro puede acelerar su movimiento alcista o entrar en una corrección, dependiendo de los cambios en el entorno económico externo.
Escenario alcista
En el marco temporal semanal, XAUUSD se ha mantenido de forma consistente por encima de la línea media del indicador de Bandas de Bollinger desde 2024, lo que indica una tendencia alcista predominante. Actualmente, los precios también se sitúan por encima de esta línea, rompiendo regularmente la banda superior, lo que señala un aumento de la presión compradora. Dentro del escenario positivo y del pronóstico del precio de XAUUSD, puede esperarse un mayor crecimiento del metal precioso, con una ruptura del nivel psicológico de 4.500 USD. La consolidación por encima de esta marca probablemente conducirá a una nueva prueba de la frontera superior de las Bandas de Bollinger. Anteriormente, se produjo una aceleración del crecimiento cuando se superó la frontera superior del indicador; por lo tanto, si el precio se consolida por encima de 4.500 USD, puede esperarse la continuación de la tendencia alcista, con el siguiente objetivo en 5.000 USD.
Escenario bajista
Un posible escenario bajista está asociado con el inicio de una onda descendente en el indicador MACD. Si los precios del oro caen hacia 3.925 USD, esto creará las condiciones para una corrección y desencadenará una caída de las cotizaciones de XAUUSD. El objetivo a la baja más cercano será el nivel clave de soporte en 3.450 USD. Una ruptura de este nivel abrirá el camino para un descenso más profundo hacia 3.200 USD como parte de una onda correctiva. Este patrón se forma cuando el precio rompe el nivel de soporte, confirmando un cambio de tendencia.
Escenario lateral
Las cotizaciones de XAUUSD ya han rebotado desde el nivel de resistencia de 4.381 USD, luego han caído hasta el nivel de soporte de 3.925 USD y se han impulsado al alza desde él. En la actualidad, los precios vuelven a subir y se acercan a la resistencia. Si la presión compradora resulta insuficiente, es posible un nuevo retroceso hacia el nivel de soporte de 3.925 USD. Si se produce un nuevo descenso pero los vendedores no logran superar el soporte, los precios pueden reanudar su crecimiento mientras se mantienen dentro del rango lateral. Este escenario indicaría incertidumbre en el mercado y la espera de nuevos factores que puedan determinar la futura dirección del movimiento y sacar los precios del rango.
Pronóstico experto del precio del oro para 2026 y más allá
J.P. Morgan
J.P. Morgan ha reforzado su pronóstico alcista para el oro en 2026, destacando su atractivo continuo como instrumento de cobertura en medio de tensiones geopolíticas, una posible recesión y compras activas por parte de los bancos centrales. Según la previsión más reciente del banco, el precio medio del oro hacia mediados de 2026 podría situarse en el rango de 5.200–5.300 USD por onza. En opinión de J.P. Morgan, este crecimiento está respaldado por una fuerte demanda de inversión, compras de oro de los bancos centrales y un amplio deseo de proteger los activos frente a riesgos sistémicos y de inflación.
UBS
UBS ha elevado su pronóstico base del oro a 4.200-4.700 USD por onza, impulsado por los riesgos de inflación, las tensiones geopolíticas y el cambio en las expectativas sobre las decisiones de tipos de la Reserva Federal. La fuerte demanda de los bancos centrales, el creciente interés por los ETF y la mayor participación tanto de inversores minoristas como institucionales siguen apoyando los precios, mientras que la oferta se mantiene restringida. UBS también mantiene una posición larga en oro dentro de sus asignaciones de activos globales y asiáticas.
Deutsche Bank
Deutsche Bank ha aumentado su pronóstico del precio del oro para 2026: el nuevo precio medio esperado es de 4.450 USD por onza, frente a los 4.000 USD anteriores. El rango de precios proyectado del oro para 2026 se sitúa entre 3.950 y 4.950 USD por onza. El principal factor detrás de esta revisión es el flujo constante de inversiones en oro y la demanda persistente de los bancos centrales, que están comprando la mayor parte de la oferta disponible en el mercado.
Goldman Sachs
Goldman Sachs elevó su pronóstico del oro a mediados de 2026 hasta 5.000 USD. El cambio en la política monetaria de la Reserva Federal llevó al banco a revisar el calendario previsto. No obstante, los analistas siguen confiando en una tendencia alcista estable, impulsada por la creciente demanda mundial, incluidas las compras de fondos de inversión y bancos centrales.
Bank of America
Bank of America espera que el oro alcance los 5.000 USD por onza en 2026, con un potencial alcista adicional bajo escenarios más agresivos. Entre los impulsores clave se encuentran la crisis de la deuda soberana de EE. UU., la debilidad del dólar y el aumento de las compras de oro por parte de los países BRICS. BofA también señala que, incluso si el dólar se mantiene fuerte, el oro sigue siendo un activo estratégico en el contexto de la tendencia global hacia la desdolarización.
Citi Research
Citi Research espera que el oro se consolide en torno a 3.250 USD en 2026, mientras que en un escenario optimista los precios pueden superar los 3.500 USD, respaldados por el fortalecimiento de la demanda de inversión y el aumento de las tensiones geopolíticas.
Pronósticos expertos del precio del oro para 2030
Muchos expertos coinciden en la tendencia alcista a largo plazo del precio de XAUUSD, ya que diversos factores fundamentales apuntan en esa dirección. A continuación, se presentan algunas de las opiniones de los expertos:
Charlie Morris, responsable de Multi Asset en Atlantic House Investments, en un artículo de la revista Alchemist pronostica un posible precio de XAUUSD de 7.000 USD por onza para 2030. Su previsión se basa en varios factores clave. En primer lugar, se espera que la inflación real aumente, y Morris cree que podría alcanzar el 4% por década. En segundo lugar, se prevén cambios en los tipos de interés reales. Además, se tiene en cuenta una prima de valor justo, que podría incrementarse de forma significativa. Estos supuestos se basan en el análisis de las tendencias actuales y pasadas de la economía y del mercado del oro.
Otro analista, Peter Leeds, pronostica que el precio de XAUUSD podría alcanzar los 10.000 USD por onza para 2030, impulsado por una serie de factores económicos y geopolíticos. Entre los principales motores del crecimiento se encuentran el debilitamiento del dólar estadounidense debido al enorme endeudamiento nacional, el creciente déficit presupuestario y su papel decreciente en el comercio internacional, especialmente por el menor uso del petrodólar. Los países BRICS, que están aumentando activamente sus reservas de oro, también tienen un impacto importante: se espera que su nueva moneda respaldada por oro se convierta en un serio competidor del dólar. Un factor adicional de crecimiento será la inestabilidad económica global y la creciente demanda de oro como activo de "seguro".
El autor subraya que los precios de XAUUSD crecerán anualmente, pero el momento de alcanzar la marca de 10.000 USD dependerá de la velocidad de desarrollo de los procesos mencionados. Entre los factores desencadenantes clave podrían encontrarse la intensificación de los conflictos geopolíticos, la devaluación del dólar o la transición masiva de los inversores hacia el oro. Para maximizar los beneficios, se recomienda invertir tanto en oro físico como en acciones de compañías mineras de oro con bajos niveles de deuda y altas reservas. El oro sigue siendo una sólida defensa contra los trastornos económicos y la pérdida del poder adquisitivo de las monedas.
Ventajas y desventajas de invertir en oro
El oro ha sido durante mucho tiempo uno de los instrumentos más populares para la protección del capital y la mitigación de riesgos. Aunque tiene muchas ventajas, como la protección contra la inflación y la diversificación de la cartera, es importante tener en cuenta las desventajas de invertir en este activo. Para un inversor, conocer las ventajas y desventajas de invertir en oro ayuda a tomar decisiones de inversión informadas.
Ventajas
- Protección contra la inflación: tradicionalmente, el oro sirve como una cobertura fiable contra la inflación. A medida que suben los precios y disminuye el poder adquisitivo de la moneda, el oro mantiene o incluso incrementa su valor, ayudando a los inversores a proteger sus ahorros.
- Diversificación de la cartera: el oro puede aportar diversificación a una cartera de inversión, ya que su valor suele tener baja correlación con las acciones y los bonos. Por lo tanto, el precio de este metal precioso a menudo se mueve en dirección opuesta, reduciendo el riesgo general de la cartera.
- Liquidez: el oro es un activo altamente líquido que puede comprarse y venderse fácilmente en los mercados globales. Esto lo hace atractivo para los inversores que pueden necesitar convertir rápidamente sus activos en efectivo.
- Activo refugio en crisis: durante períodos de inestabilidad económica o geopolítica, XAUUSD suele considerarse un activo "refugio". Los inversores tienden a invertir en el metal en tiempos de incertidumbre, lo que a menudo sostiene e incluso puede aumentar el valor del oro cuando otros activos pueden estar cayendo.
- Activo tangible: a diferencia de las acciones o los bonos, el oro es un activo físico y tangible que puede poseerse y almacenarse. Esto da a los inversores una sensación de confianza y seguridad en comparación con los activos digitales.
- Preservación del valor a largo plazo: con el tiempo, el oro ha mantenido su valor, lo que lo convierte en un medio fiable de preservar la riqueza a través de generaciones. Es menos susceptible a los riesgos asociados con las monedas fiduciarias y otros activos financieros.
- Demanda global: el oro tiene demanda en todo el mundo, tanto como mercancía para uso industrial como reserva de valor. Esta demanda global apoya la estabilidad y proporciona potencial de crecimiento de precios.
Desventajas
- Falta de ingresos pasivos: a diferencia de las acciones o los bonos, el oro no genera ingresos pasivos, como dividendos o intereses. Los inversores solo pueden contar con la apreciación del oro, que puede ser impredecible.
- Volatilidad: a pesar de su reputación como activo estable, el oro puede experimentar importantes fluctuaciones de precios a corto plazo. Estas oscilaciones pueden provocar pérdidas para los inversores que se centran en beneficios a corto plazo.
- Costes de almacenamiento: el oro físico requiere un almacenamiento seguro, especialmente cuando se mantiene en grandes cantidades. Esto añade costes adicionales que pueden reducir la rentabilidad global de las inversiones en oro.
- Falta de rendimiento: el oro no genera ingresos, a diferencia de los bonos o las acciones. Esto puede ser una desventaja para los inversores que buscan ingresos pasivos regulares de sus inversiones.
- Dependencia de factores globales: el valor del oro depende de numerosos factores, como la oferta y la demanda, los indicadores económicos y la situación geopolítica. Esto significa que los precios del oro pueden verse afectados por choques externos sobre los que los inversores no tienen control.
- Riesgos de manipulación del mercado: los precios de XAUUSD pueden verse afectados por manipulaciones del mercado, especialmente por parte de grandes instituciones financieras o estados, lo que puede provocar cambios de precios impredecibles.
- Coste de oportunidad: invertir en oro significa, en esencia, inmovilizar capital en un activo que no genera rendimiento. Esto puede llevar a perder oportunidades de invertir en otros activos que podrían ofrecer mayores retornos con el tiempo, como acciones o bonos.
Conclusión
El fuerte aumento de los precios del oro en 2025 está impulsado por la inestabilidad política y económica, incluidos los conflictos geopolíticos y la flexibilización de la política monetaria de la Reserva Federal de EE. UU. Los bancos centrales, especialmente en los países en desarrollo, incrementaron sus compras de oro, mientras que los inversores minoristas utilizaron activamente el oro para cubrirse frente a la inflación y la depreciación de las monedas. Además, el creciente endeudamiento nacional de EE. UU. y las propuestas arancelarias de Trump apoyaron la demanda de oro como activo refugio frente a la incertidumbre y la volatilidad.
Según el análisis técnico, el oro mantiene su impulso alcista en el gráfico. Los compradores han conseguido mantener los precios por encima de la línea EMA-65 durante un periodo prolongado. El pronóstico del oro para 2026 apunta a una posible subida hacia los niveles de 4.500 USD y 5.000 USD, siempre que se produzca una fuerte consolidación por encima de la resistencia más cercana en 4.381 USD. El oscilador estocástico confirma el impulso alcista, señalando una posible continuación del movimiento ascendente. Sin embargo, una ruptura por debajo de la frontera inferior del triángulo con consolidación del precio por debajo de 3.925 USD puede desencadenar una corrección bajista hacia 3.450 USD o incluso niveles inferiores.
Los pronósticos del oro para 2026 van desde moderados hasta optimistas. En general, los analistas prevén un aumento de los precios del metal, con estimaciones que oscilan entre 4.500 y 5.000 USD. Se espera que las expectativas de recortes de tipos por parte de la Fed, junto con la demanda de los bancos centrales y los inversores, incluidas las compras físicas y los ETF, sigan apoyando los precios. No obstante, un posible fortalecimiento del dólar estadounidense y el aumento de los rendimientos de los bonos podrían suponer riesgos para este crecimiento. Aun así, el oro mantiene un fuerte potencial alcista, especialmente si se intensifica la inestabilidad política o los riesgos económicos.
FAQ
Si es buen momento o no para comprar oro depende de las condiciones actuales del mercado, de los indicadores económicos y de sus objetivos financieros. Dado el papel del oro como cobertura frente a la inflación y la devaluación de la moneda, puede ser una inversión acertada durante períodos de incertidumbre económica o cuando se espera que la inflación aumente. Es importante tener en cuenta tanto las tendencias actuales del precio de XAUUSD como los pronósticos económicos más amplios antes de tomar una decisión.
Es probable que invertir en oro pueda proporcionar beneficios significativos a largo plazo. Históricamente, el oro ha mantenido su valor durante siglos, ofreciendo protección frente a la inestabilidad económica y la inflación. Es una forma eficaz de diversificar una cartera de inversión, ya que sus movimientos de precios suelen diferir de los de las acciones y los bonos. Sin embargo, como cualquier inversión, conlleva riesgos y debe equilibrarse con otros tipos de activos para gestionar el riesgo global.
Los pronósticos del precio del oro para hoy se pueden encontrar en la sección de Análisis de Mercado de RoboForex.
Los expertos pronostican que los precios del oro en el tercer trimestre de 2025 fluctuarán dentro del rango de 3.900–4.500 USD, y algunos escenarios contemplan una caída hasta 3.925 USD. La flexibilización de la política monetaria de la Reserva Federal, los riesgos geopolíticos y las preocupaciones sobre la sostenibilidad fiscal de EE. UU. siguen respaldando la tendencia alcista. Sin embargo, los analistas advierten de que, hacia finales de 2025, la demanda de inversión podría empezar a debilitarse, especialmente si el dólar estadounidense se fortalece y la economía de EE. UU. muestra signos de recuperación. Las proyecciones de fin de año varían, pero el crecimiento hacia 5.000 USD sigue siendo posible en 2026. A pesar de los posibles riesgos, el oro sigue considerándose un activo refugio estratégico en medio de la inestabilidad global, por lo que su compra se justifica desde una perspectiva de inversión a largo plazo.
Aunque la rentabilidad de cualquier inversión no está garantizada, el oro podría ser rentable en los próximos cinco años, especialmente si las condiciones económicas o geopolíticas generan incertidumbre o inestabilidad. El comportamiento histórico del oro en tales períodos sugiere que podría apreciarse en valor en circunstancias similares en el futuro. Los inversores deben prestar atención a los indicadores económicos globales y a las políticas de los bancos centrales, ya que desempeñarán un papel importante en la configuración de la dinámica del mercado del oro. La diversificación y el seguimiento cuidadoso serán claves para gestionar el riesgo de inversión y aprovechar las posibles oportunidades del mercado del oro.
Los pronósticos de los mercados financieros son la opinión personal de sus autores. El análisis actual no es una guía de trading. RoboForex no se hace responsable de los resultados que puedan ocurrir por utilizar las recomendaciones presentadas.

