Japanese Candlesticks Analysis 12.06.2018 (GOLD, NZDUSD)
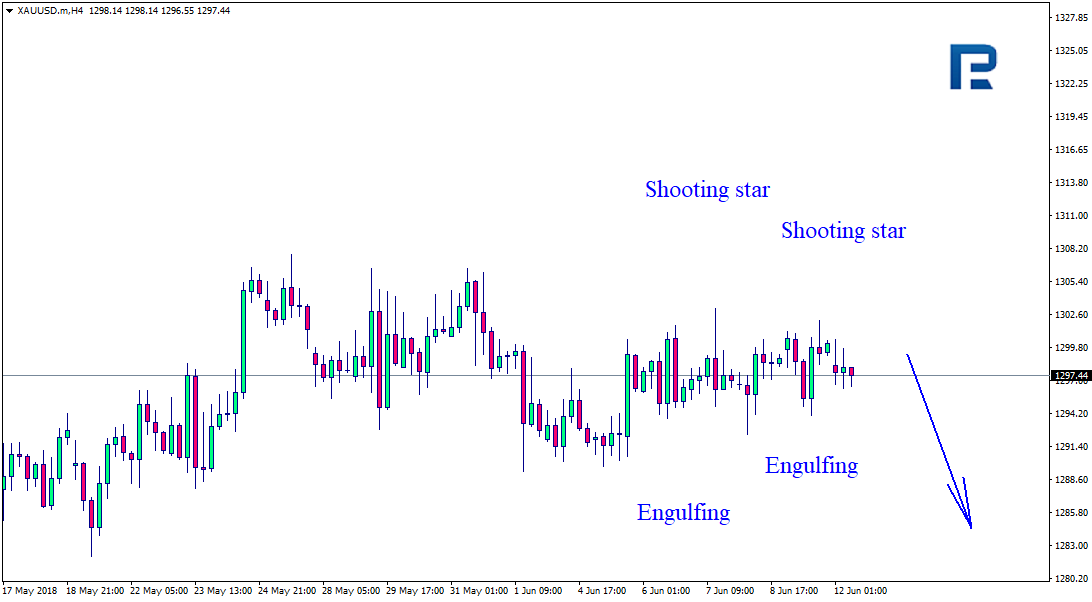
XAUUSD, “Gold vs US Dollar”
As we can see in the H4 chart, after reaching the support level, XAUUSD is still moving sideways and forming Harami, Hammer, Inverted Hammer, and Doji reversal patterns. Judging by the previous movements, it may be assumed that after finishing this sideways movement the price may try to break the support level and then continue moving downwards.

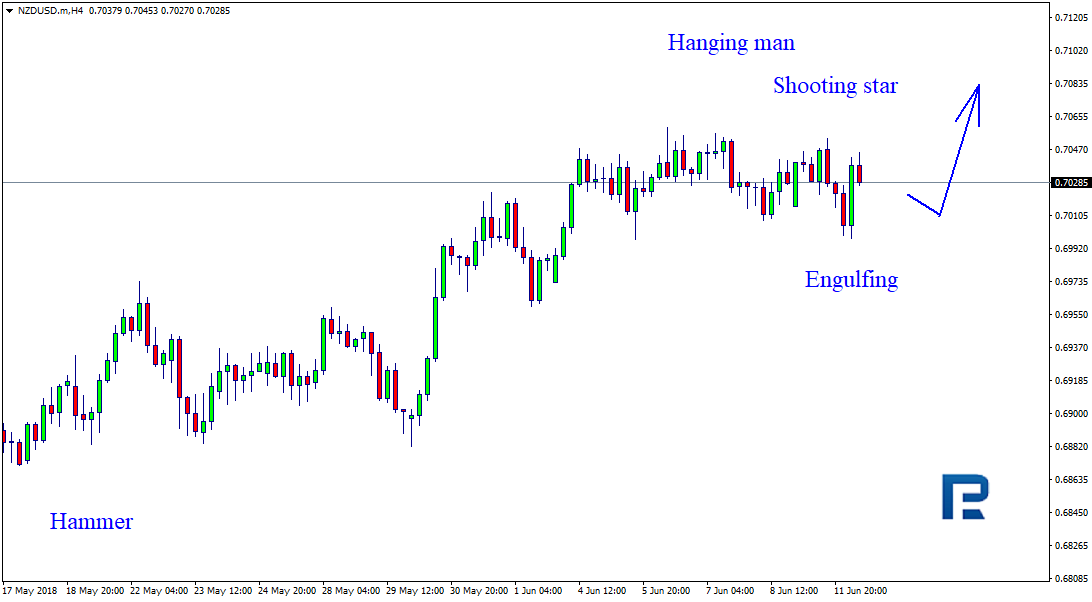
NZDUSD, “New Zealand vs. US Dollar”
As we can see in the H4 chart, after reaching a new high, NZDUSD has formed several Shooting Star, Engulfing, and Doji reversal patterns, and right now is trading sideways. At the moment, it may be assumed that the instrument may complete the correction, update its closest high, and then continue the uptrend.
Forecasts presented in this section only reflect the author’s private opinion and should not be considered as guidance for trading. RoboForex bears no responsibility for trading results based on trading recommendations described in these analytical reviews.