Japanese Candlesticks Analysis 19.06.2020 (GOLD, NZDUSD, GBPUSD)
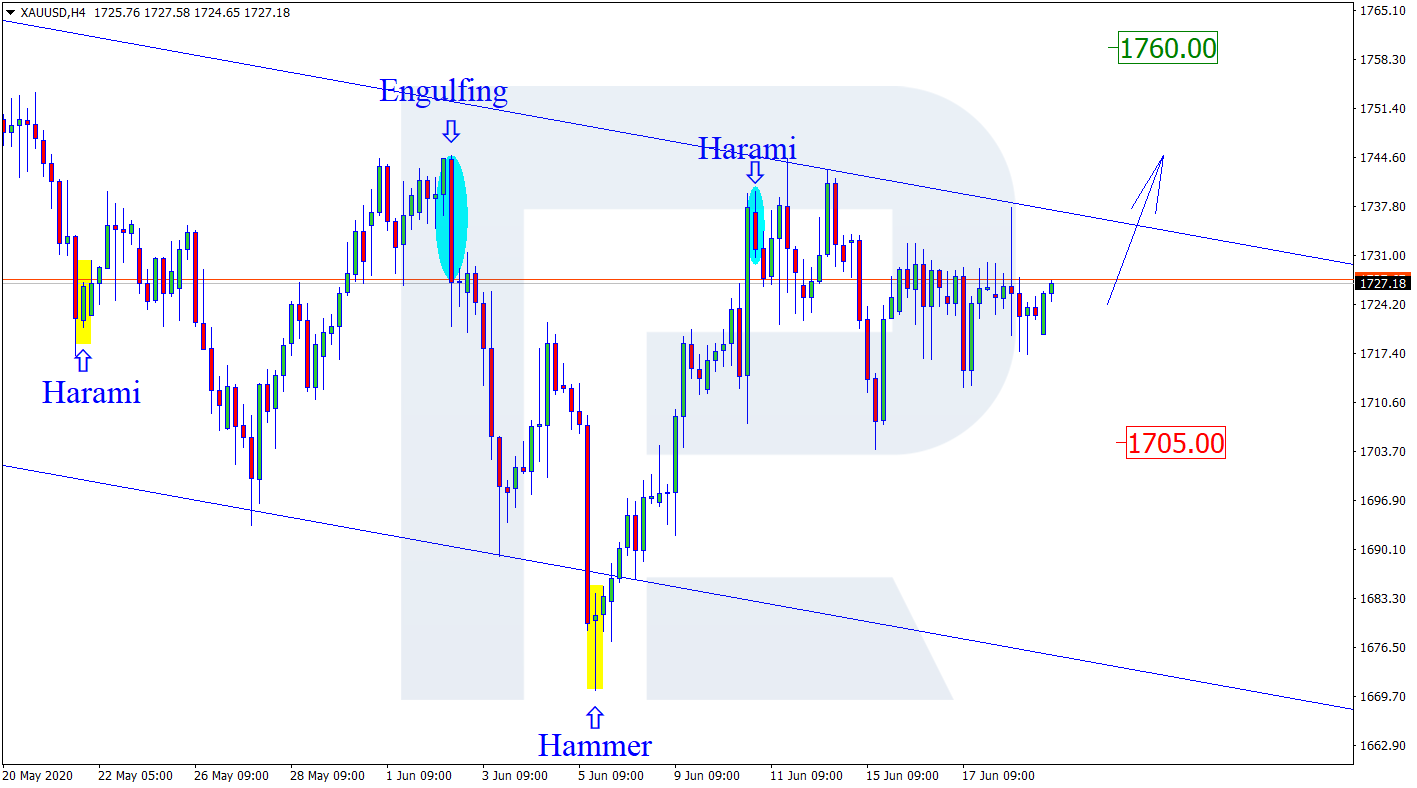
XAUUSD, “Gold vs US Dollar”
As we can see in the H4 chart, after testing the resistance level, forming a Harami pattern, and then reversing, XAUUSD is still moving sideways. There are no signals so far, which may prioritize whether the pair should grow or fall. The instrument may resume the ascending tendency if it breaks the resistance level at 1760.00. At the same time, there might be another scenario, according to which the instrument may return to the support level at 1705.00.

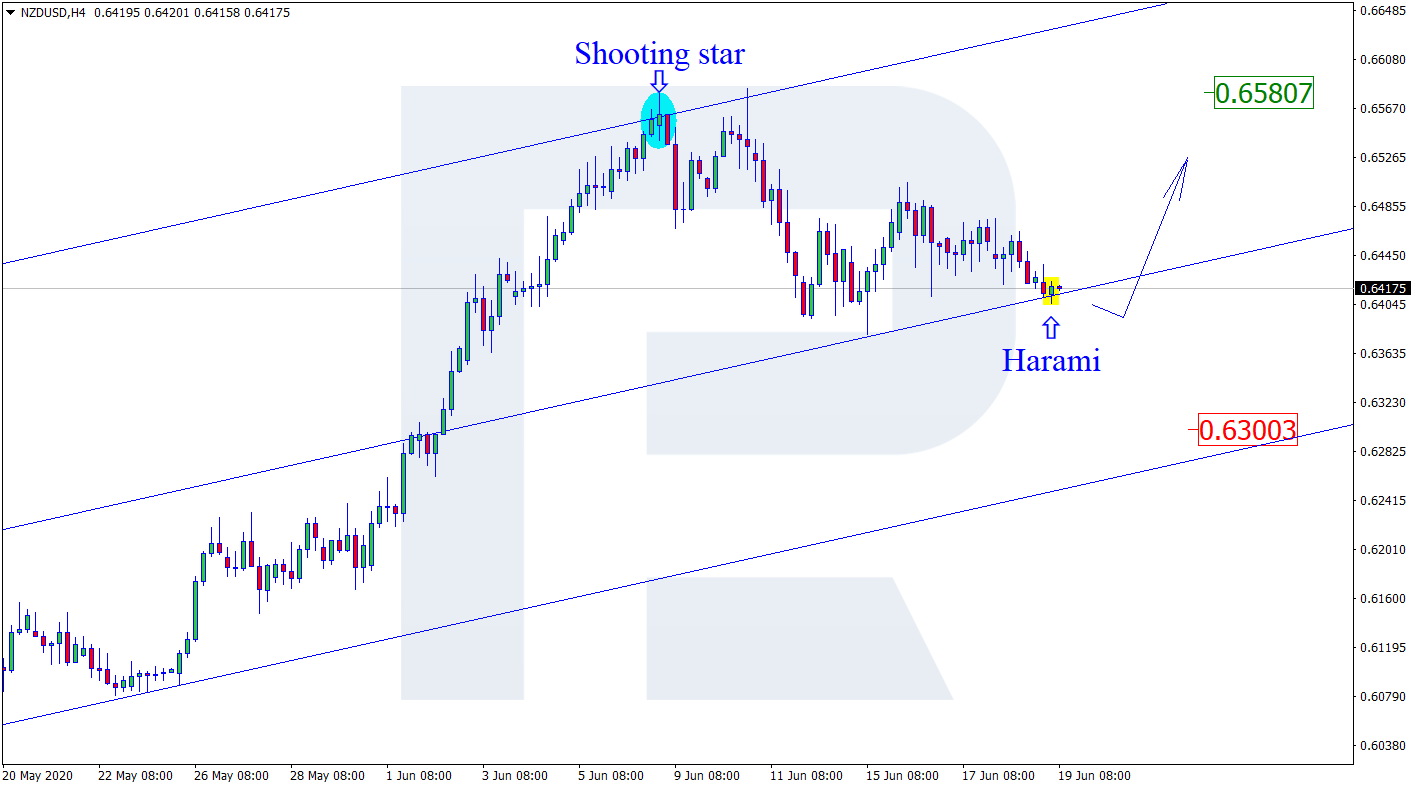
NZDUSD, “New Zealand vs. US Dollar”
As we can see in the H4 chart, after forming several reversal patterns, such as Harami, not far from the support level, NZDUSD is still moving inside the rising channel. Possibly, the pair may reverse and start a new correction to reach the resistance level at 0.6580. However, an opposite scenario implies that the instrument may fall and return to the support level at 0.6300.
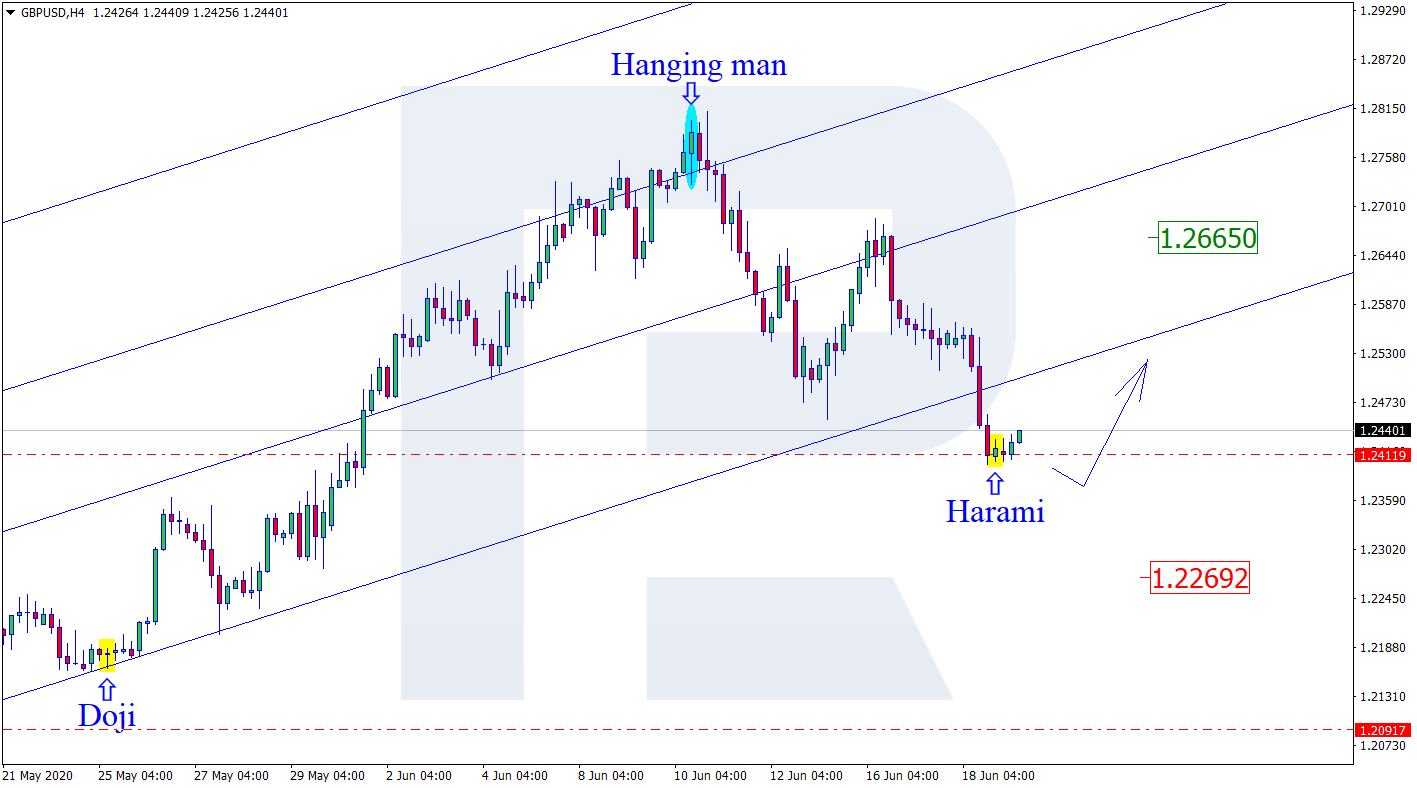
GBPUSD, “Great Britain Pound vs US Dollar”
As we can see in the H4 chart, after forming a Harami pattern while testing the support level, GBPUSD has started reversing. At the moment, the pair is expected to continue growing. The upside target is at 1.2665. Still, there is another scenario, which suggests that the instrument may continue the descending tendency towards the next support level at 1.2269.
Forecasts presented in this section only reflect the author’s private opinion and should not be considered as guidance for trading. RoboForex bears no responsibility for trading results based on trading recommendations described in these analytical reviews.