Fibonacci Retracements Analysis 01.11.2017 (GBP/USD, EUR/JPY)
GBP USD, “Great Britain Pound vs US Dollar”
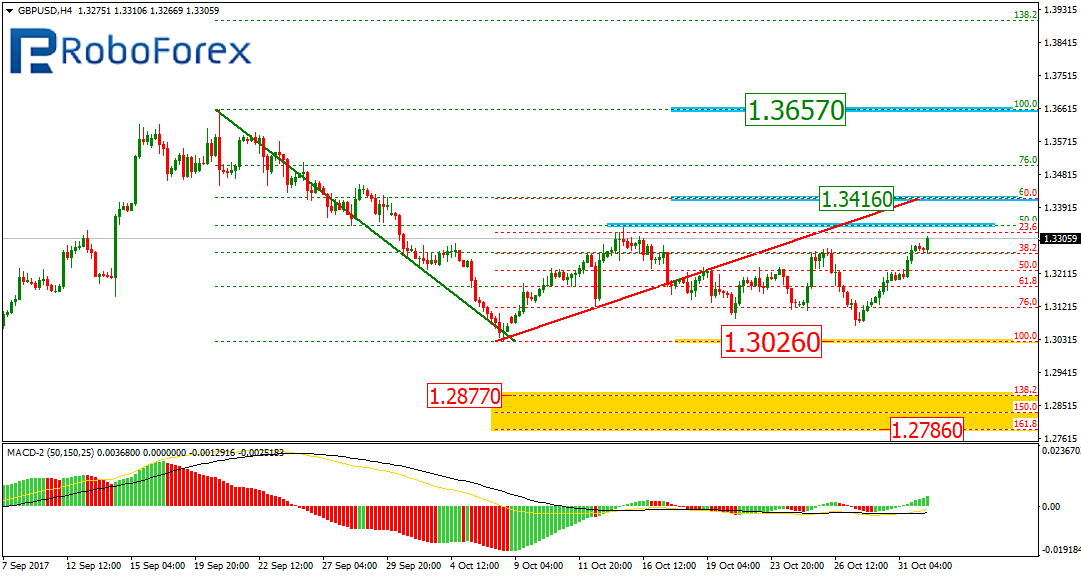
As we can see at the H4 chart, the current correction is taking too much time. The short-term target of the correction is the retracement of 61.8% at 1.3416. In order to continue the downtrend, the price has to break the local low at 1.3026. In this case, the closest targets will be inside the post-correctional extension area between the retracements of 138.2% and 161.8% at 1.2877 and 1.2786 respectively.
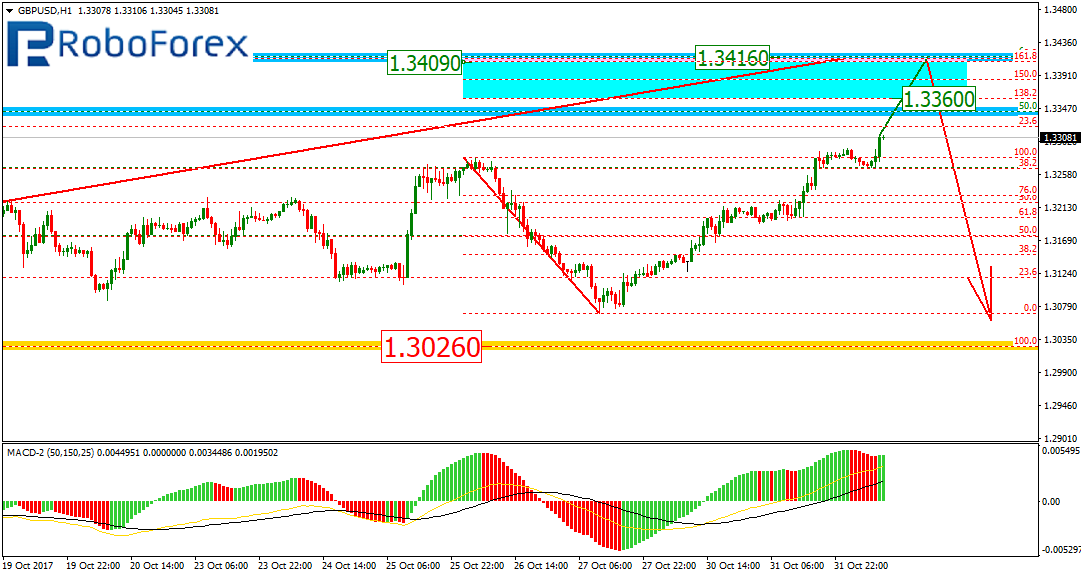
At the H1 chart, the pair continues moving upwards. The targets of the current ascending impulse are inside the post-correctional extension area between the retracements of 138.2% and 161.8% at 1.3360 and 1.3409 respectively. After finishing the correction, the instrument may start a new descending impulse.
EUR JPY, “Euro vs. Japanese Yen”
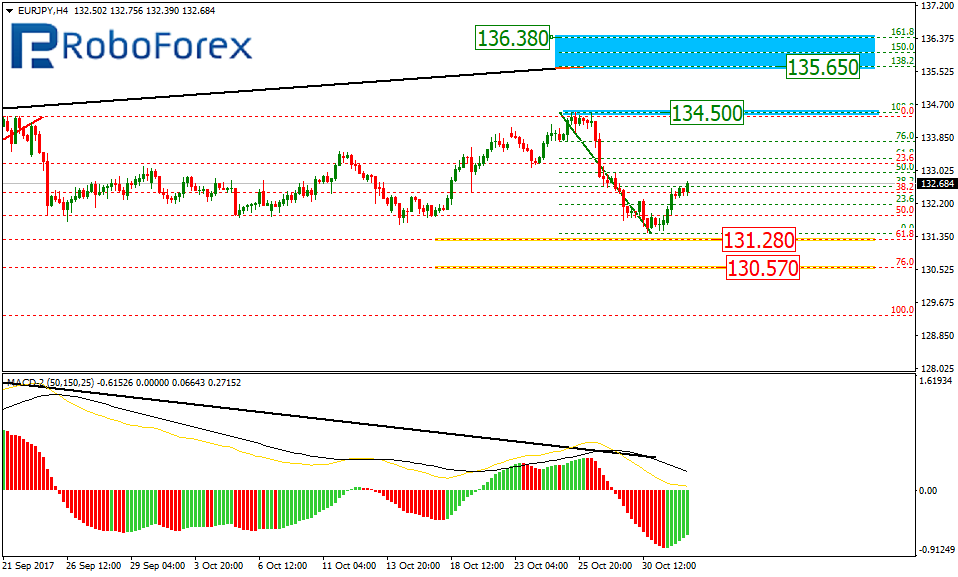
As we can see at the H4 chart, the mid-term correction to the downside continues. We may assume that after breaking the high at 134.50, the EUR/JPY pair may grow towards the post-correctional extension area between the retracements of 138.2% and 161.8% at 135.65 and 136.38 respectively. However, the descending correction may yet continue to reach the retracements of 61.8% and 76.0% at 131.28 and 130.57 respectively.
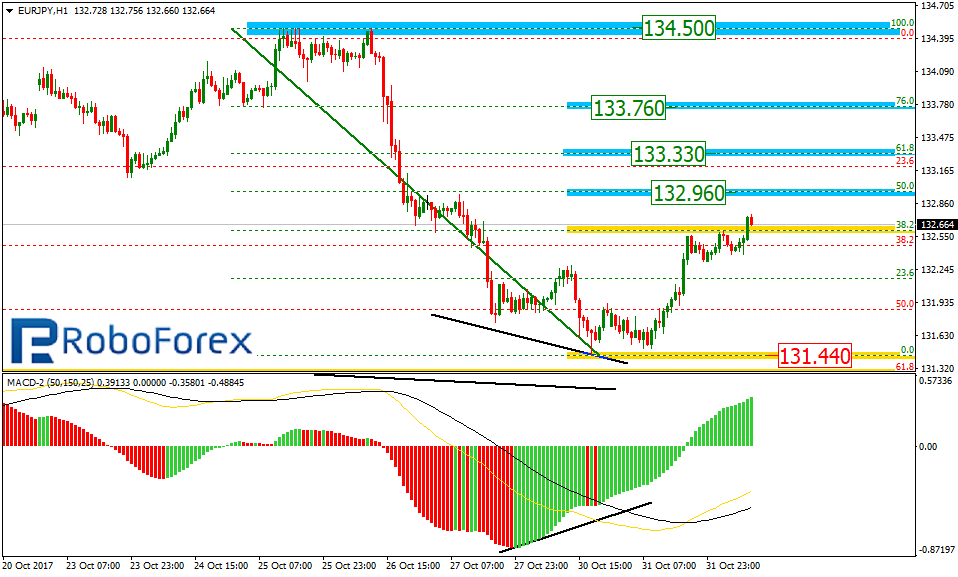
At the H1 chart, after finishing the descending impulse, the price has been corrected to the upside by 38.2%. The next targets of this ascending correction may be the retracement of 50.0%, 61.8%, and 76.0% at 132.96, 133.33, and 133.76 respectively.
RoboForex Analytical Department
Forecasts presented in this section only reflect the author’s private opinion and should not be considered as guidance for trading. RoboForex bears no responsibility for trading results based on trading recommendations described in these analytical reviews.