Fibonacci Retracements Analysis 05.12.2017 (EUR/USD, USD/JPY)
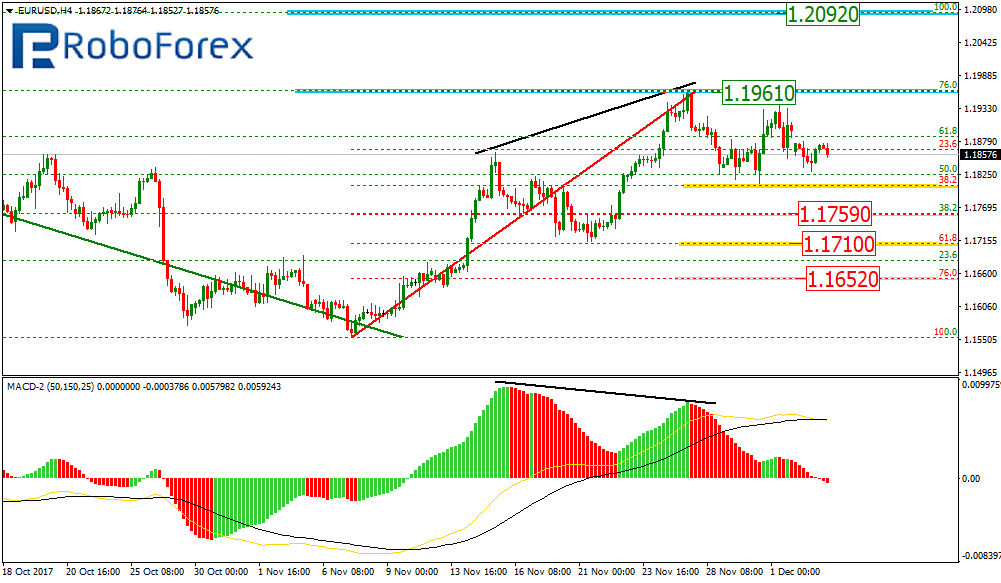
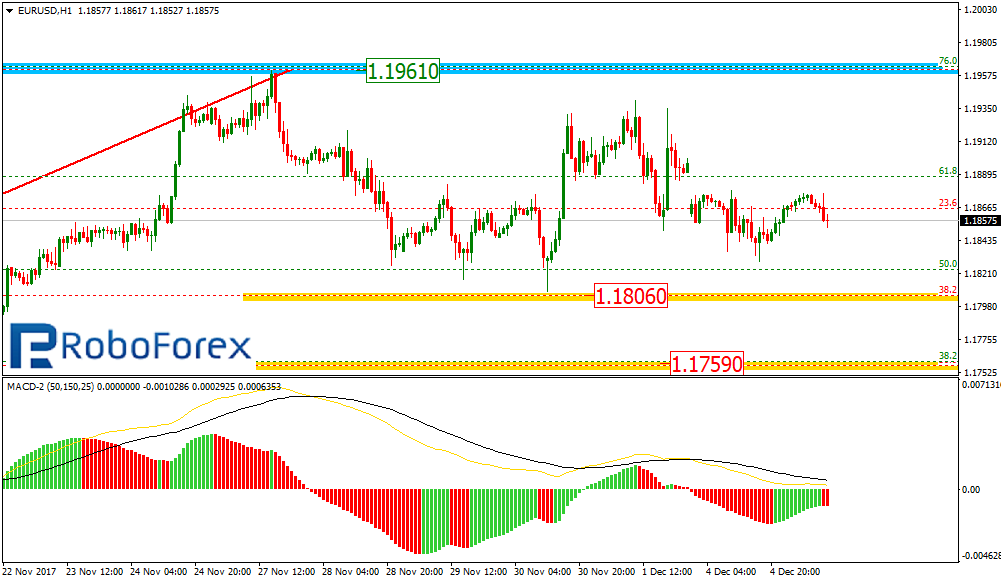
EUR USD, “Euro vs US Dollar”
As we can see at the H4 chart, the divergence was followed by a short-term correction, which has already reached the retracement of 38.2%. The next targets of this descending correction may be the retracements of 50.0%, 61.8%, and 76.0% at 1.1759, 1.1710, and 1.1652 respectively. At the same time, we should note that if the instrument breaks the local high at 1.1961, it will continue growing to update another high, which is at 1.2092.
At the H1 chart, the EUR/UISD pair is trading between 1.1961 and 1.1806. If the price breaks the latter level, the instrument will fall towards 1.1759.
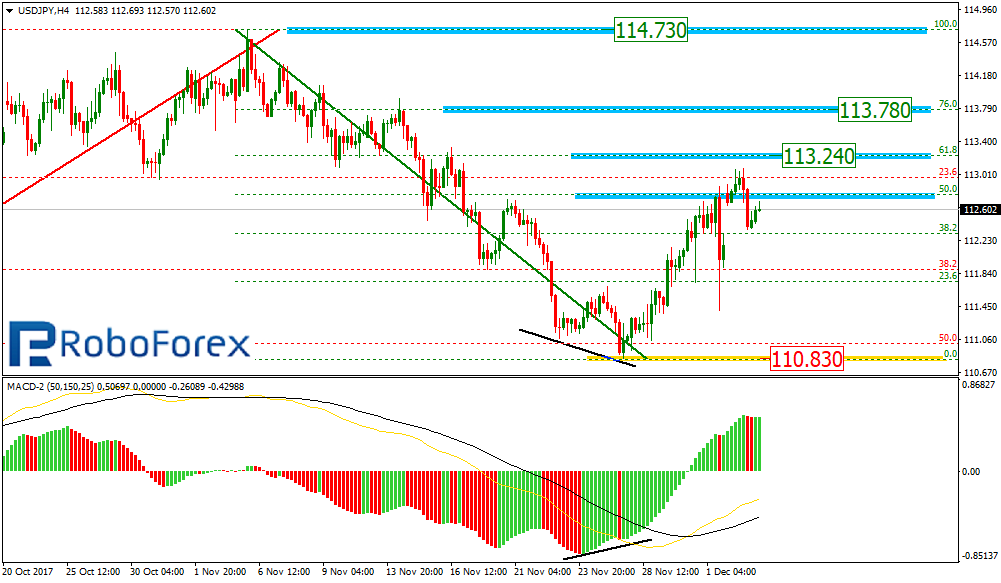
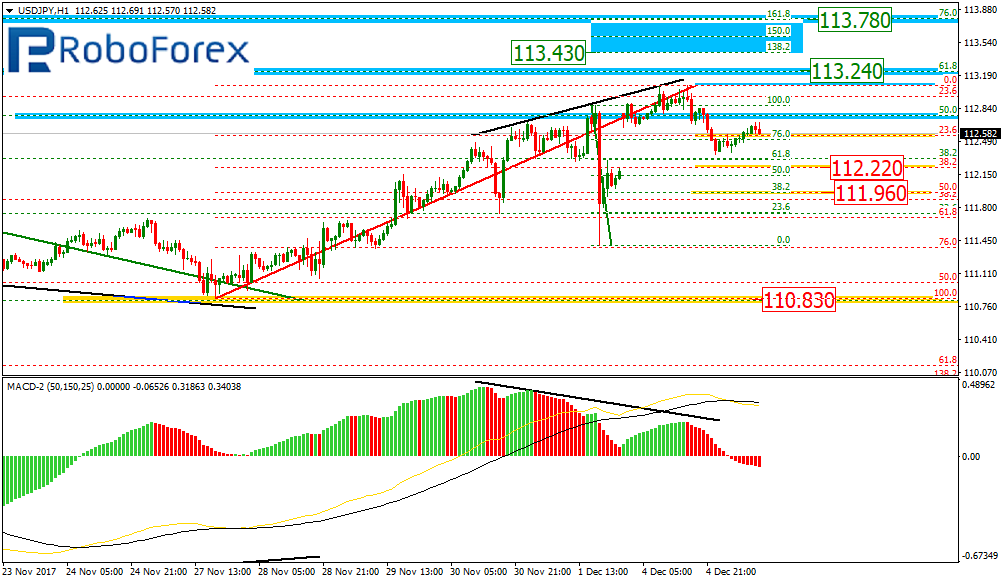
USD JPY, “US Dollar vs. Japanese Yen”
At the H4 chart, the USD/JPY pair is forming the ascending impulse, which has already reached the retracement of 50.0%. The next upside targets may be the retracements of 61.8% and 76.0% at 113.24 and 113.78 respectively.
At the H1 chart, the divergence is being formed, which indicates a short-term correction. By now, the correction has already reached the retracement of 23.6%. Later, the correction may continue towards the retracements of 38.2 and 50.0% at 112.22 and 111.96 respectively. After completing the correction, the instrument may resume growing to reach the post-correctional extension area between the retracements of 138.2% and 161.8% at 113.43 and 113.78 respectively.
RoboForex Analytical Department
Forecasts presented in this section only reflect the author’s private opinion and should not be considered as guidance for trading. RoboForex bears no responsibility for trading results based on trading recommendations described in these analytical reviews.