Fibonacci Retracements Analysis 11.10.2017 (GBP/USD, EUR/JPY)
GBP USD, “Great Britain Pound vs US Dollar”
As we can see at the H4 chart, the GBP/USD pair is being corrected to the upside and forming a new ascending impulse. The pair has already reached the retracement of 23.6%. the next targets are the retracements of 38.2% and 50.0% at 1.3265 and 1.3345 respectively. After reaching the retracement of 50.0%, the instrument may fall towards the post-correctional extension area between the retracements of 138.2% and 161.8% at 1.2905 and 1.2830 respectively.
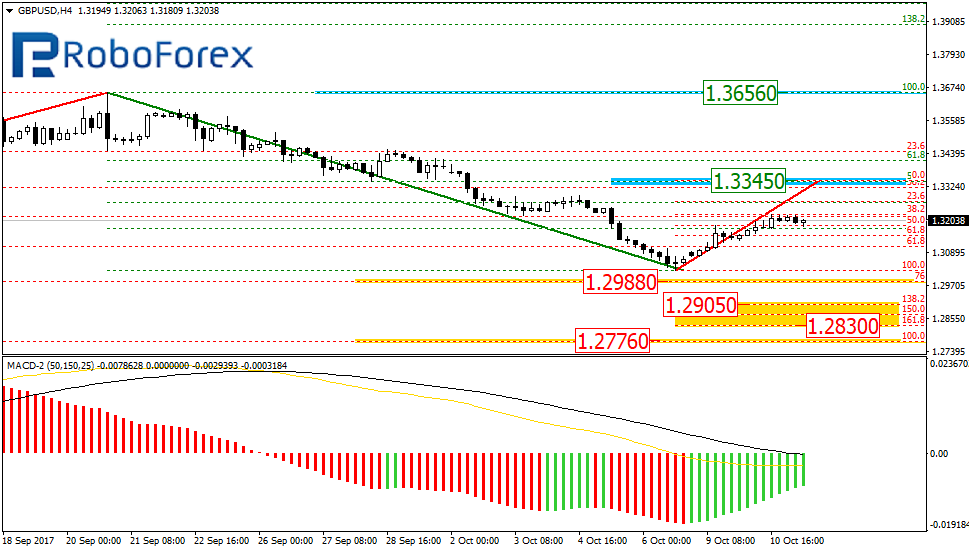
At the H1 chart, the uptrend is looking pretty stable. The next upside targets may be the retracements of 38.2% and 50.0%.

EUR JPY, “Euro vs. Japanese Yen”
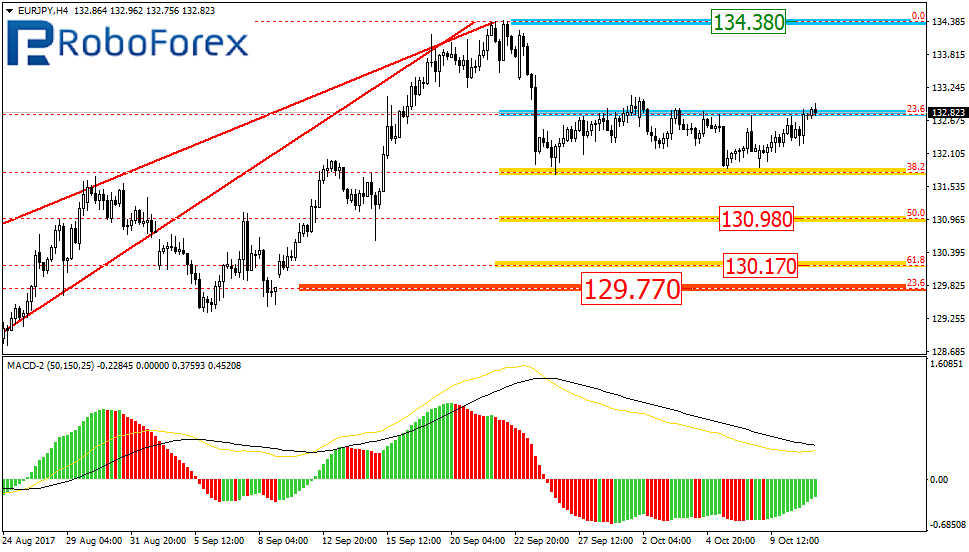
As we can see at the H4 chart, the EUR/JPY pair is still moving sideways. If we assume that the price is starting a new correction to the downside, then the closest significant target of this descending correction may be the retracement of 23.6% at 129.77. However, if we consider this decline as a correction of the previous ascending impulse, the next targets may be the retracements of 50.0% and 61.8% at 130.98 and 130.17 respectively. The resistance level is close to the high at 134.38.
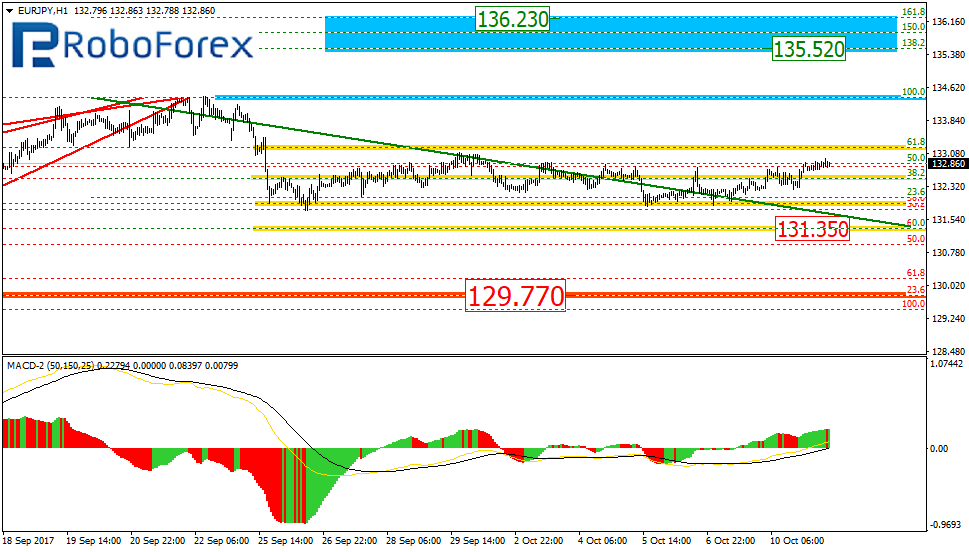
At the H1 chart, the pair may continue falling towards the retracement of 61.8% at 131.35. Later, the price is expected to form another ascending impulse, which may reach the post-correctional extension area between the retracements of 138.2% and 161.8% at 135.52 and 136.23 respectively, but only after breaking the high at 134.38.
RoboForex Analytical Department
Forecasts presented in this section only reflect the author’s private opinion and should not be considered as guidance for trading. RoboForex bears no responsibility for trading results based on trading recommendations described in these analytical reviews.