Fibonacci Retracements Analysis 13.11.2017 (GOLD, USD/CHF)
XAU USD, “Gold vs US Dollar”
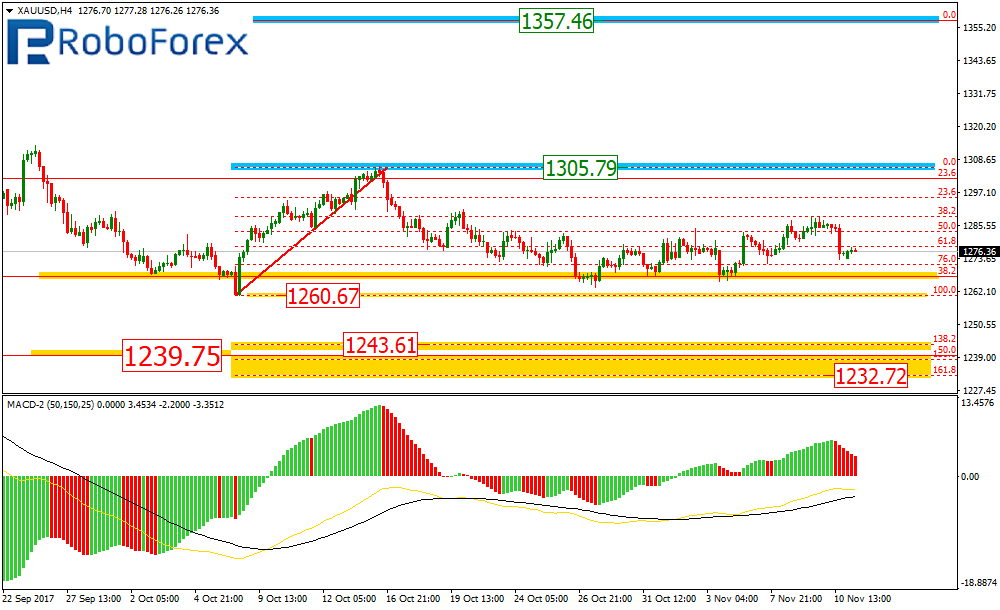
As we can see at the H4 chart, the downtrend continues, but a bit slower. The support level is still the local low at 1260.67. If the XAU/USD pair breaks it, the instrument may fall towards the post-correctional extension area between the retracements of 138.2% and 161.8% at 1243.61 and 1232.72 respectively.
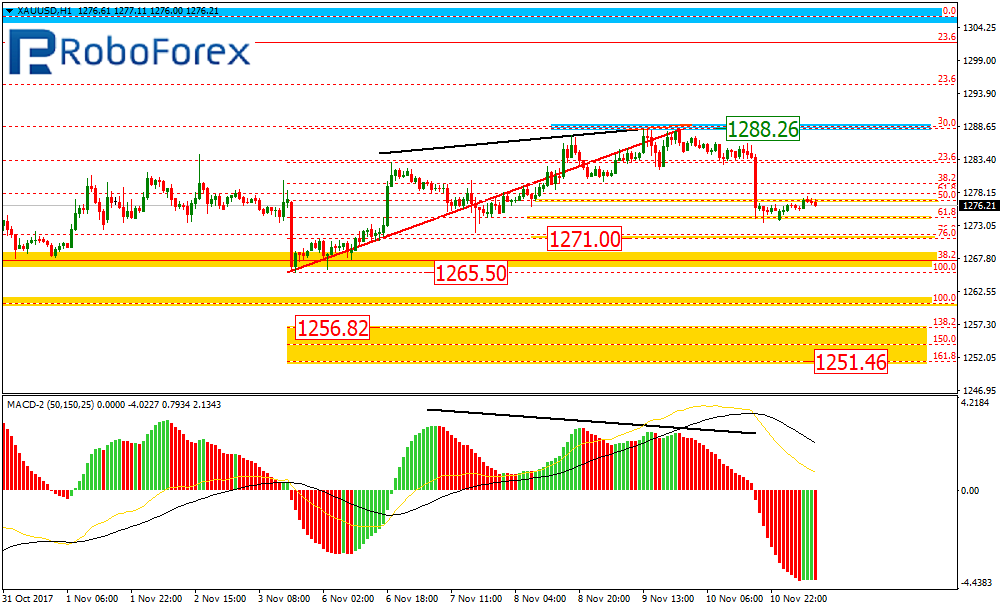
At the H1 chart, the pair is about to finish the descending correction, which has already reached the retracement of 61.8% and may yet continue towards the one of 76.0% at 1271.00. We should note that this decline might transform into a new descending impulse. After breaking the local low at 1265.50, the price may fall towards its next targets inside the post-correctional extension area between the retracements of 138.2% and 161.8% at 1256.82 and 1251.46 respectively.
USD CHF, “US Dollar vs Swiss Franc”
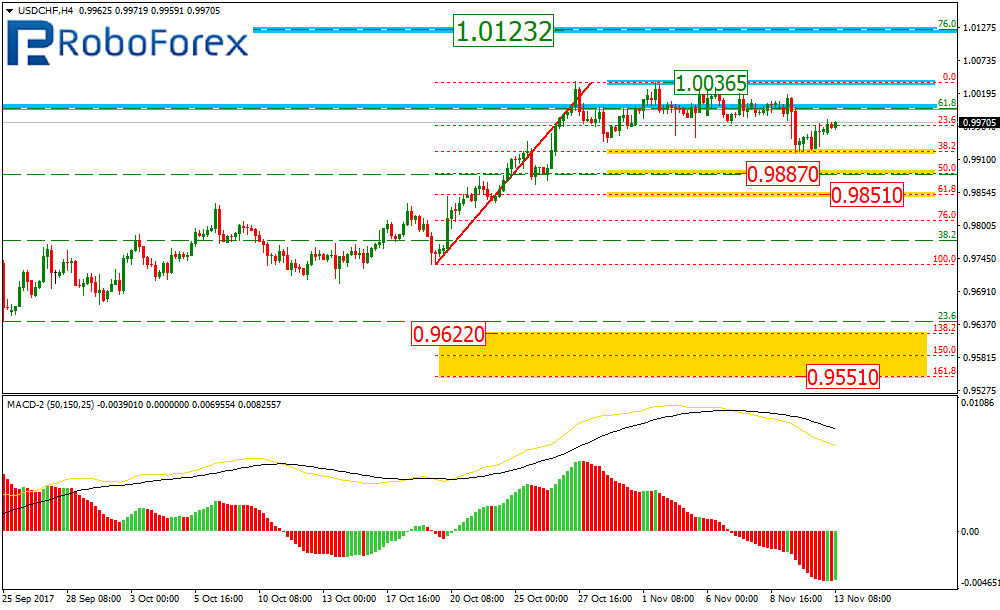
At the H4 chart, the uptrend continues, but right now the USD/CHF pair is forming a short-term correction to the downside, which has already reached the retracement of 38.2%. The next targets of this correction are the retracements of 50.0% and 61.8% at 0.9887 and 0.9851 respectively. If the price breaks the high at 1.0036, the uptrend will continue.
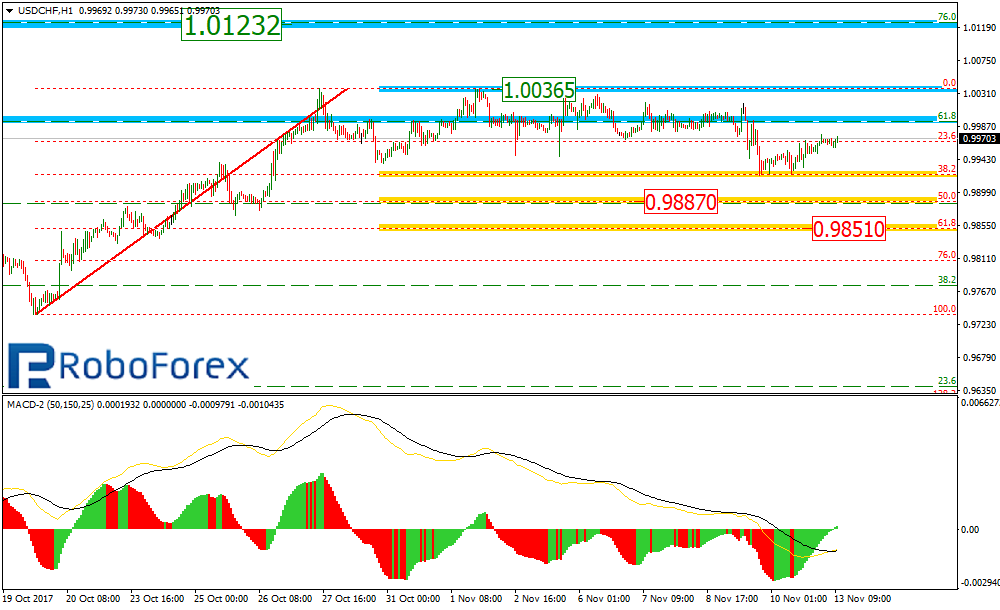
At the H1 chart, the current situation is the same.
RoboForex Analytical Department
Forecasts presented in this section only reflect the author’s private opinion and should not be considered as guidance for trading. RoboForex bears no responsibility for trading results based on trading recommendations described in these analytical reviews.