Fibonacci Retracements Analysis 17.07.2017 (XAU/USD, USD/CHF)
XAU/USD
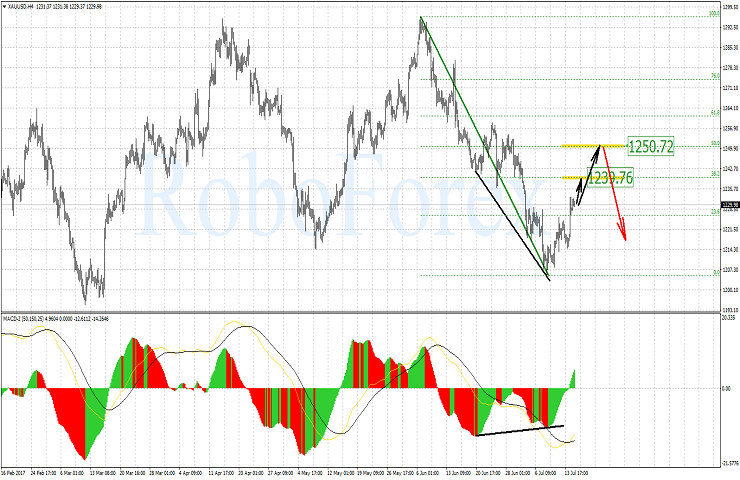
Looking at the H4-chart of GOLD we see that after the convergence had been formed, the downtrend gave place to an ascending correction. At the moment GOLD has been corrected to the Fibo 23.6% level. The Fibo levels 38.2% and 50.0% levels can be new targets for the correction rise.
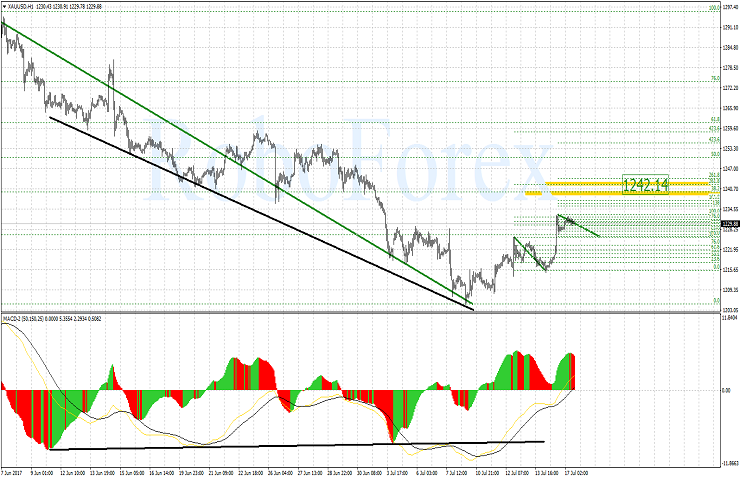
The H1-chart of GOLD suggests a further upside move. This move can have the 1242.14 level as a target. This level matches the possible target of a higher timeframe, but also corresponds to a range of target elongation levels at Fibo 261.8%.
USD/CHF
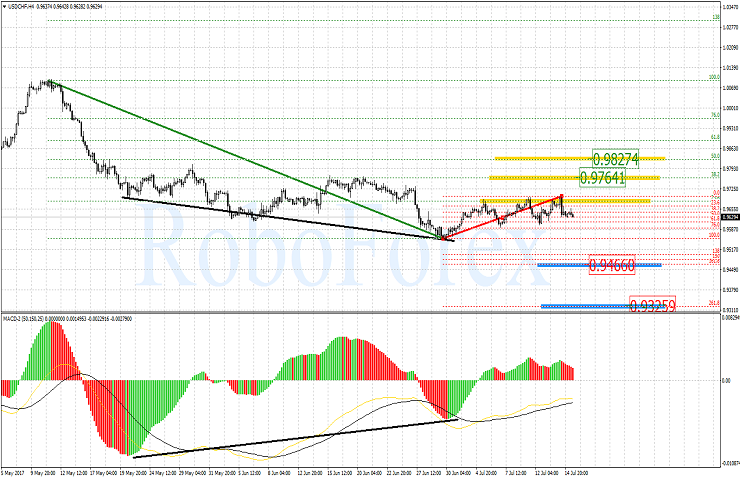
The H4-chart of USD/CHF suggests that the correction of the descending impulse is a time-based correction rather than price-based one because the price has failed to move higher than the Fibo 23.6% level so far. This correction move still has 0.9741 and 0.9827 levels as targets (these are 38.2% and 50.0% Fibo levels correspondingly). In case of a breakout of the local level the pair can continue moving downwards towards 0.9466 kand 0.9325 levels (Fibo elongation levels 161.8% and 261.8%).
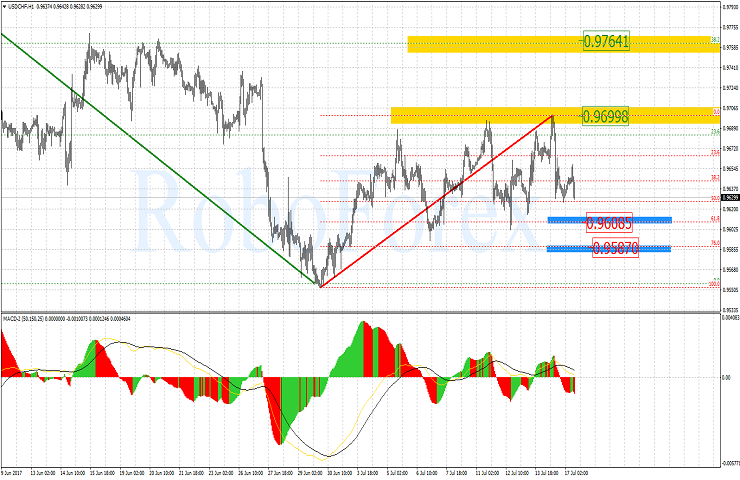
The H1-chart suggests a possible local downside move towards 61.8% and 76.0% Fibo levels. The local high at 0.9699 restrains the ascending correction move from moving higher.
Forecasts presented in this section only reflect the author’s private opinion and should not be considered as guidance for trading. RoboForex bears no responsibility for trading results based on trading recommendations described in these analytical reviews.