Fibonacci Retracements Analysis 18.12.2019 (GBPUSD, EURJPY)
GBPUSD, “Great Britain Pound vs US Dollar”
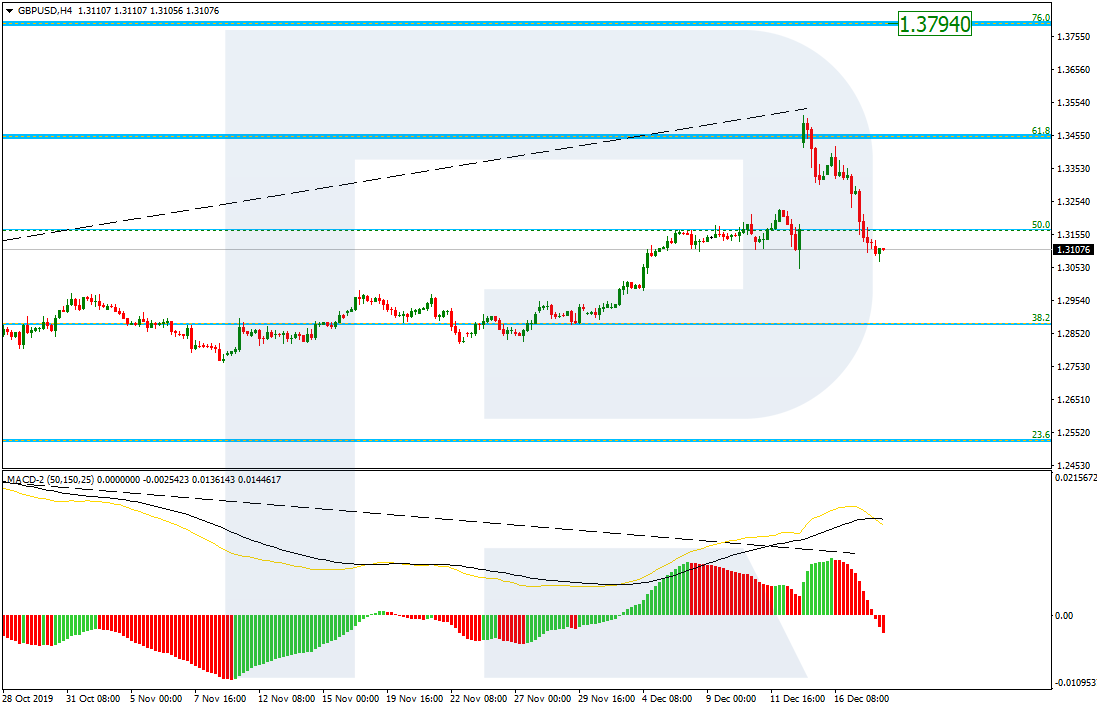
In the H4 chart, there was a gap on the price chart and a divergence on MACD, after which the pair reached 61.8% fibo. We can see that GBPUSD has already eliminated the gap and right now is correcting to the downside. After completing the pullback, the instrument may start another rising wave towards 76.0% fibo at 1.3794.

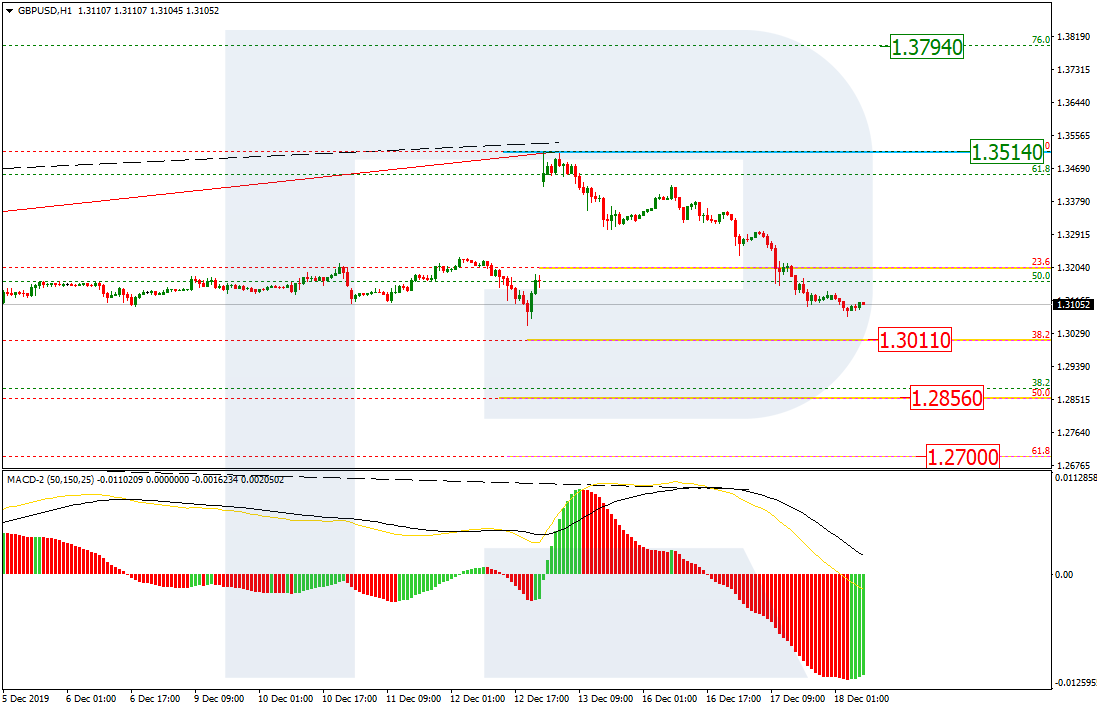
The H1 chart shows the more detailed structure of the current descending correction. At the moment, the pair is getting close to 38.2% fibo at 1.3011 and may later reach 50.0% and 61.8% fibo at 1.2856 and 1.2700 respectively. The resistance is the high at 1.3514.
EURJPY, “Euro vs. Japanese Yen”
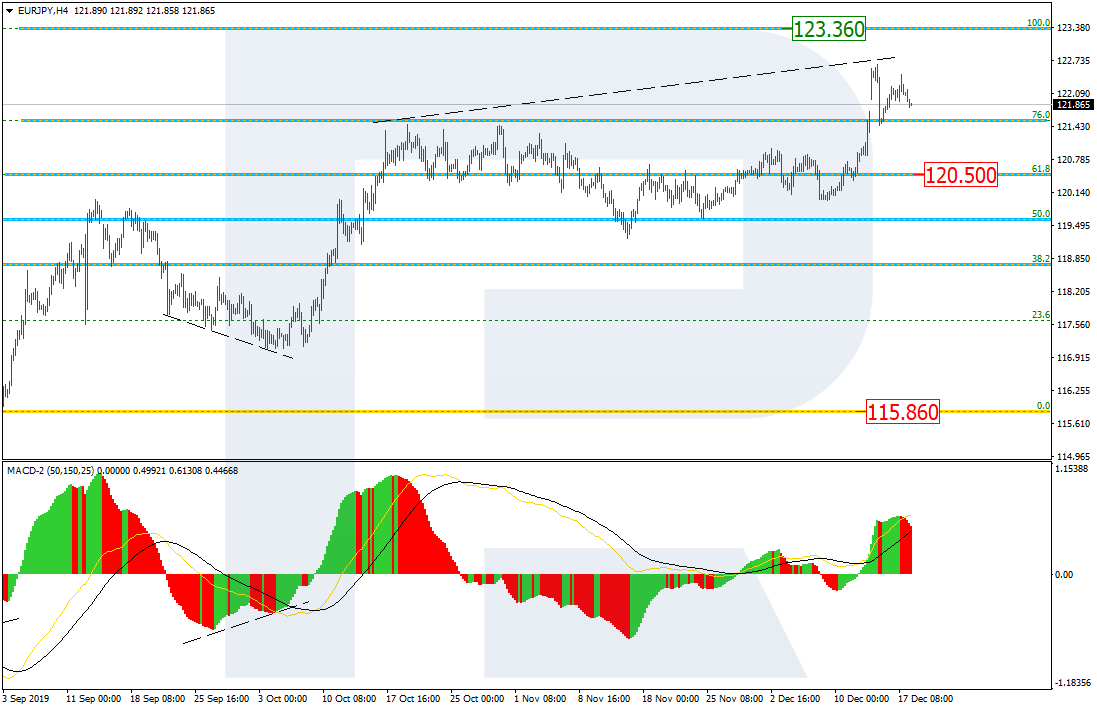
In the H4 chart, EURJPY continues the uptrend to break 76.0% fibo and reach its mid-term high at 123.36. At the same time, there is a divergence on MACD, which may indicate a possible pullback. The support is at 61.8% fibo (120.50).
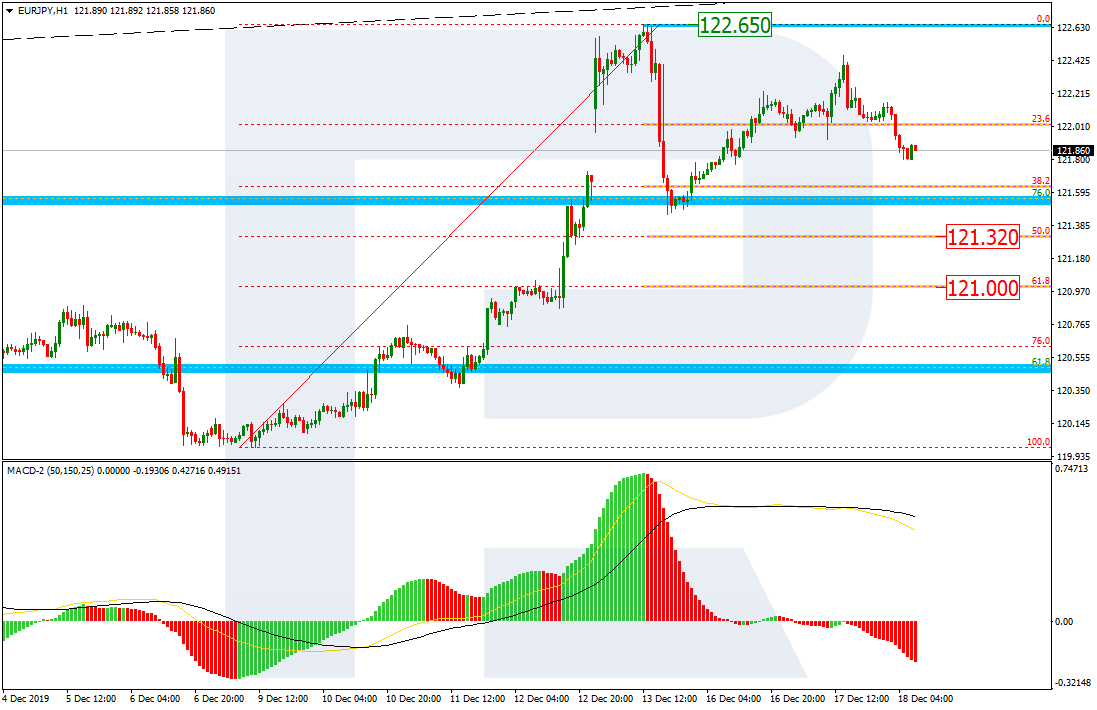
As we can see in the H1 chart, the first descending wave has reached 38.2% fibo. The next wave to the downside may be heading towards 50.0% and 61.8% fibo at 121.32 and 121.00 respectively. The local resistance is the high at 122.65.
Forecasts presented in this section only reflect the author’s private opinion and should not be considered as guidance for trading. RoboForex bears no responsibility for trading results based on trading recommendations described in these analytical reviews.