Fibonacci Retracements Analysis 20.07.2020 (GOLD, USDCHF)
XAUUSD, “Gold vs US Dollar”
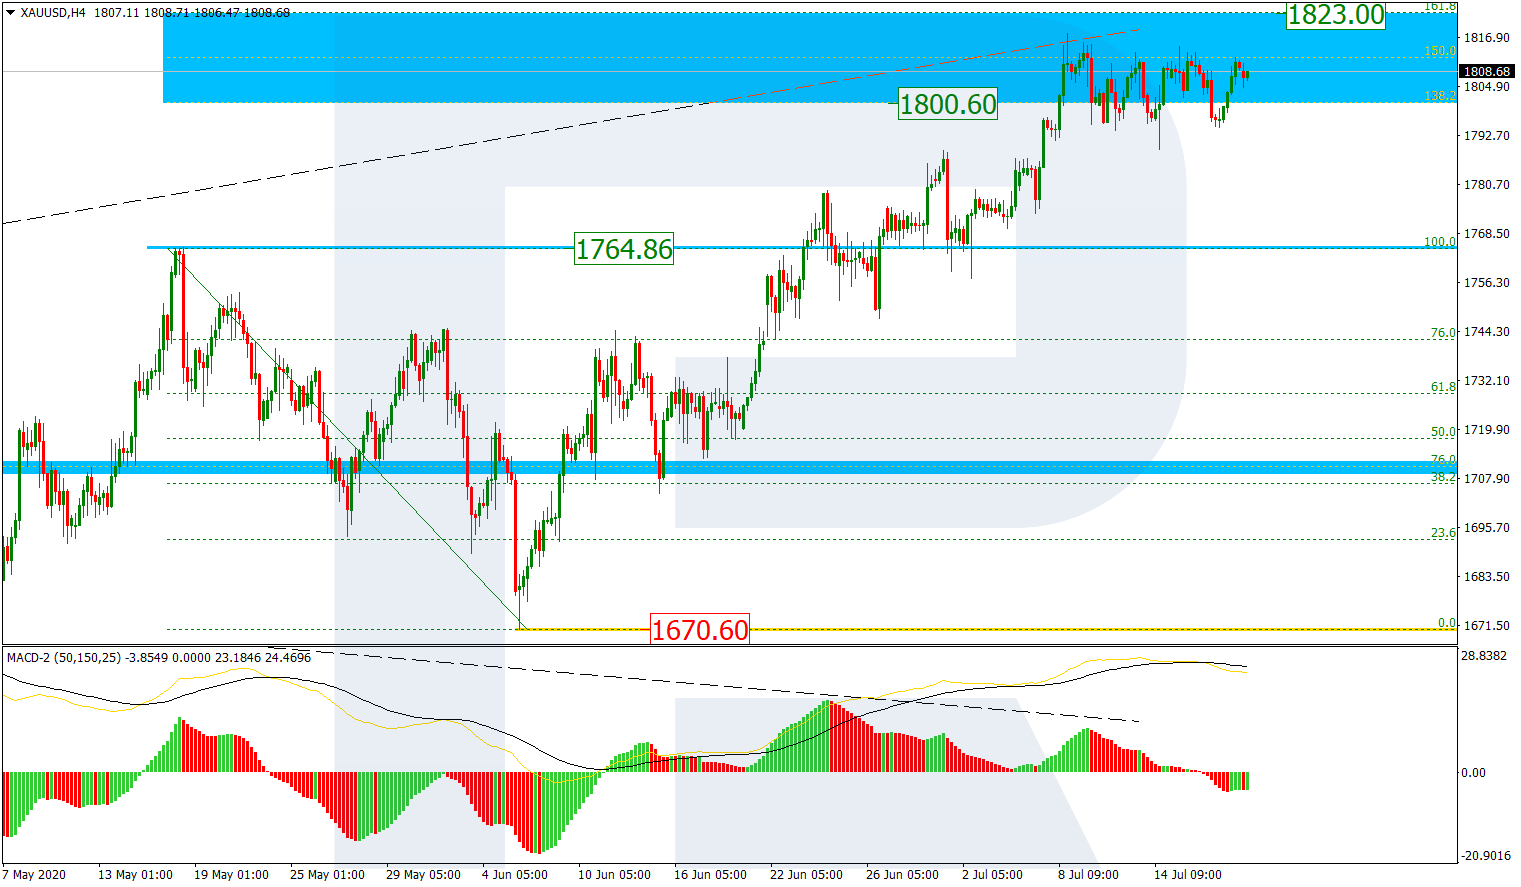
As we can see in the H4 chart, XAUUSD is forming a slight local correction inside the post-correctional extension area between 138.2% and 161.8% fibo at 1800.60 and 1823.00 respectively. After breaking this area to the upside, the instrument may try to attack its all-time high at 1920.66. The key support is at 1670.60.

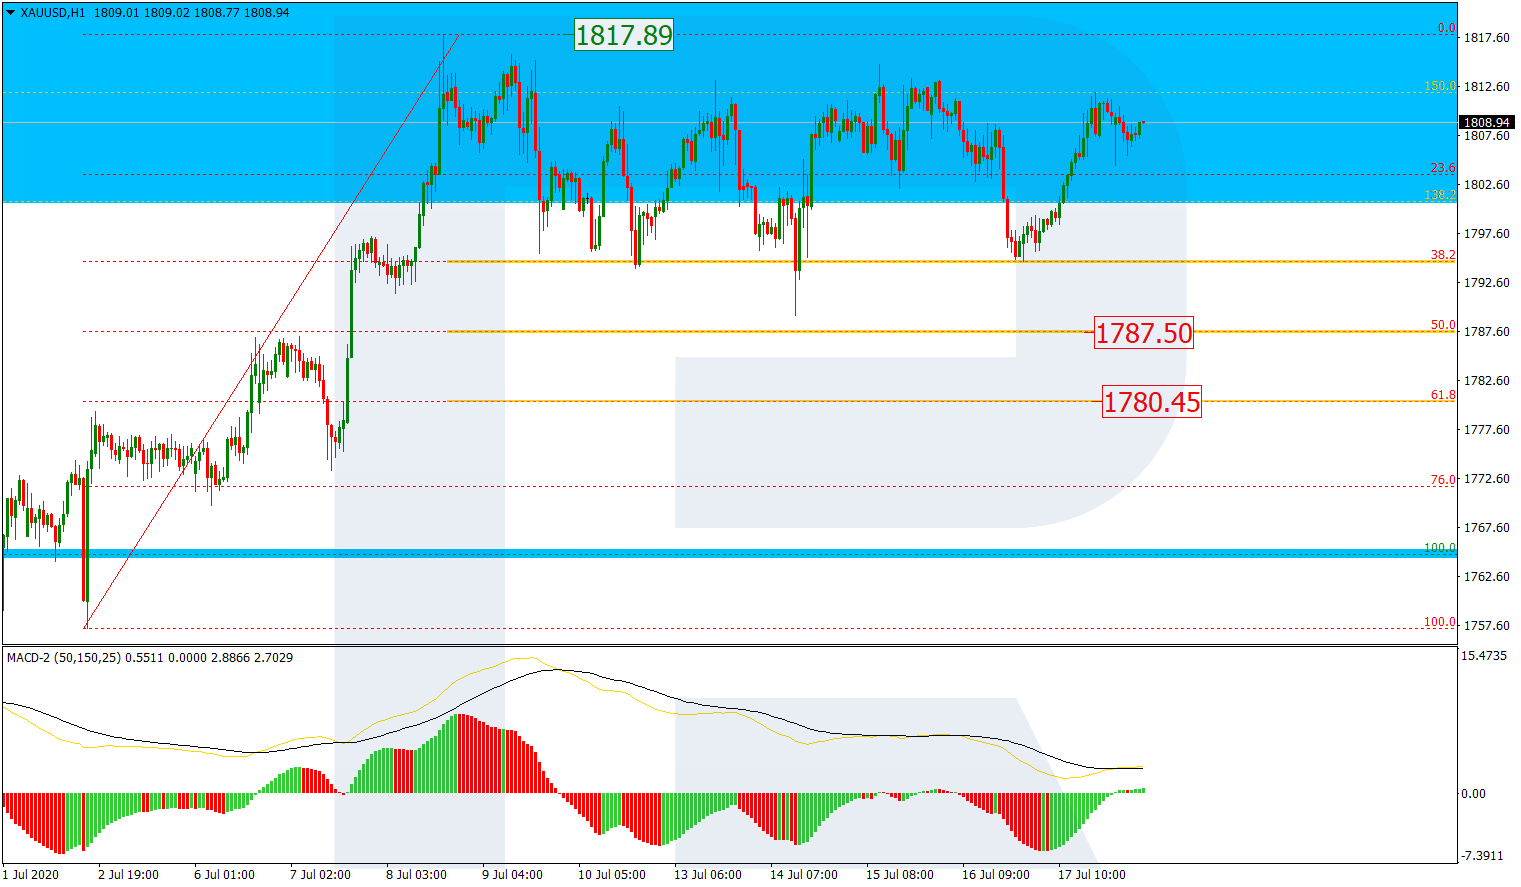
In the H1 chart, the descending correction has reached 38.2% fibo. At the moment, the pair is moving towards the high at 1817.89 and may continue the uptrend after breaking it. At the same time, the instrument may yet start a new decline to reach 50.0% and 61.8% fibo at 1787.50 and 1780.45 respectively.
USDCHF, “US Dollar vs Swiss Franc”
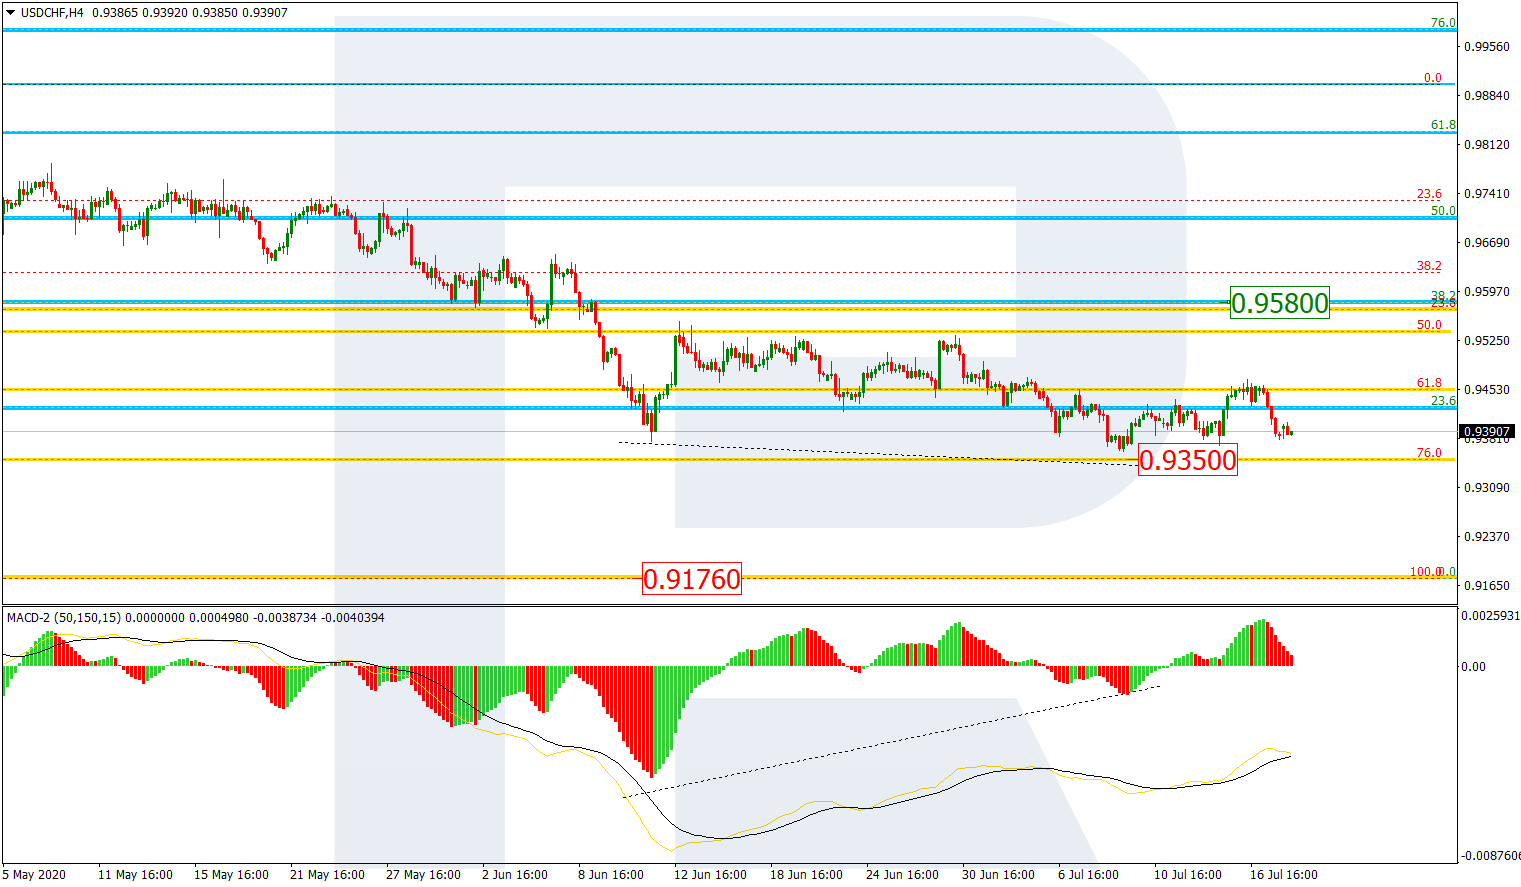
As we can see in the H4 chart, after breaking its previous low and finishing a short-term pullback, USDCHF continues falling towards the mid-term 76.0% at 0.9350. The key downside target remains the low at 0.9176. The resistance is at 0.9580.
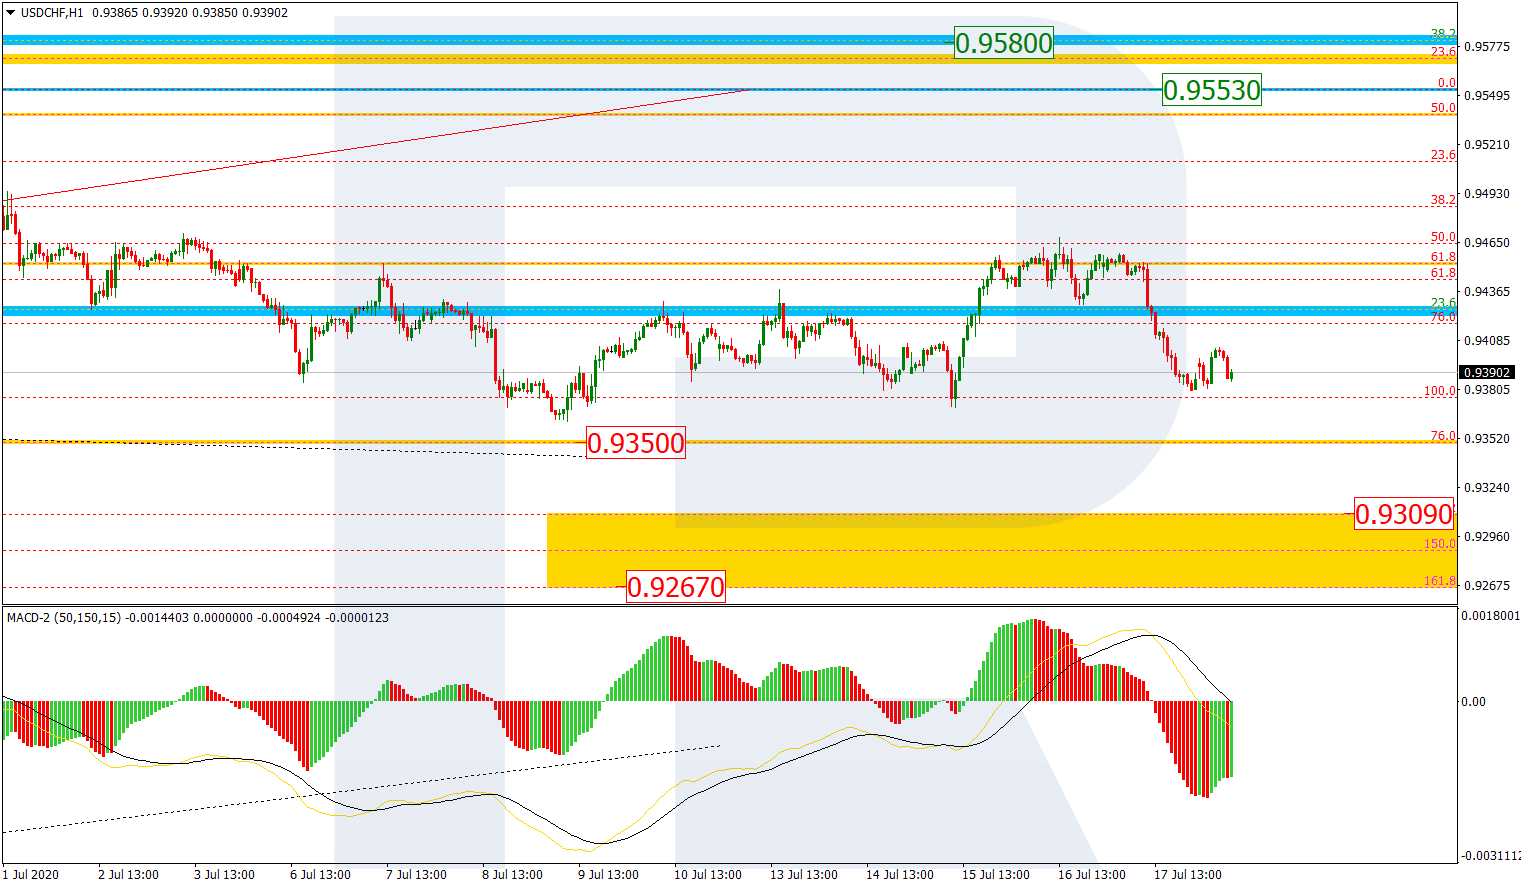
In the H1 chart, after testing the low, the pair has correcting towards 61.8% fibo. At the moment, the price is forming a new descending impulse. The key short-term downside targets are inside the local post-correctional extension area between 138.2% and 161.8% fibo at 0.9309 and 0.9267 respectively.
Forecasts presented in this section only reflect the author’s private opinion and should not be considered as guidance for trading. RoboForex bears no responsibility for trading results based on trading recommendations described in these analytical reviews.