Fibonacci Retracement Analysis 25.07.2017 (GBP/USD, EUR/JPY)
GBP/USD
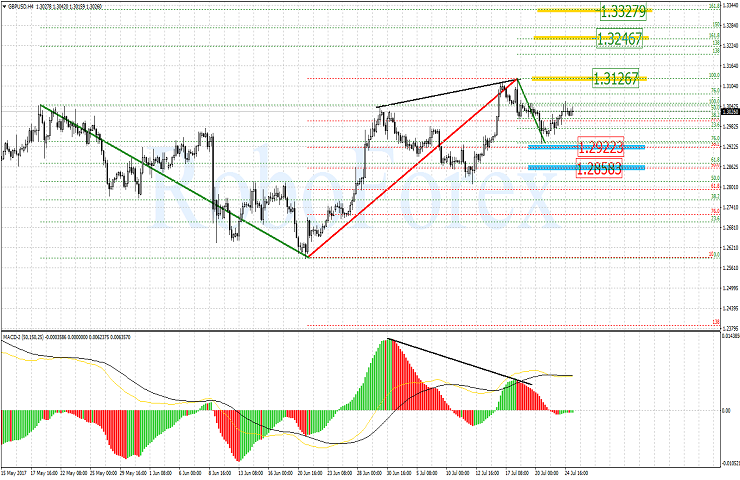
The GBP/USD H4-chart points to possible continuation of the uptrend. After a divergence had been formed, the pair corrected by 38.2%. The 50.0% Fibo level (1.2858 mark) can be the next possible target for this correction move. But if the local high 1.3126 is hit and crossed over, the pair can move higher towards the post-correction 161.8% Fibo level (1.3246).
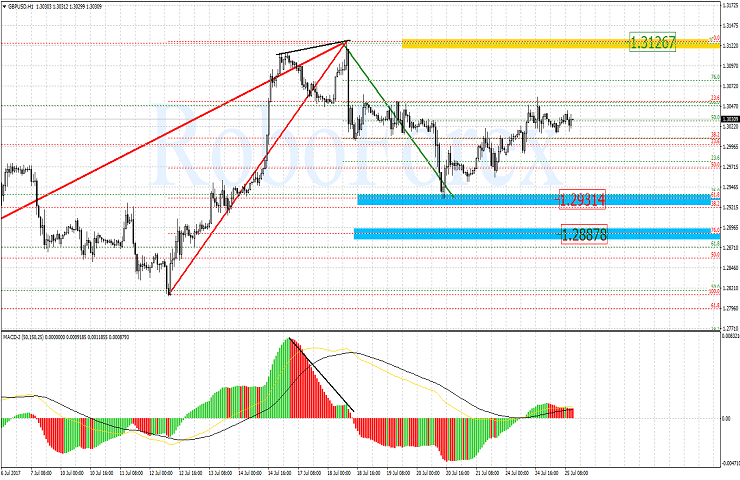
The GBP/USD H1-chart shows that a correction move of the last ascending impulse is being completed. The correction turned out to be 61.8%. The current microimpulse has the local low 1.3126 as its target.
EUR/JPY
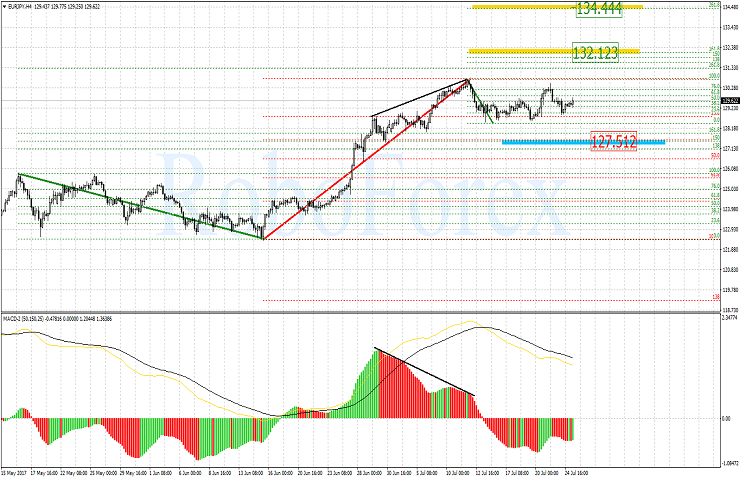
Looking at EUR/JPY H4-chart we see that the correction has reached 23.6% Fibo level. The 38.2% level (127.51 mark) can be the next target for the current correction move. When the local high is hit, the pair can move higher towards 132.12 which corresponds to 161.8% elongation level of the current correction range.
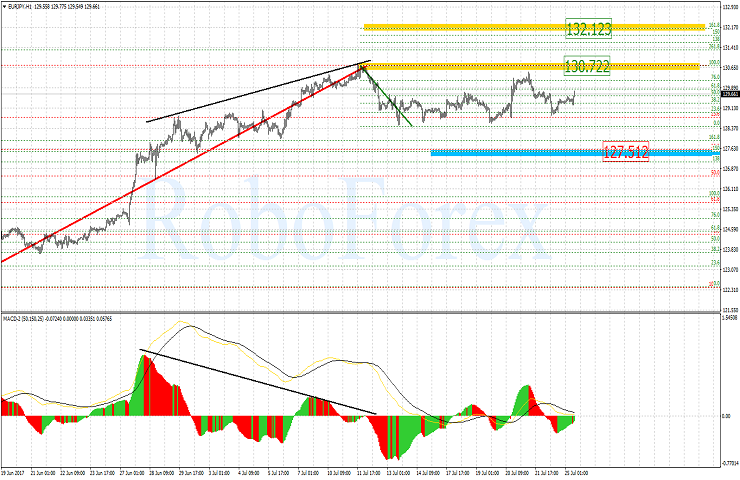
The EUR/JPY H1-chart confirms the summary of the senior timeframe. The local high (130.72) can serve as the nearest high for the current rise. If this mark is hit, the pair can climb higher towards a significant post-correction level 132.12.
Forecasts presented in this section only reflect the author’s private opinion and should not be considered as guidance for trading. RoboForex bears no responsibility for trading results based on trading recommendations described in these analytical reviews.