Fibonacci Retracement Analysis 26.07.2017 (AUD/USD, USD/CAD)
AUD/USD
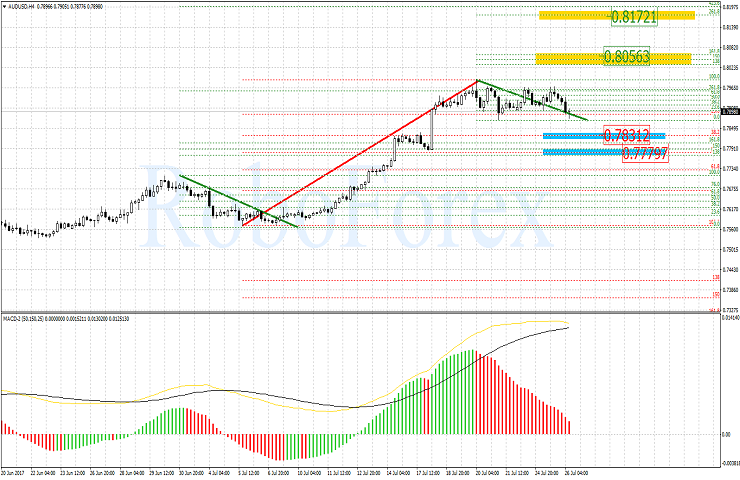
On the H4-chart of AUD/USD pair the uptrend continues. In the short term, a downward tendency can be expected which can bring the pair to 38.2% Fibo level. This level corresponds to 0,7831 mark. Then the price can climb higher to reach 50.0% Fibo level (0.7737). After the correction occurs, the main tendency can continue and form a new impulse. This one will have a target (0.8172 level) as a post-correction 261.8% Fibo elongation. But the 161.8% Fibo level can be the nearest target for this upward move (0.8056 mark).
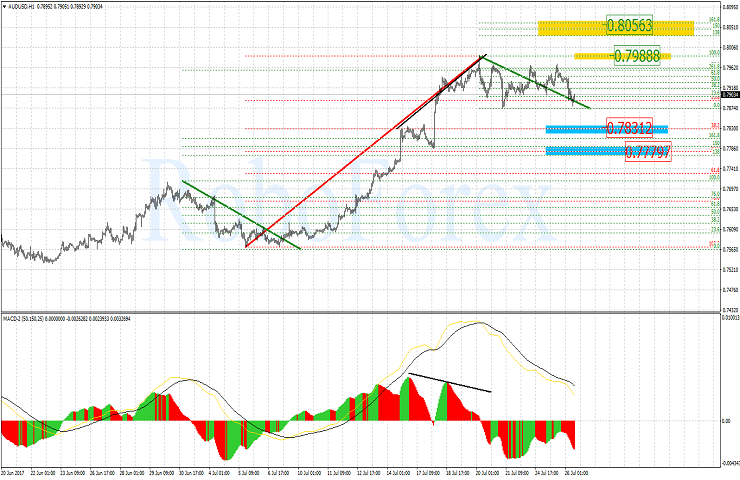
The H1-chart of AUD/USD pair confirms the picture of the senior time frame. Therefore, after having achieved the 23.6% Fibo level, the current descending move can be elongated towards 0.7831 level - 38.2% Fibo mark. However, if a new high is hit, the 0.8056 mark can become a new significant local target.
USD/CAD
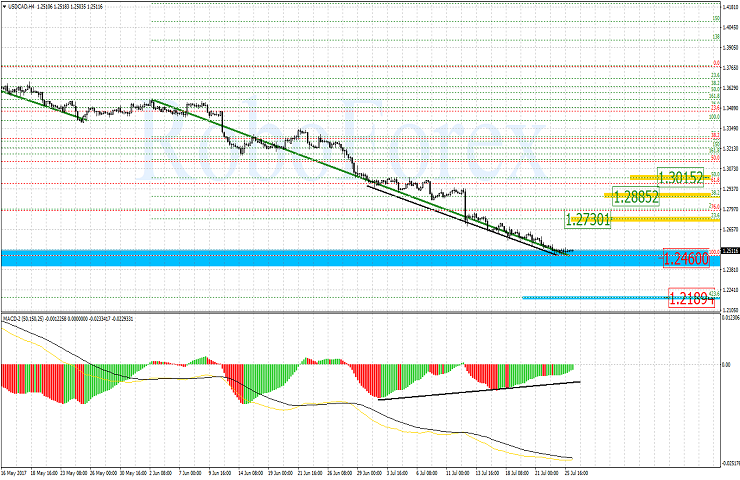
On the H4-chart of USD/CAD pair a convergence is being formed, and this suggests a possible growth as a correction. In addition, the price is moving closer to significant long-term level 1.2460. All the above factors suggest a possible reversal or a correction move. The levels 1,2730 (23,6%), 1,2885 (38,2%) and 1,3015 (50,0%) can serve as possible targets for this correction move.
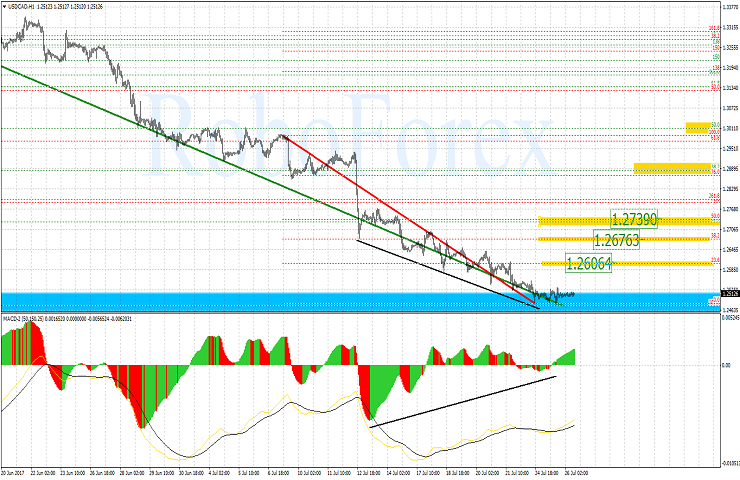
The H1-chart of USD/CAD pair confirms the dynamics of the senior time frames. In the short term, the convergence points to a possible correction to move higher to reach 1.2606, 1.2676 and 1.2739 which correspond to 23,6%, 38,2% and 50,0% Fibo levels.
Forecasts presented in this section only reflect the author’s private opinion and should not be considered as guidance for trading. RoboForex bears no responsibility for trading results based on trading recommendations described in these analytical reviews.