Fibonacci Retracements Analysis 26.09.2017 (AUD/USD, USD/CAD)
AUD USD, “Australian Dollar vs US Dollar”
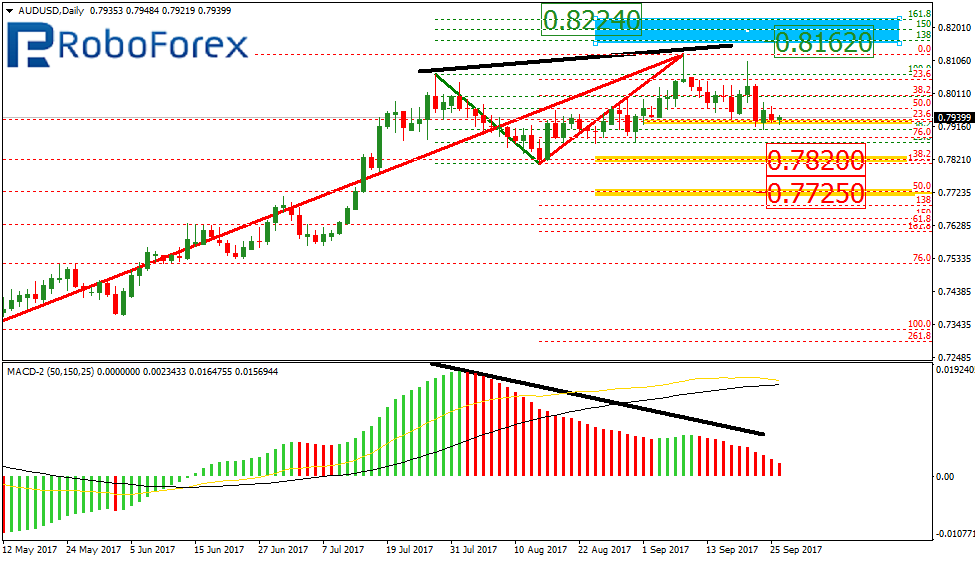
At the daily chart, after forming the divergence, the AUD/USD pair is trying to reverse to the downside. Despite reaching the retracement of 23.6%, the price may yet continue moving upwards. The possible upside targets may be inside two the post-correctional extension areas between the retracements of 138.2% and 161.8% at 0.8162 and 0.8224 respectively. However, right now the instrument may continue the descending correction towards the retracements of 38.2% and 50.0% at 0.7820 and 0.7725 respectively.
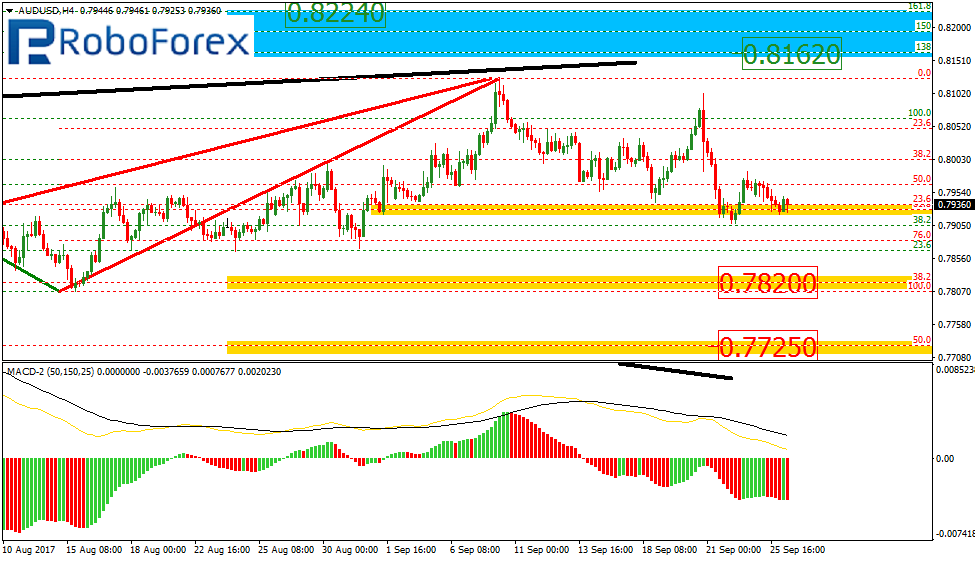
At the H4 chart, the situation is bearish. The downside targets are close to the retracements of 38.2% and 50.0% from the daily chart at 0.7820 and 0.7725 respectively.
USD CAD, “US Dollar vs Canadian Dollar”
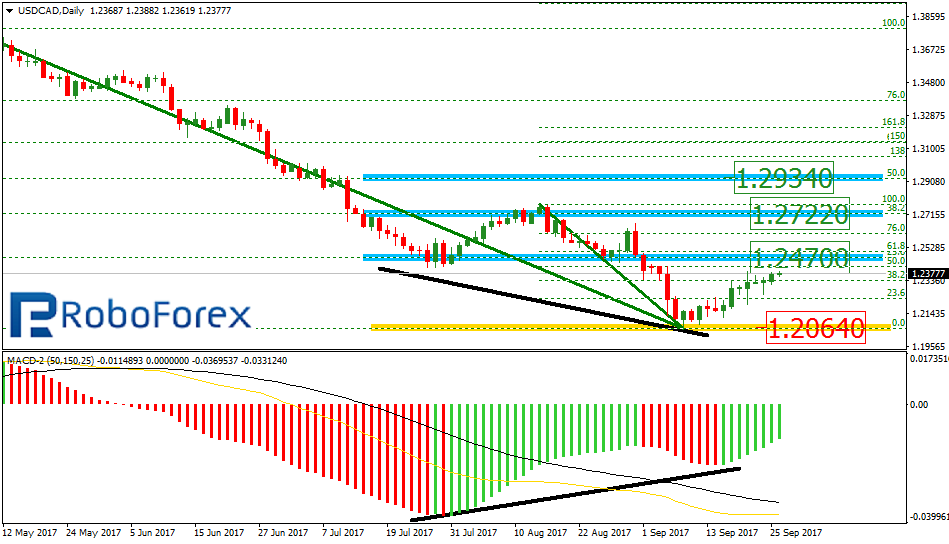
As we can see at the daily chart, the USD/CAD pair has finished the divergence and started a new ascending correction, which may even be considered as reverse. The local support is the low at 1.2064. The targets of this ascending movement may be the retracements of 23.6%, 38.2%, and 50.0% at 1.2470, 1.2722, and 1.2934 respectively.
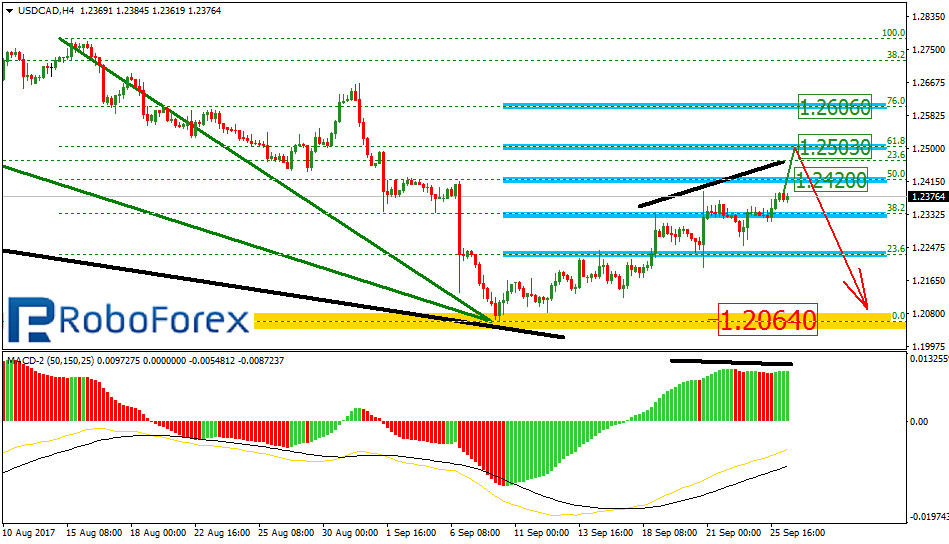
At the H4 chart, after completing the descending impulse, the pair is being corrected to the upside. At the moment, the price is moving towards the retracement of 50.0% at 1.2420 and the next target may be the one of 61.8% at 1.2503. However, if we take a look at the divergence that is being formed right now, we may assume that the price may start forming a new descending impulse after reaching its targets.
RoboForex Analytical Department
Forecasts presented in this section only reflect the author’s private opinion and should not be considered as guidance for trading. RoboForex bears no responsibility for trading results based on trading recommendations described in these analytical reviews.