Fibonacci Retracements Analysis 27.09.2017 (GOLD, USD/CHF)
XAU USD, “Gold vs US Dollar”
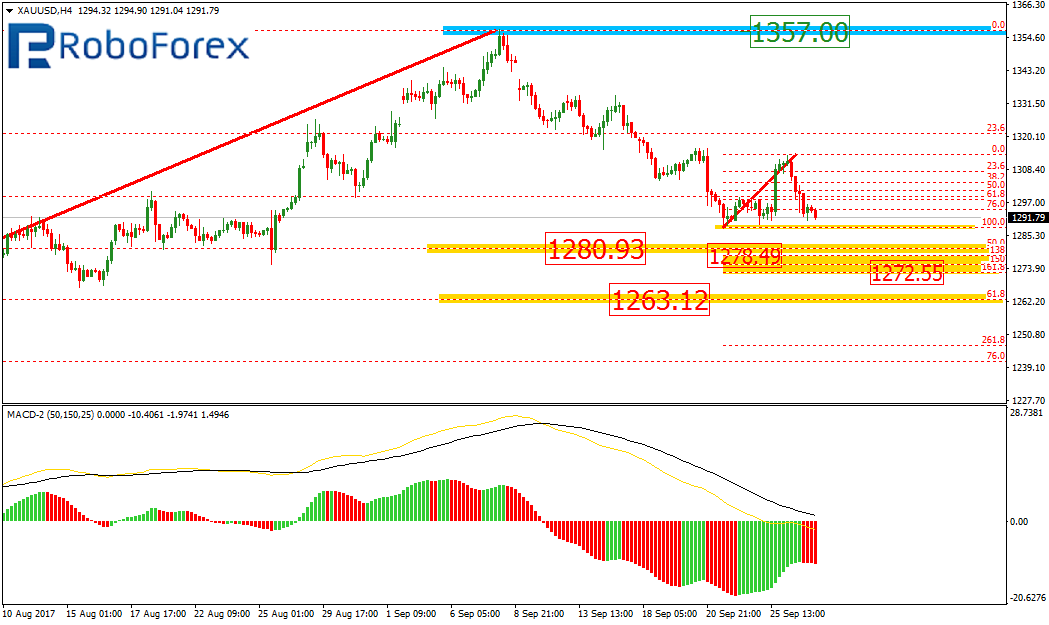
At the H4 chart of the XAU/USD pair, the price is still moving to the downside. The closest target of this descending movement is the retracements of 50.0% and 61.8% at 1280.93 and 1263.12 respectively. The resistance for the current decline is still close to the local high at 1357.00.
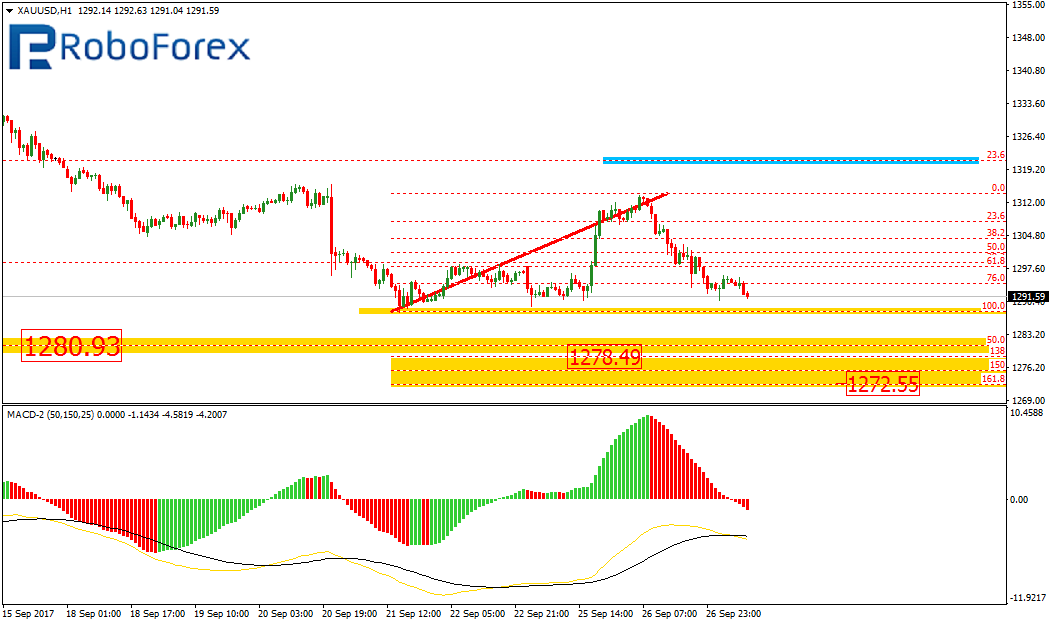
As we can see at the H1 chart, the pair has completed the short-term ascending correction and started forming a new descending impulse. After breaking the local low, the price may reach the post-correctional extension area between the retracements of 138.2% and 161.8% at 1278.49 and 1272.55 respectively.
USD CHF, “US Dollar vs Swiss Franc”
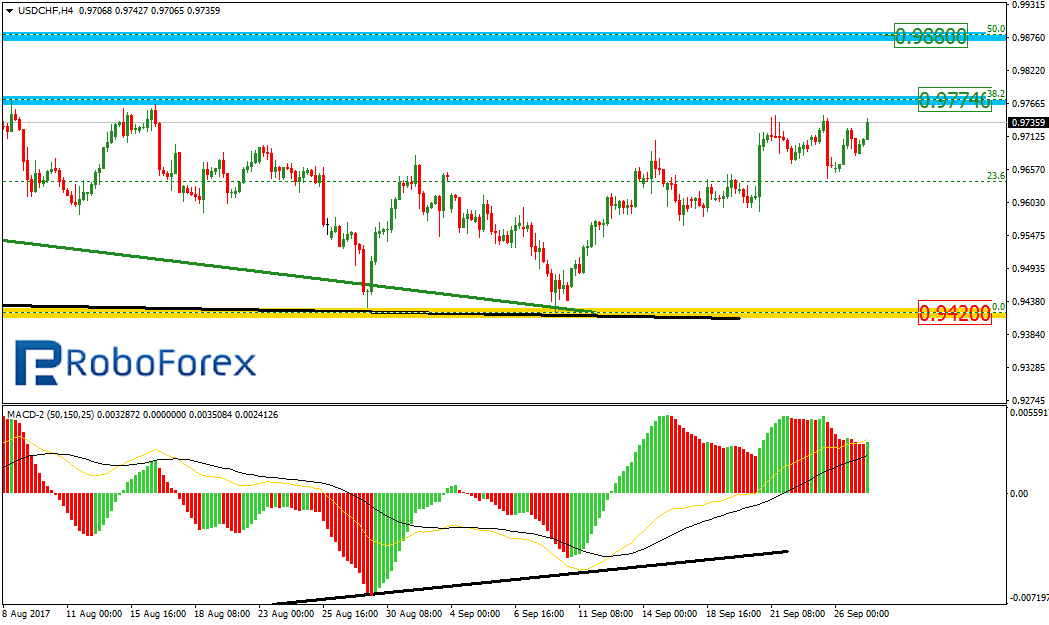
At the H4 chart, the current uptrend may continue. The closest targets of this movement may be the retracements of 38.2% and 50.0% at 0.9774 and 0.9880 respectively. The support level is at 0.9420.
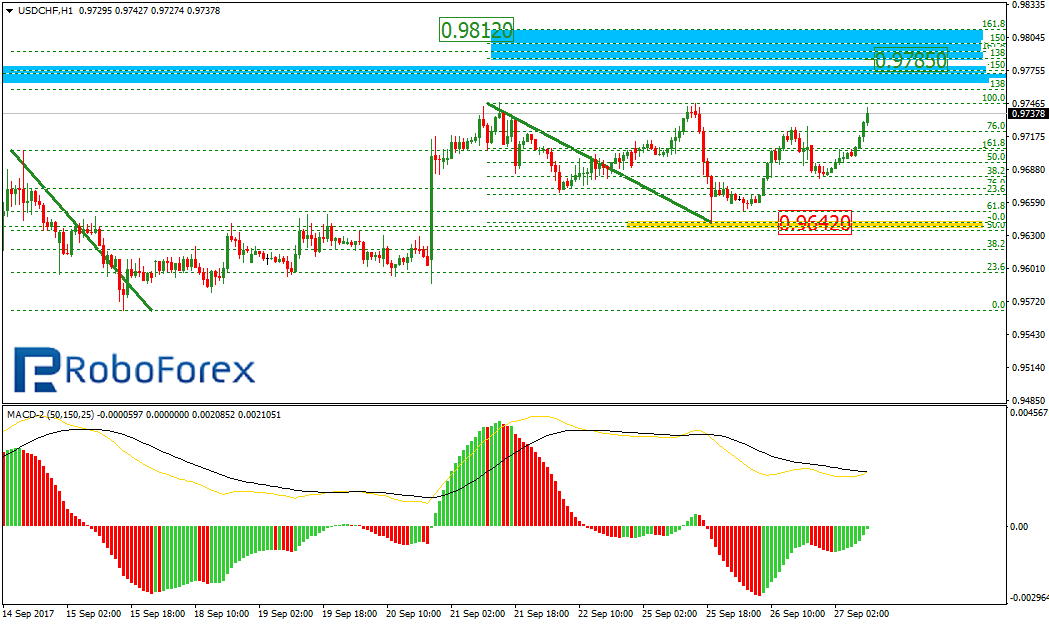
As we can see at the H1 chart, the pair is trading inside the uptrend with small correctional “micro trends” inside it, which may force the price form new significant ascending impulses. After breaking the local high, the price may reach the post-correctional extension area between the retracements of 138.2% and 161.8% at 0.9785 and 0.9812 respectively.
RoboForex Analytical Department
Forecasts presented in this section only reflect the author’s private opinion and should not be considered as guidance for trading. RoboForex bears no responsibility for trading results based on trading recommendations described in these analytical reviews.