Fibonacci Retracement Analysis 28.07.2017 (EUR/USD, USD/JPY)
EUR/USD
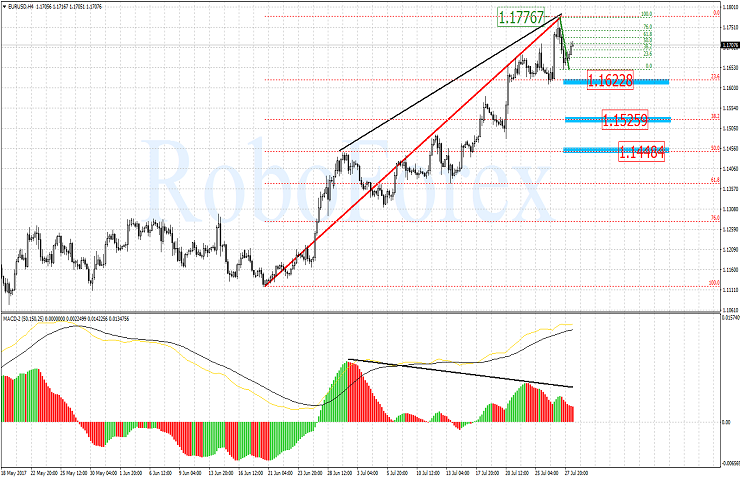
On the H4-chart of EUR/USD we see a divergence being formed, but the current uptrend can be extended also. The descending correction which has started is moving towards the first Fibo level - 23.6% (1.1622 mark). The 38.2% and 50% Fibo levels (1.1525 and 1.1448 mark correspondingly) can be the next targets for this downward move.
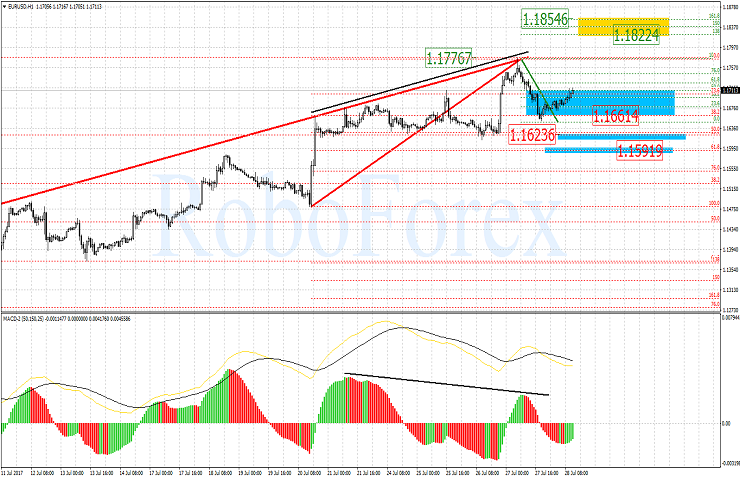
The H1-chart confirms the analysis. A correction that happens after the divergence can in near term But if the current high (1.1776) is hit and broken, price can move higher towards the area of post-correction elongation 138.2 - 161.8% (a range of 1.1822 - 1.1854).
USD/JPY
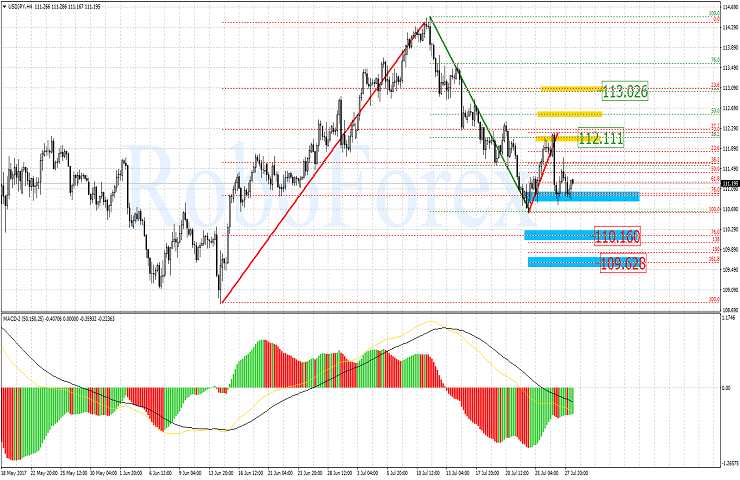
The H4-chart of USD/JPY shows that after the descending correction of more than 61.8% of the previous impulse yet another impulse had been formed, and this new impulse got 38.2% of the downtrend. If price moves higher than the local high 112.11, this will suggest development of a new uptrend, and the 113.02 mark can be the nearest target for it (61.8% Fibo level). It is not improbable that a further downward move occurs. Therefore, the 110.16 mark can serve as the next target for the downward movement. This target corresponds to 76.0% Fibo level for the previous ascending impulse. Then an elongation towards 161.8% Fibo level is possible also which is measured from the last ascending microimpulse.
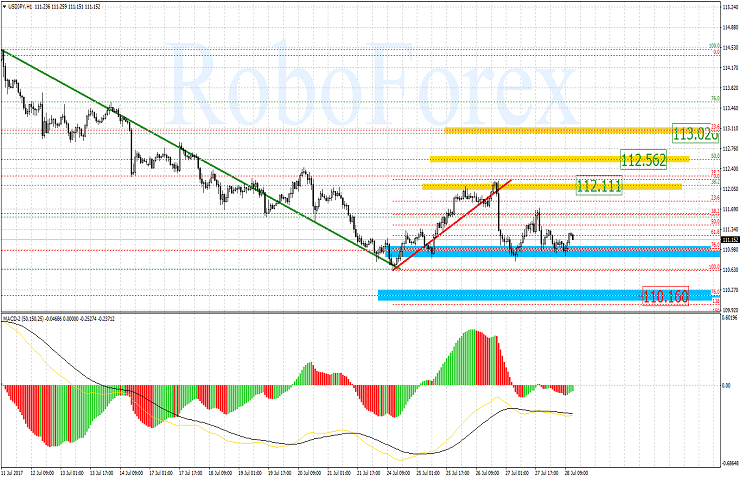
The H1-chart of USD/JPY confirms the senior timeframe's analysis.
Forecasts presented in this section only reflect the author’s private opinion and should not be considered as guidance for trading. RoboForex bears no responsibility for trading results based on trading recommendations described in these analytical reviews.