Fibonacci Retracements Analysis 28.09.2017 (EUR/USD, USD/JPY)
EUR USD, “Euro vs US Dollar”
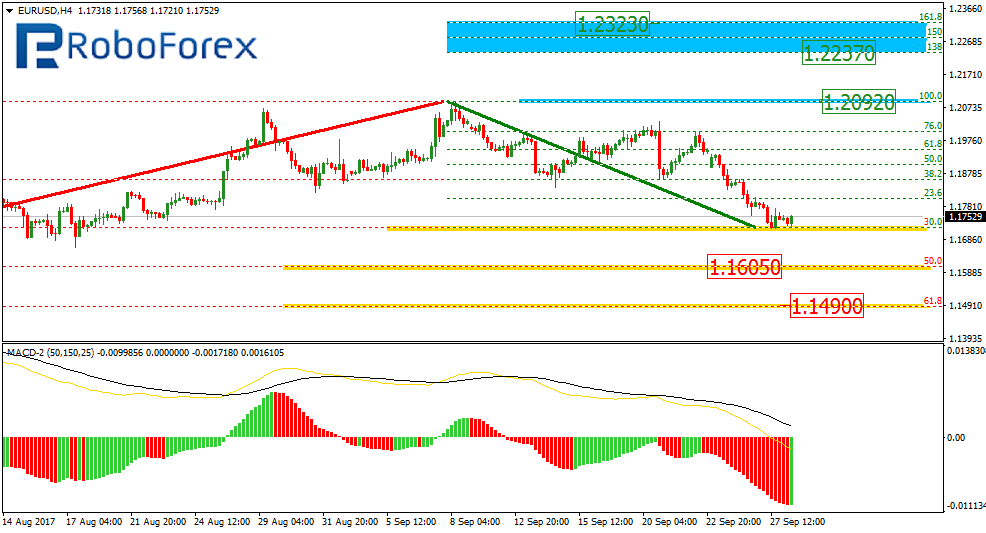
As we can see at the H4 chart, the EUR/USD pair has been corrected by 38.2%. The next targets of this correction may be the retracements of 50.0% and 61.8% at 1.1605 and 1.1490 respectively. However, one shouldn’t exclude the scenario, according to which the current descending correction has already finished. If the price forms a new ascending impulse and breaks the high at 1.2092, the instrument may reach the post-correctional extension area between the retracements of 138.2% and 161.8% at 1.2237 and 1.2323 respectively.
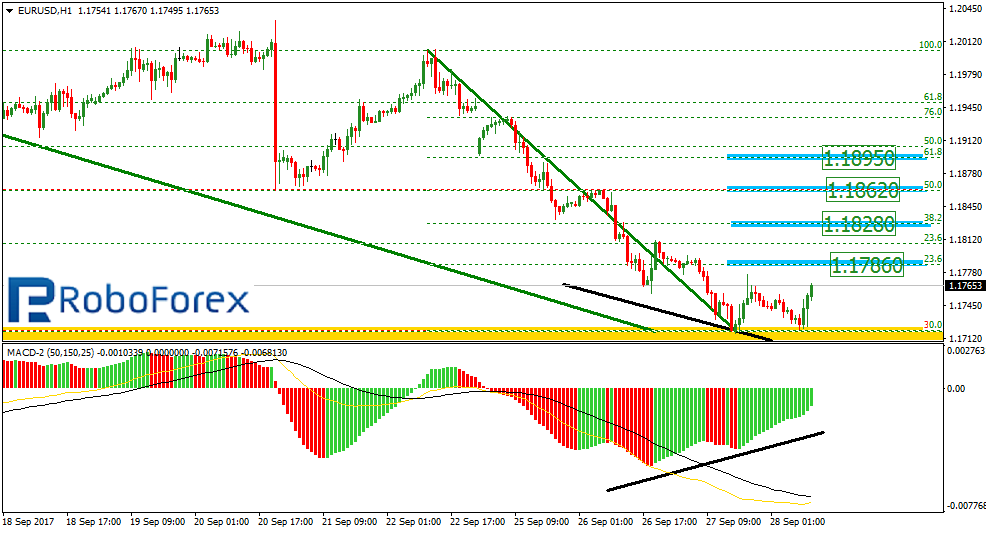
At the H1 chart, the pair finished the downtrend by forming the divergence, which may indicate a possible correction to the upside. The targets of this correction may be the retracements of 23.6%, 38.2%, 50.0%, and 61.8% at 1.1786, 1.1828, 1.1862, and 1.1895 respectively.
USD JPY, “US Dollar vs. Japanese Yen”
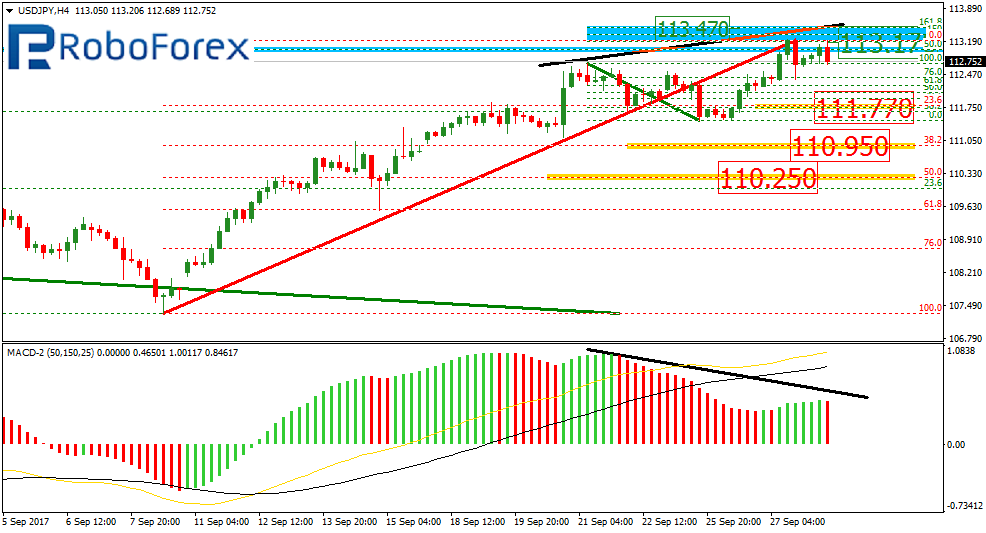
At the H4 chart, the USD/JPY pair is forming the divergence, which may indicate a possible reverse. This scenario is confirmed by the correction that reached the retracement of 50.0%. The closest downside targets may be the retracements of 23.6%, 38.2%, and 50.0% at 111.77, 110.95, and 110.25 respectively.
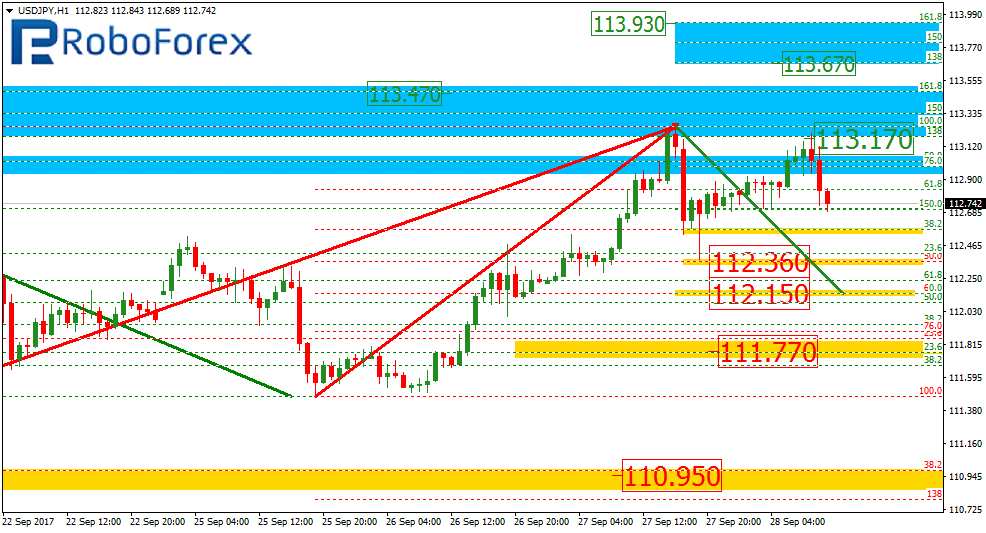
As we can see at the H1 chart, the pair is being corrected to the downside and has already reached the retracement of 50.0% at 112.36. The next target is the retracement of 61.8^ at 112.15. after completing the correction, the instrument may start a new ascending impulse and reach the post-correctional extension area between the retracements of 138.2% and 161.8% at 113.67 and 113.93 respectively.
RoboForex Analytical Department
Forecasts presented in this section only reflect the author’s private opinion and should not be considered as guidance for trading. RoboForex bears no responsibility for trading results based on trading recommendations described in these analytical reviews.