Fibonacci Retracements Analysis 29.09.2017 (GBP/USD, EUR/JPY)
GBP USD, “Great Britain Pound vs US Dollar”
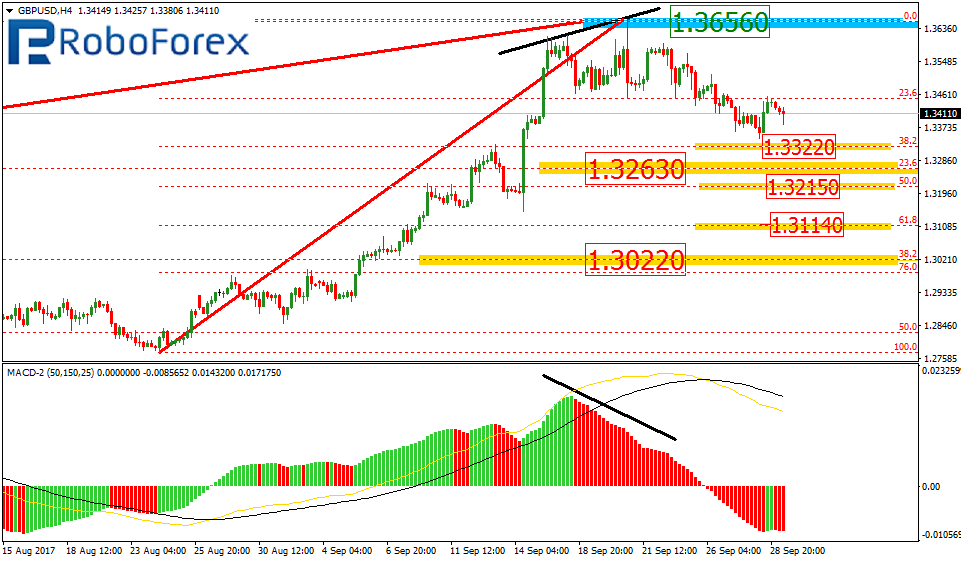
At the H4 chart, the downtrend continues. The mid-term targets of this downtrend may be the retracements of 23.6% and 38.2% at 1.3263 and 1.3112 respectively. The short-term ones are the retracements of 38.2%, 50.0%, and 61.8% at 1.3322, 1.3215, and 1.3114 respectively. The resistance level is close to the local high at 1.3656.
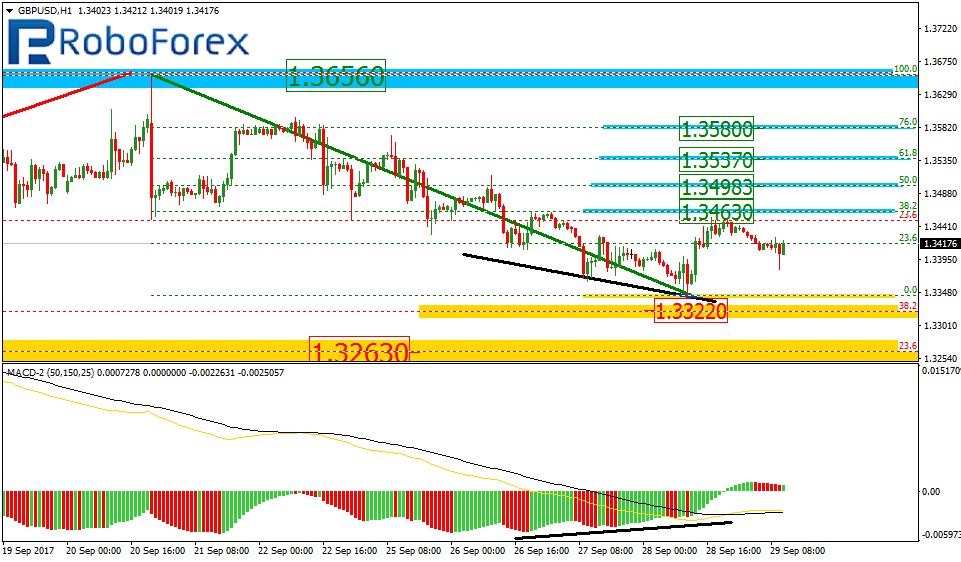
As we can see at the H1 chart, after finishing the convergence, the pair started a new correction and has already reached the retracement of 23.6%. The next upside targets of this correction may be the area between the retracements of 38.2% and 61.8%. However, the main tendency is still bearish.
EUR JPY, “Euro vs. Japanese Yen”
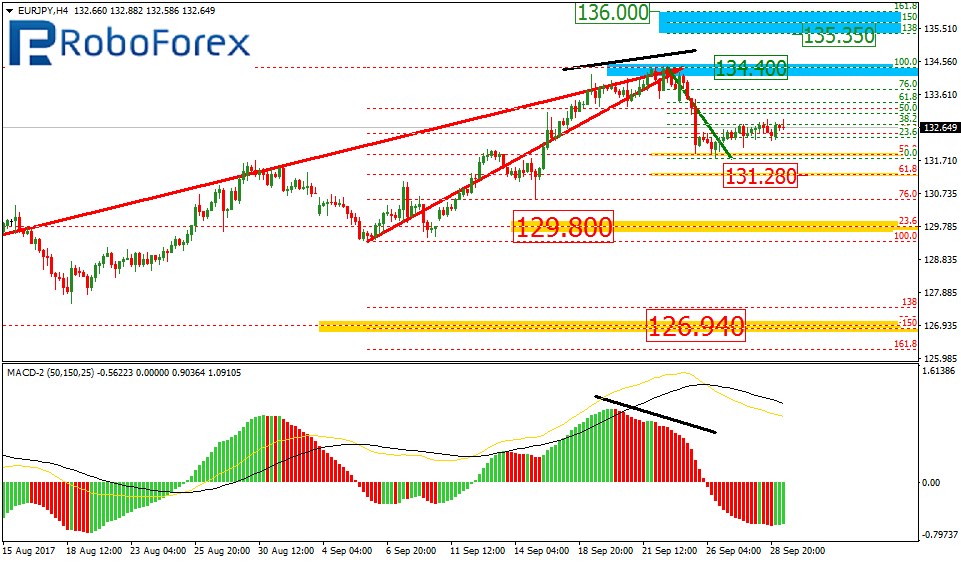
As we can see at the H4 chart, the EUR/JPY pair has already been corrected to the downside by 50.0%. The next targets of the correction may be the retracement of 61.8% at 131.28. After completing this correction and breaking the local high at 134.40, the price may reach the post-correctional extension area between the retracements of 138.2% and 161.8% at 135.35 and 136.00 respectively. If the instrument breaks the psychologically-crucial level at 130.00, the correction may continue with the closest targets at the retracements of 23.6% and 38.2% at 129.80 and 126.94 respectively.
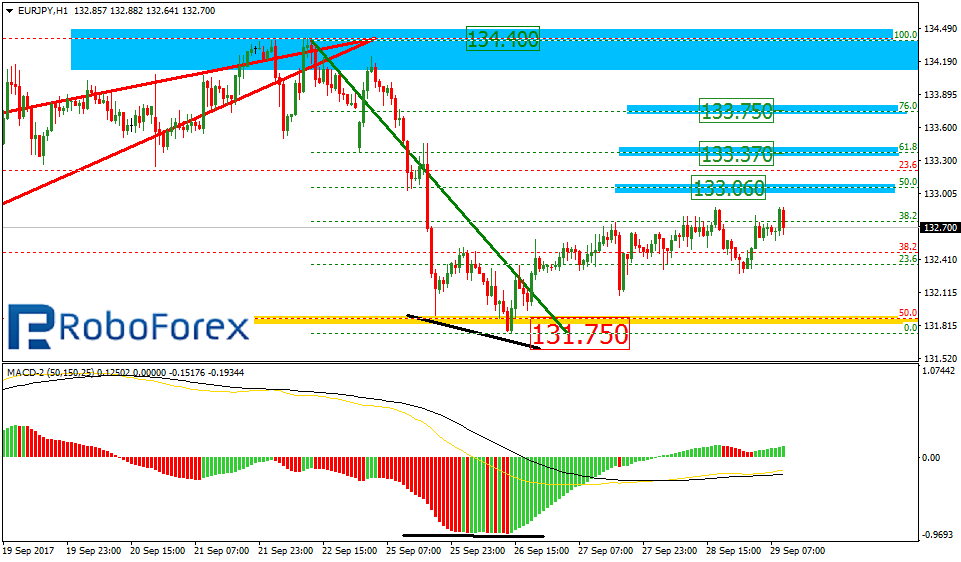
At the H1 chart, the pair is being corrected to the upside and has already reached the retracement of 38.2%. The next targets are inside the area between the retracements of 50.0% and 76.0% at 133.06 and 133.75 respectively.
RoboForex Analytical Department
Forecasts presented in this section only reflect the author’s private opinion and should not be considered as guidance for trading. RoboForex bears no responsibility for trading results based on trading recommendations described in these analytical reviews.