Fibonacci Retracements Analysis 29.11.2017 (GBP/USD, EUR/JPY)
GBP USD, “Great Britain Pound vs US Dollar”
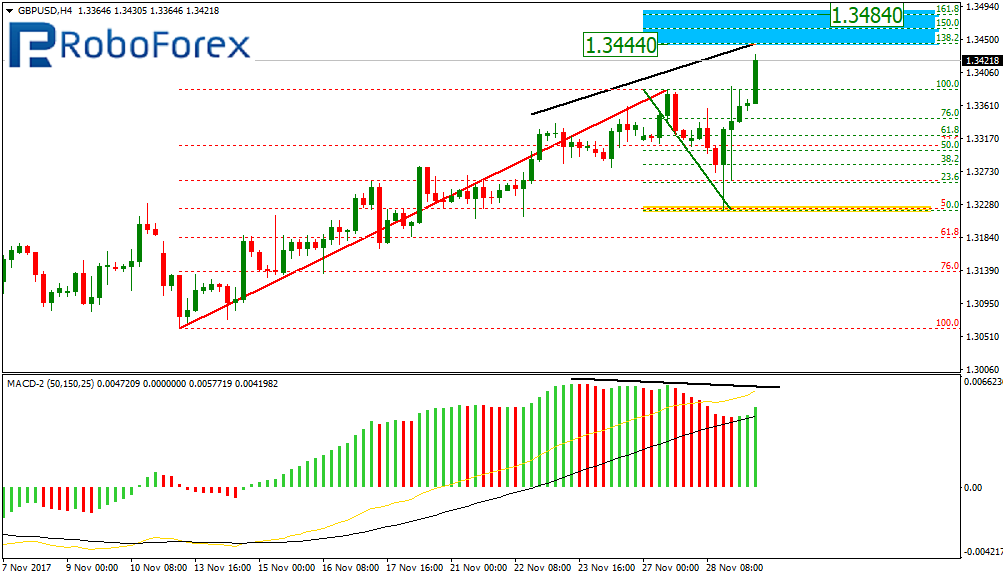
As we can see at the H4 chart, after being corrected to the downside by 50.0%, the GBP/USD pair has formed a new ascending impulse. The targets of this movement are inside the post-correctional extension area between the retracements of 138.2% and 161.8% at 1.3444 and 1.3484 respectively.
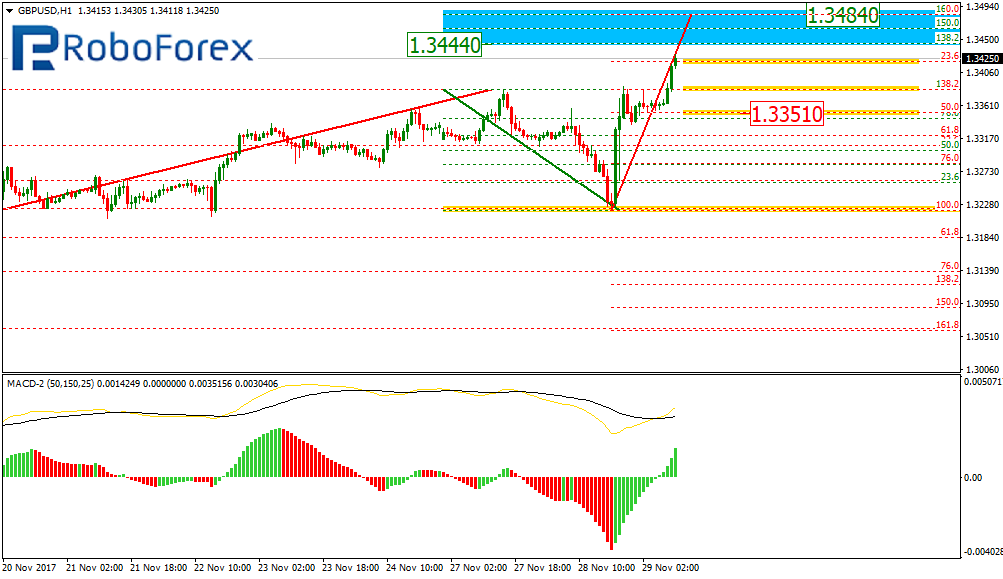
At the H1 chart, the situation is similar and confirms the scenario described above. We should note that after the divergence, the pair may reach its targets and then start a new correction. The main target of this correction may be near the retracement of 50.0% at 1.3351.
EUR JPY, “Euro vs. Japanese Yen”
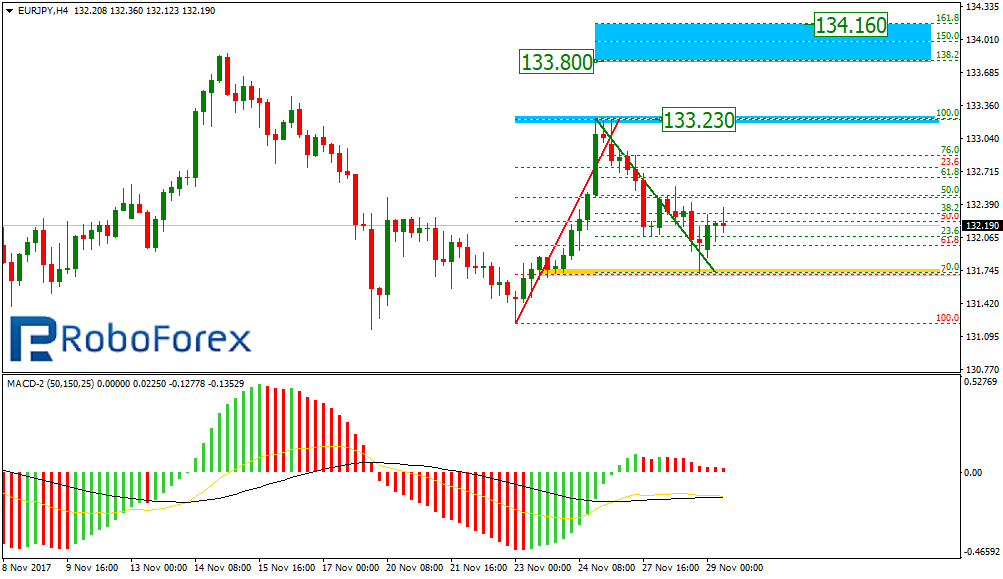
As we can see at the H4 chart, the EUR/JPY pair has been corrected to the downside by 76.0%. After the price starts forming a new ascending impulse and breaks the high at 133.23, the instrument may move towards the post-correctional extension area between the retracements of 138.2% and 161.8% at 133.80 and 134.16 respectively.
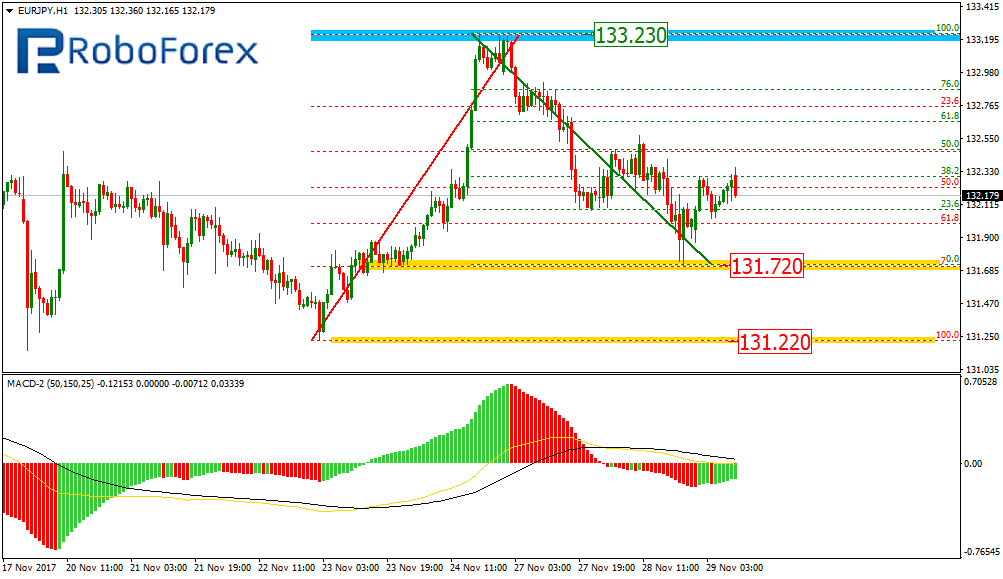
At the H1 chart, the situation is the same and confirms the scenario described above. However, we shouldn’t exclude a possibility that the pair may break the current low at 131.72 and fall towards 131.22.
RoboForex Analytical Department
Forecasts presented in this section only reflect the author’s private opinion and should not be considered as guidance for trading. RoboForex bears no responsibility for trading results based on trading recommendations described in these analytical reviews.