Fibonacci Retracements Analysis 19.08.2021 (Brent, Dow Jones)
Brent
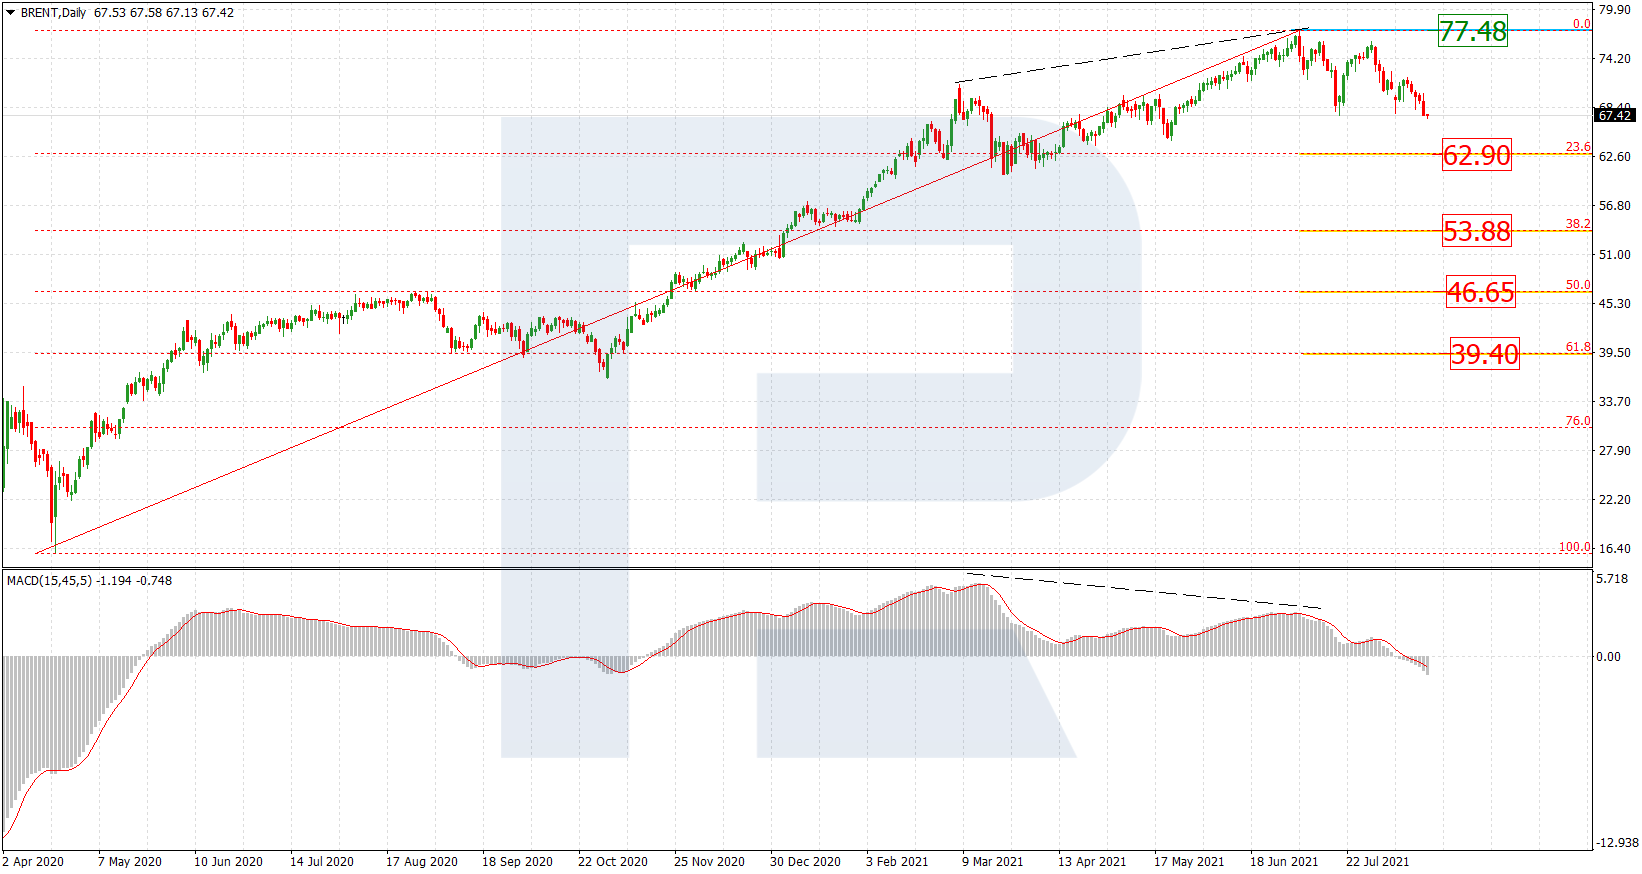
In the daily chart, there was divergence on MACD and several attempts to decline, after which the asset managed to update its local lows that acted as the support. Such dynamics may be a signal in favour of a further downtrend towards 23.6%, 38.2%, 50.0%, and 61.8% fibo at 62.90, 53.88, 46.65, and 39.40 respectively. The resistance is still close to the high at 77.48.

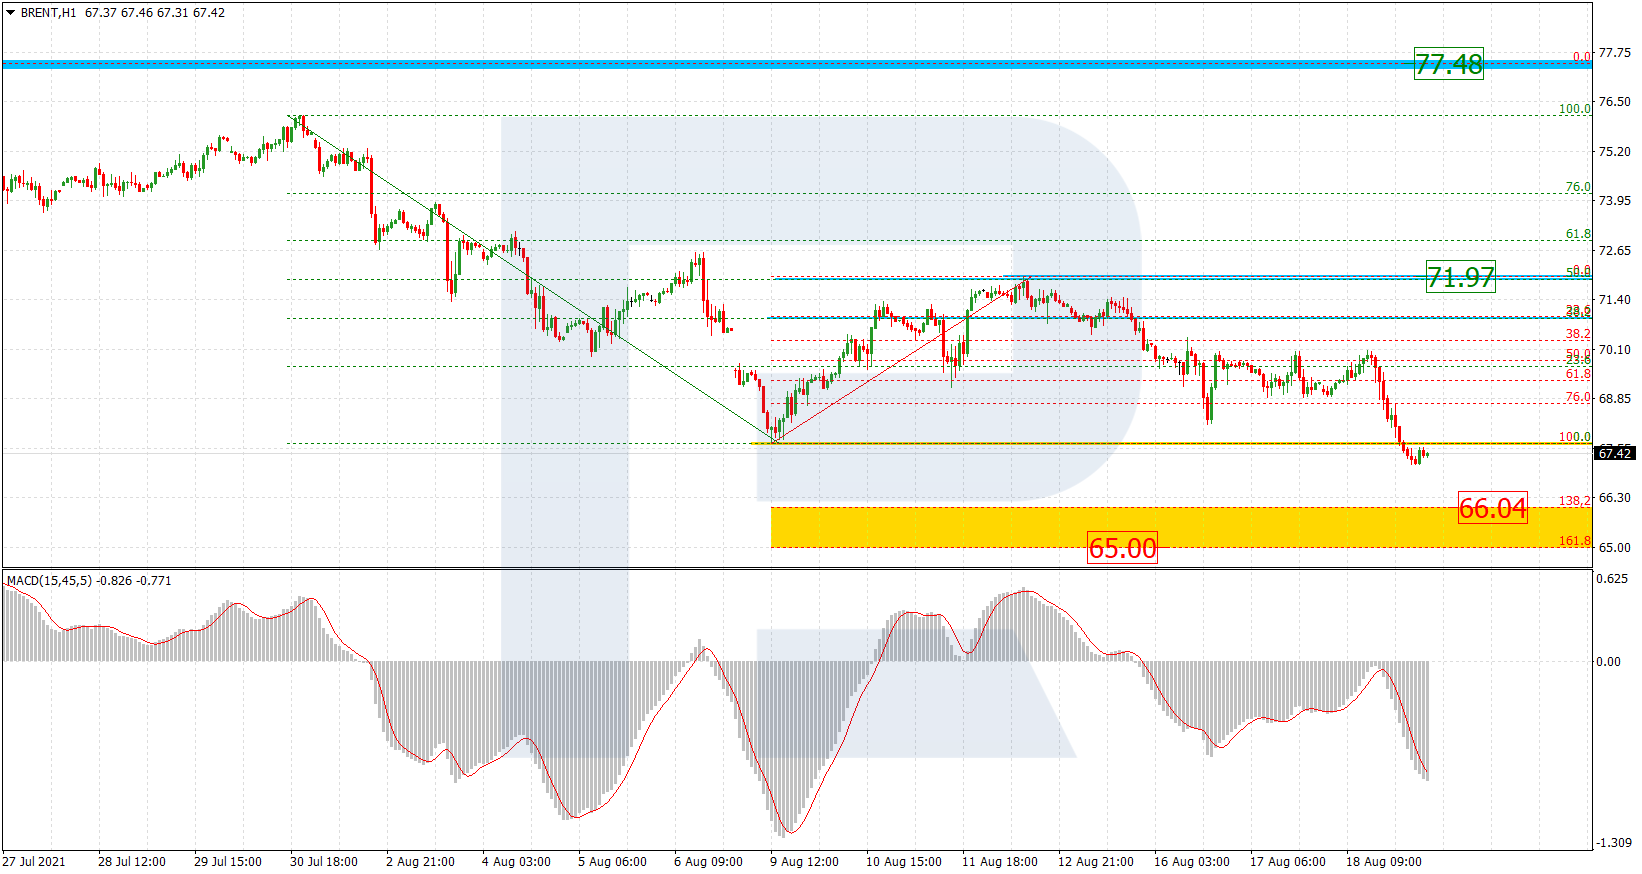
As we can see in the H1 chart, after breaking the low at 67.67, the asset is attempting to form a new descending wave to reach the post-correctional extension area between 138.2% and 161.8% fibo at 66.04 and 65.00 respectively. The resistance is the fractal at 71.97.
Dow Jones
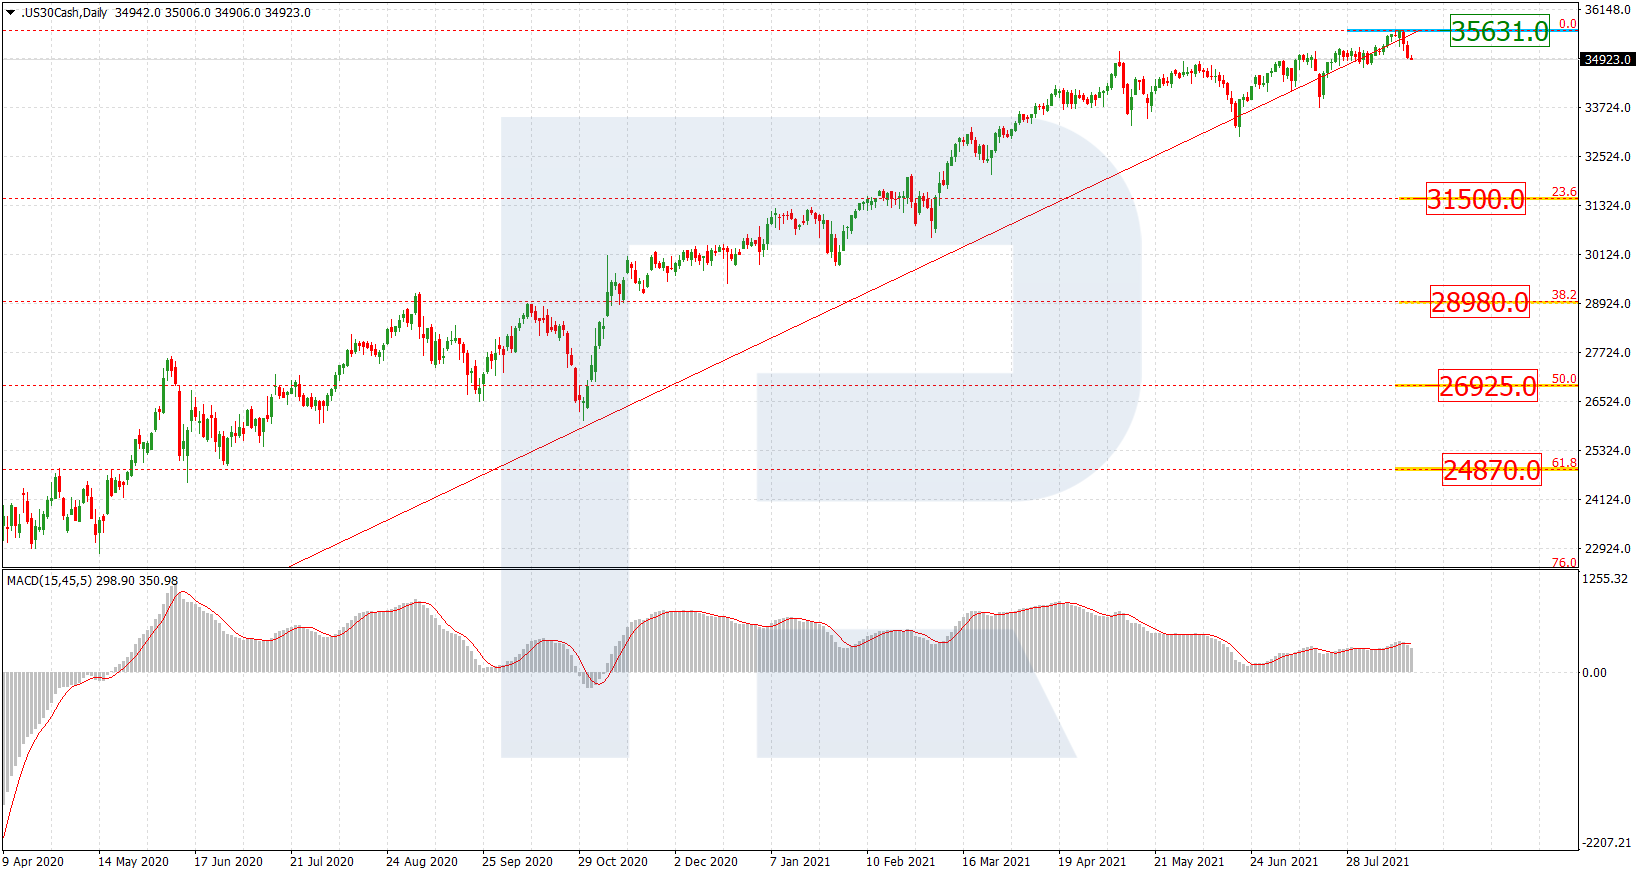
The daily chart shows a new decline after another update of the high and divergence on MACD. If the pair does start a new bearish phase, its targets might be 23.6%, 38.2%, 50.0%, and 61.8% fibo at 31500.0, 28980.0, 26925.0, and 24870.0 respectively. The key resistance is the high at 35631.0.
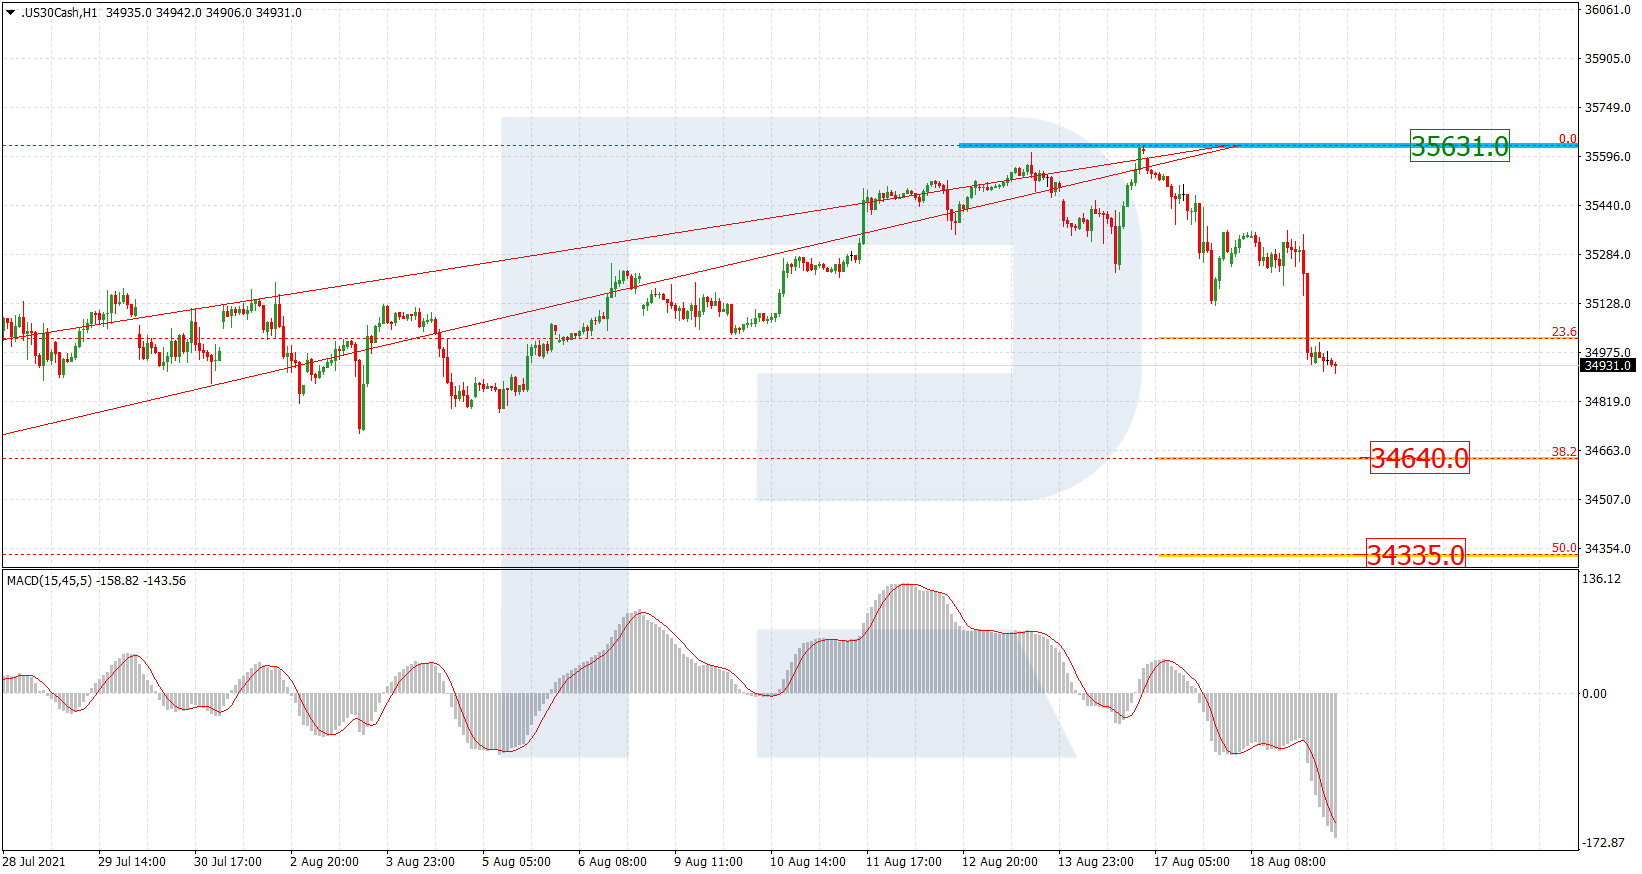
In the H1 chart, the asset is correcting downwards after finishing a mid-term wave to the upside and has already reached 23.6% fibo. Later, the instrument may continue falling towards 38.2% and 50.0% fibo at 34640.0 and 34335.0 respectively.
Forecasts presented in this section only reflect the author’s private opinion and should not be considered as guidance for trading. RoboForex bears no responsibility for trading results based on trading recommendations described in these analytical reviews.