Fibonacci Retracements Analysis 30.09.2021 (Brent, Dow Jones)
Brent
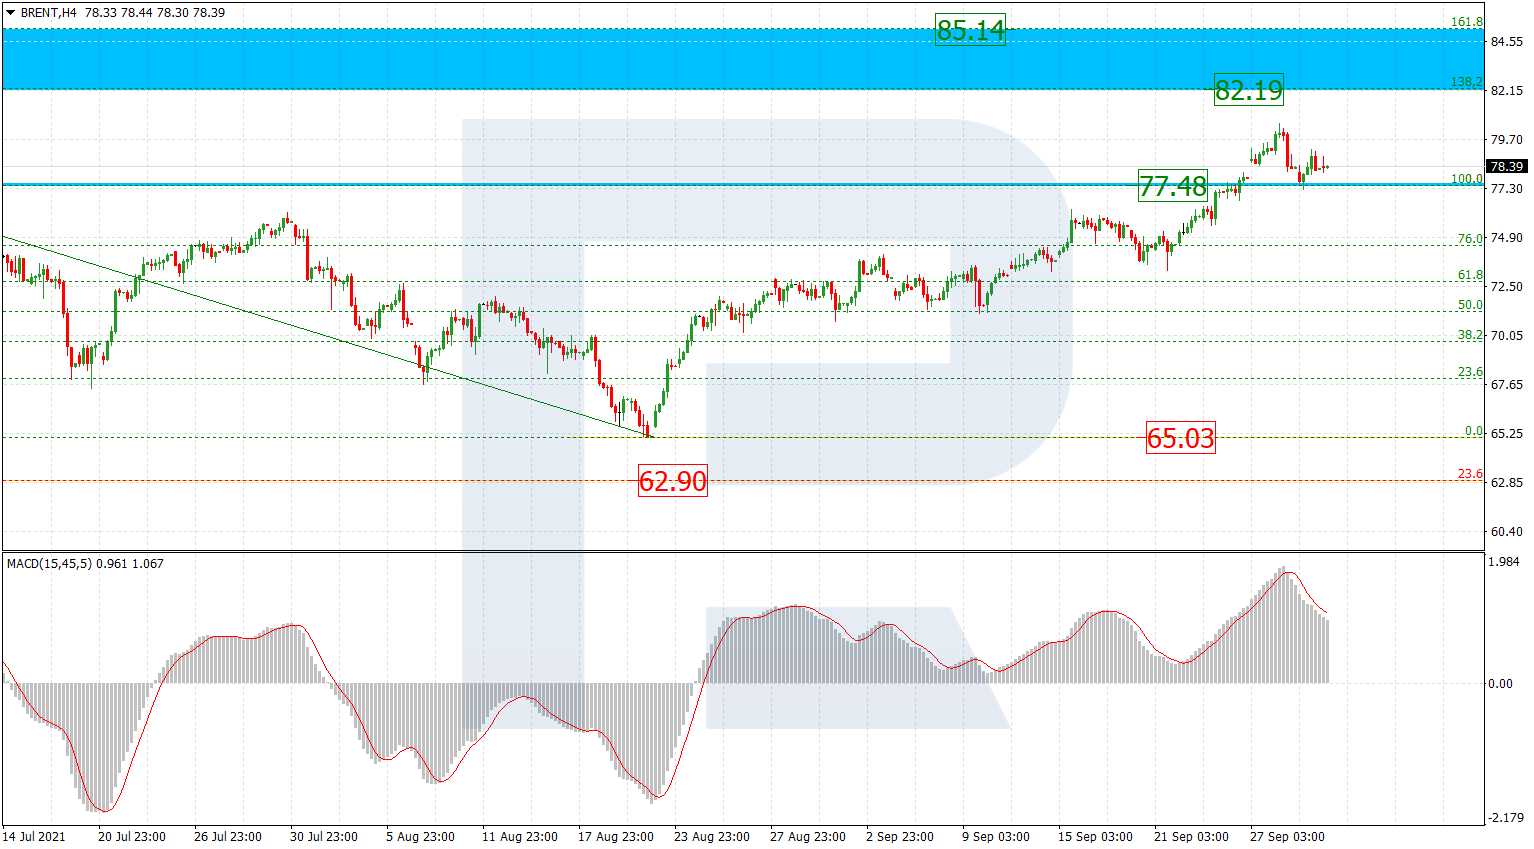
As we can see in the H4 chart, Brent is correcting towards 77.48, which was broken earlier. Later, the price may complete the pullback and resume growing to reach the post-correctional extension area between 138.2% and 161.8% fibo at 82.19 and 85.14 respectively. The key support here is the local low at 65.03.

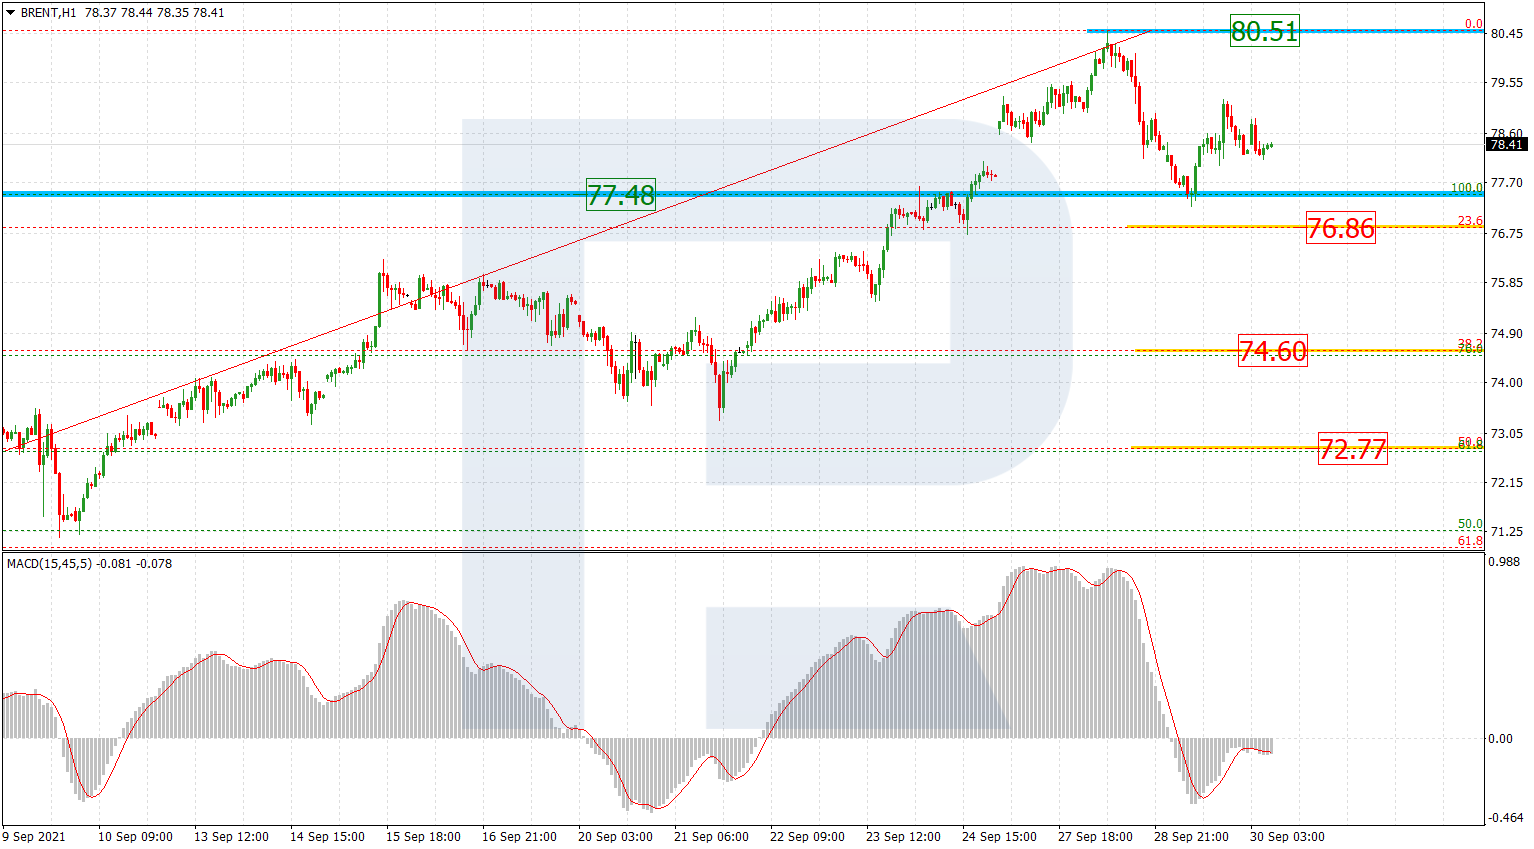
The H1 chart shows the potential downside correctional targets, 23.6%, 38.2%, and 50.0% fibo at 76.86, 74.60, and 72.77 respectively. The key resistance is the high at 80.51.
Dow Jones
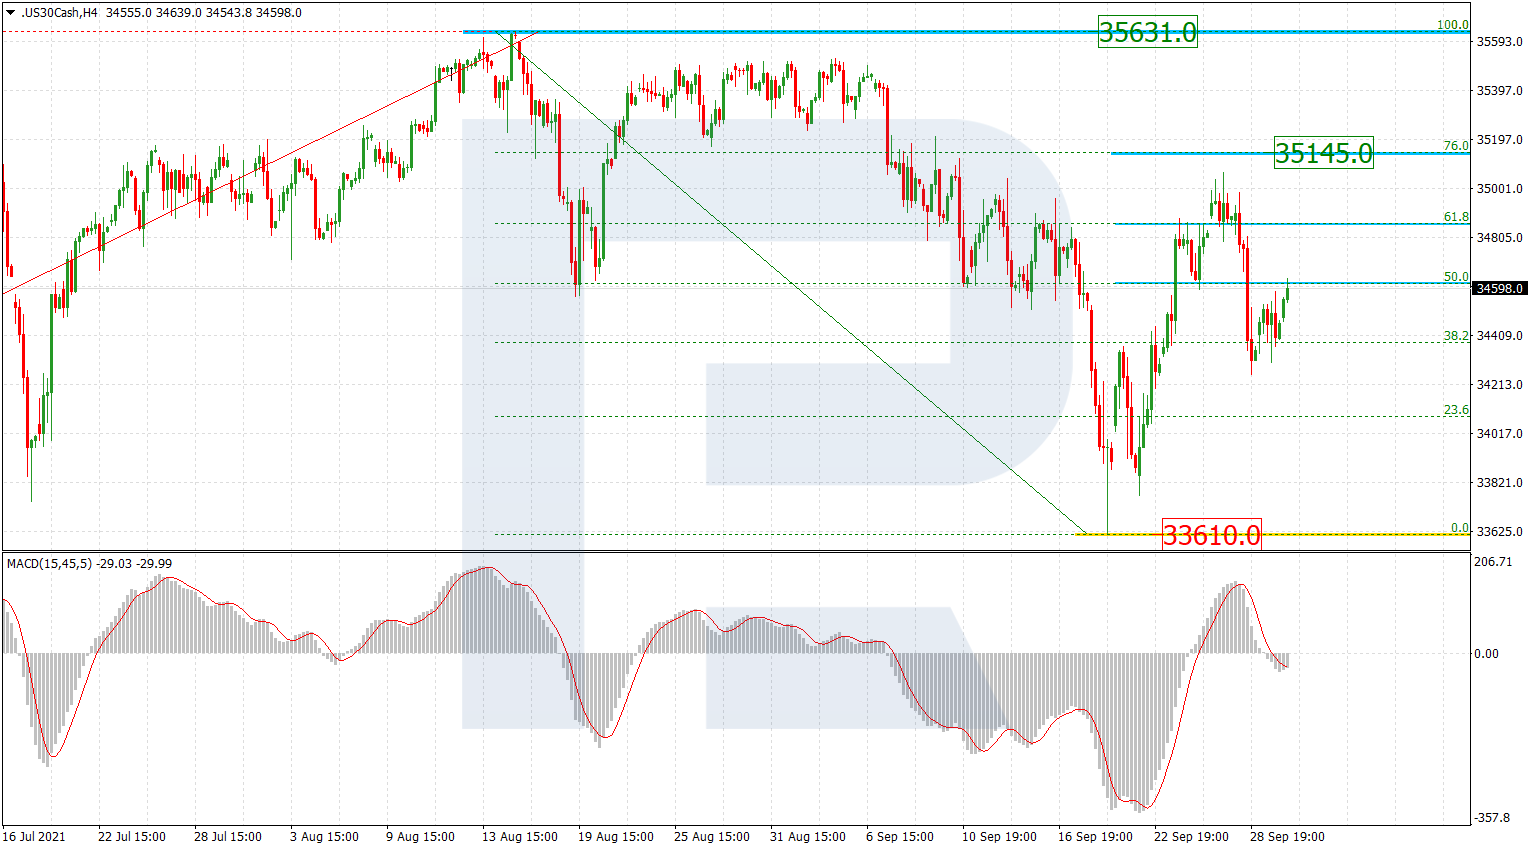
As we can see in the H4 chart, the Dow Jones Index has corrected upwards by 61.8% and may start a new decline to break the low at 33610.0. However, there is a possibility that the asset may form a quick short-term rising impulse towards 76.0% fibo at 35145.0. A breakout of the low will lead to a further downtrend towards 23.6% fibo at 31500.0. The resistance is the high at 35631.0.
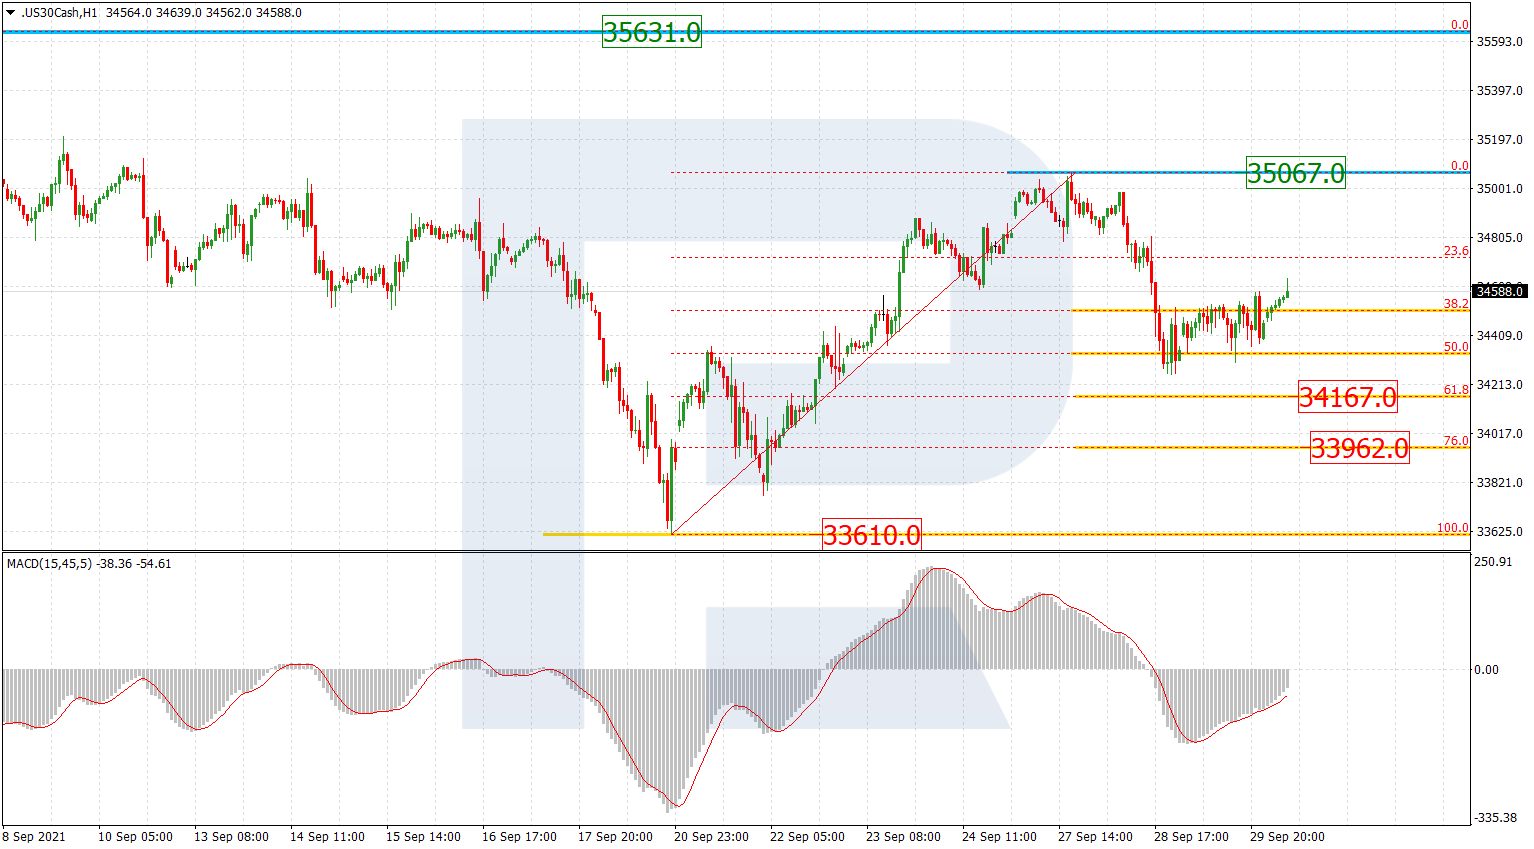
The H1 chart shows a more detailed structure of the descending wave after divergence on MACD, which has already reached 50.0% fibo. At the moment, the asset is correcting upwards. The next downside targets may be 61.8% and 76.0% fibo at 34167.0 and 33962.0 respectively. the local resistance is at 35067.0.
Forecasts presented in this section only reflect the author’s private opinion and should not be considered as guidance for trading. RoboForex bears no responsibility for trading results based on trading recommendations described in these analytical reviews.