Japanese Candlesticks Analysis 25,06.2013 (EUR/USD, USD/JPY)
25.06.2013
Analysis for June 25th, 2013
EUR/USD
The H4 chart of the EUR/USD currency pair shows a correction, which is indicated by Tower pattern. The closest Window is a support level. Doji pattern, Three Line Break chart, and Heiken Ashi candlesticks confirm an ascending movement.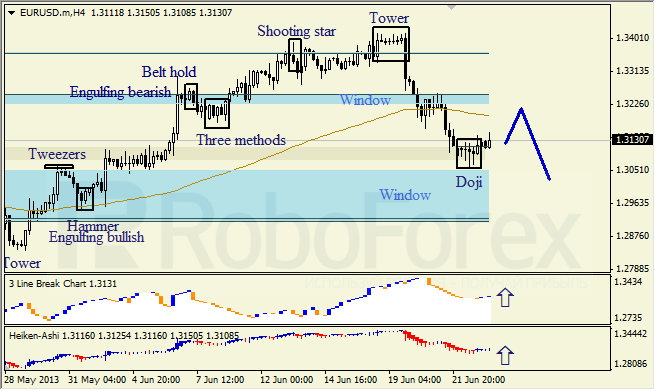
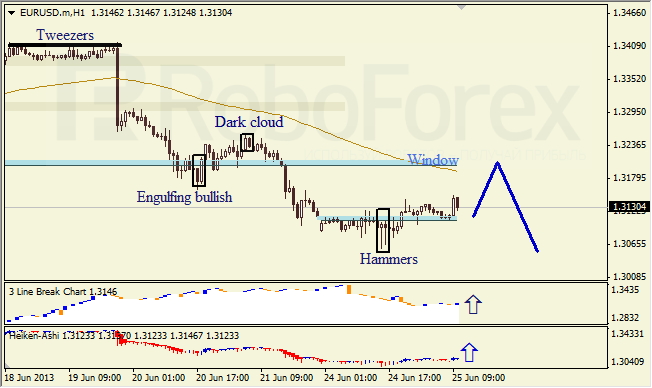
The H1 chart of the EUR/USD currency pair shows a sideways correction on the descending trend. A new Window is a support level. Hammers pattern, Three Line Break chart, and Heiken Ashi candlesticks confirm an ascending movement.
USD/JPY
The H4 chart of the USD/JPY currency pair shows the end of the correction on the descending trend. The closest Window is a resistance level. Evening Star pattern, Three Line Break chart, and Heiken Ashi candlesticks confirm a descending movement.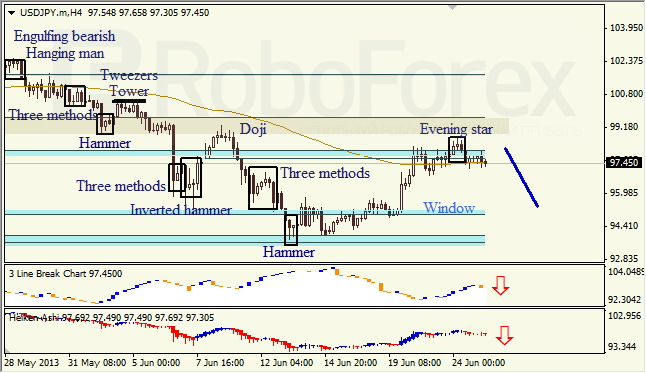
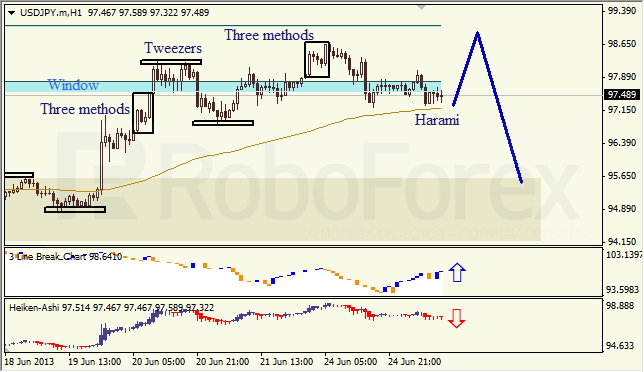
The H1 chart of the USD/JPY currency pair shows a sideways correction on the ascending trend. Harami pattern, Three Line Break chart, and Heiken Ashi candlesticks confirm the correction.
RoboForex Analytical Department
Attention!
Forecasts presented in this section only reflect the author’s private opinion and should not be considered as guidance for trading. RoboForex bears no responsibility for trading results based on trading recommendations described in these analytical reviews.