Japanese Candlesticks Analysis 06.08.2012 (EUR/USD, USD/JPY)
06.08.2012
Analysis for August 6th, 2012
EUR/USD
The H4 chart of the EUR/USD currency pair shows a sideways tendency on the descending trend. After completing Harami pattern near the closest Window, the price started a local growth. In the future, we can expect the correction, at least. Three Line Break and Heiken Ashi candlesticks charts confirm an ascending movement.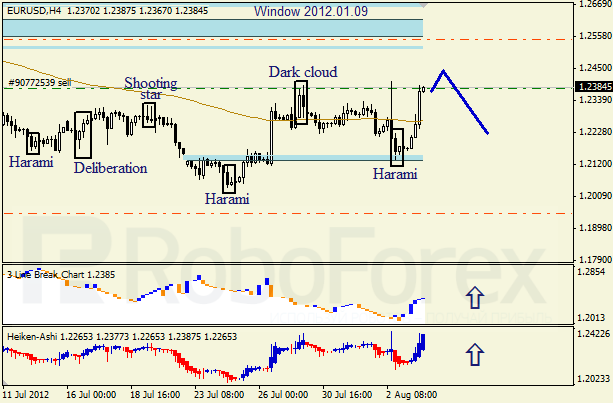
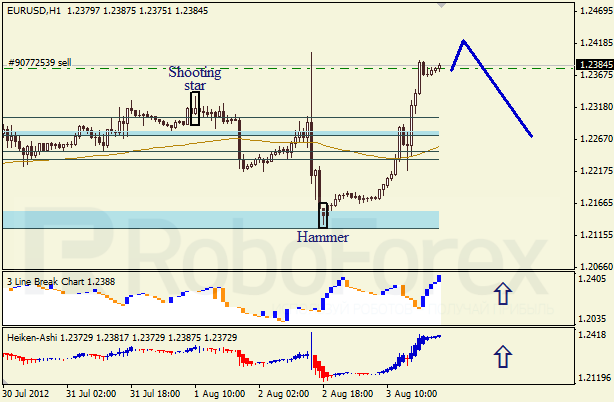
The H1 chart of the EUR/USD currency pair shows a bullish tendency on the sideways trend. After forming Hammer pattern near the closest Window, the price started growing up again, but it won’t probably last long. Three Line Break and Heiken Ashi candlesticks charts confirm an ascending movement.
USD/JPY
The H4 chart of the USD/JPY currency pair shows a sideways tendency on the descending trend. After finishing Piercing Line pattern, the price started the correction. Last Friday the pair formed Harami near the closest Window, the pattern which indicates that the price may start falling down. Three Line Break and Heiken Ashi candlesticks charts indicate a bullish pullback.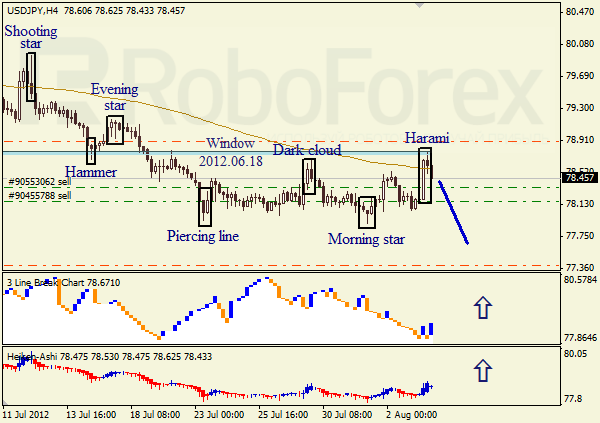
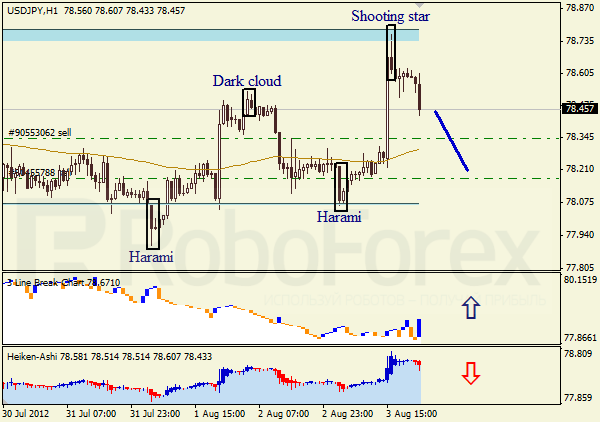
The H1 chart of the USD/JPY currency pair shows a bullish tendency on the ascending trend. Shooting Star pattern, formed near the closest Window, indicates that the pair may continue moving downwards. Three Line Break chart indicates a bullish pullback, Heiken Ashi candlesticks confirm a descending movement.
Attention!
Forecasts presented in this section only reflect the author’s private opinion and should not be considered as guidance for trading. RoboForex bears no responsibility for trading results based on trading recommendations described in these analytical reviews.