Japanese Candlesticks Analysis 27.02.2015 (EUR/USD, USD/JPY)
27.02.2015
Analysis for February 27th, 2015
EUR USD, “Euro vs. US Dollar”
At the H4 chart of EUR USD, after forming Shooting Star and Tweezers patterns, the price resumed falling. The pair has reached the closest Window and if the market is able to stay below it, the pair may continue moving downwards. In general, Three Line Break chart and Heiken Ashi candlesticks indicate a descending tendency.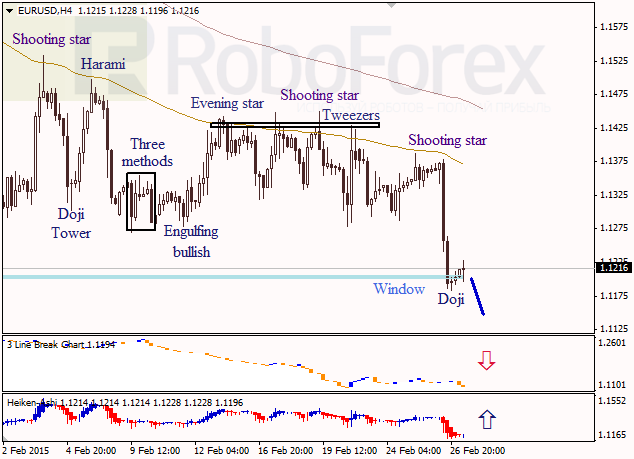
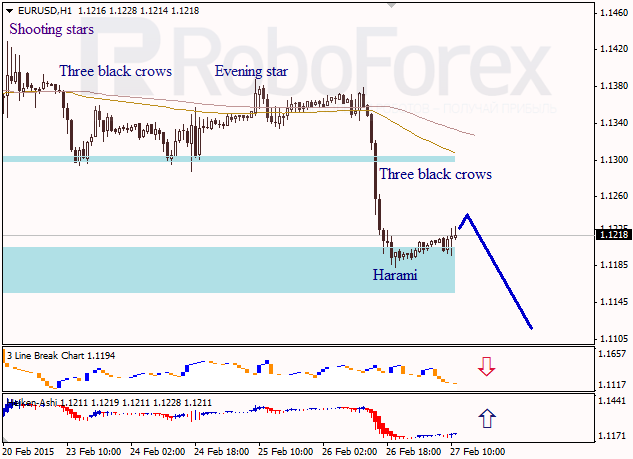
As we can see at the H1 chart of EUR USD, after completing Evening Star pattern, the pair fell very fast and formed Three Black Crows pattern. If the price forms any bearish patterns during the correction, it may resume falling, which is confirmed by a descending movement indicated by Three Line Break chart.
USD JPY, “US Dollar vs. Japanese Yen”
At the H4 chart of USD JPY, we can see that the price has formed Engulfing Bullish pattern near the Moving Averages. In the near term, the market may continue moving towards the upper Window. Three Line Break chart and Heiken Ashi candlesticks confirm that the pair may continue growing.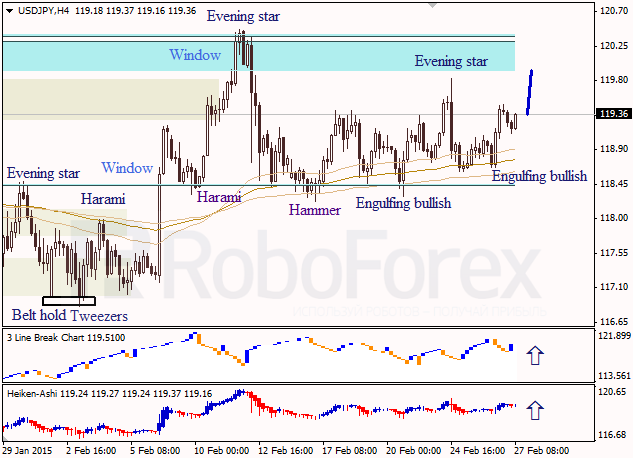
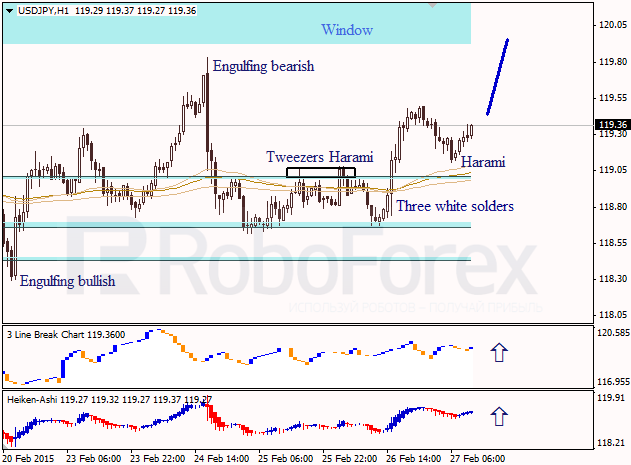
As we can see at the H1 chart of USD JPY, the pair has formed Three White Soldiers pattern near the closest Window. Later the price may start growing towards the upper Window. Three Line Break chart and Heiken Ashi candlesticks indicate an ascending movement.
RoboForex Analytical Department
Attention!
Forecasts presented in this section only reflect the author’s private opinion and should not be considered as guidance for trading. RoboForex bears no responsibility for trading results based on trading recommendations described in these analytical reviews.