Ichimoku Cloud Analysis 31.01.2024 (EURUSD, NZDUSD, USDJPY)
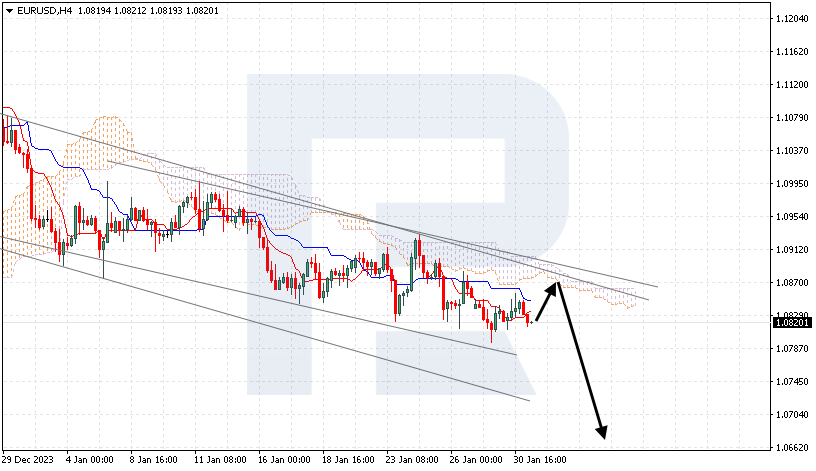
EURUSD, “Euro vs US Dollar”
EURUSD is testing the support area. The instrument is going below the Ichimoku Cloud, which suggests a bearish trend. A test of the lower boundary of the Cloud at 1.0860 is expected, followed by a decline to 1.0675. An additional signal confirming the decline could be a rebound from the upper boundary of the bearish channel. The scenario could be cancelled by a breakout of the upper boundary of the Cloud with the price finding a foothold above 1.0925, which will mean a further rise to 1.1015.

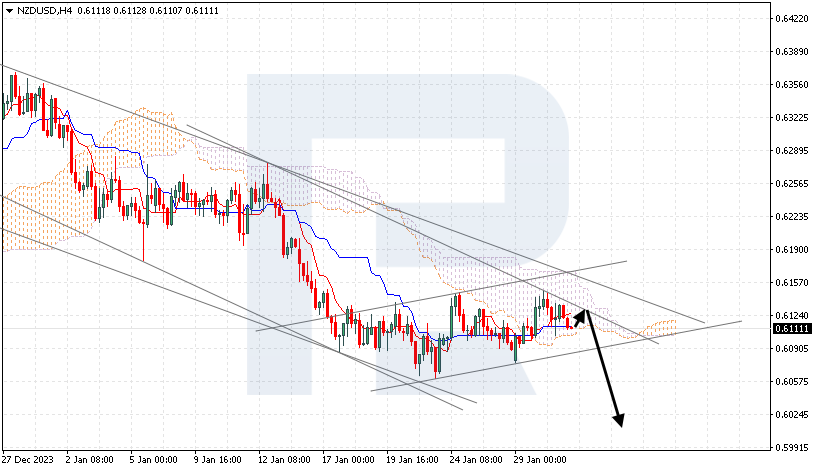
NZDUSD, “New Zealand Dollar vs US Dollar”
NZDUSD has found a foothold under the signal lines of the indicator. The instrument is going inside the Ichimoku Cloud, which suggests a sideways trend. A test of the upper boundary of the Cloud at 0.6125 is expected, followed by a decline to 0.6025. An additional signal confirming the decline could be a rebound from the upper boundary of the descending channel. The scenario could be cancelled by a breakout of the upper boundary of the Cloud with the price finding a foothold above 0.6195, which will mean a further rise to 0.6285. Meanwhile, the decline could be confirmed by a breakout of the lower boundary of the ascending channel with the price finding a foothold under 0.6055.
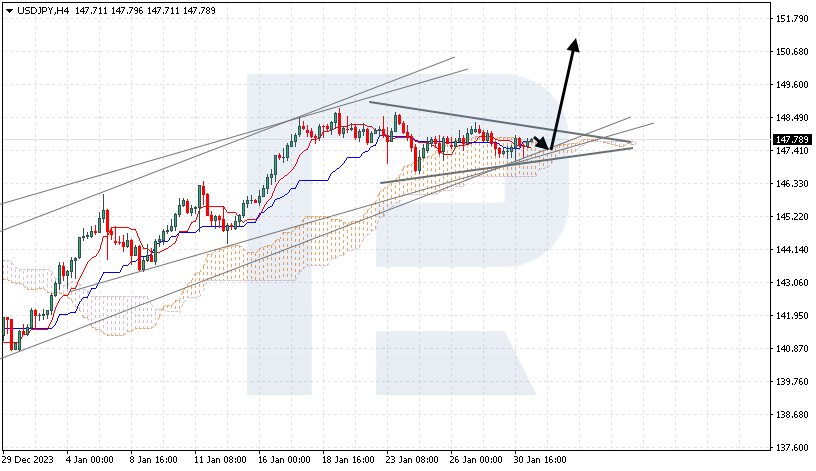
USDJPY, “US Dollar vs Japanese Yen”
USDJPY is correcting within a Triangle pattern. The instrument is going above the Ichimoku Cloud, which suggests an uptrend. A test of the upper boundary of the Cloud at 147.40 is expected, followed by a rise to 150.65. An additional signal confirming the rise could be a rebound from the lower boundary of the bullish channel. The scenario could be cancelled by a breakout of the lower boundary of the Cloud with the price finding a foothold under 146.05, which will mean a further decline to 145.15. Meanwhile, the growth could be supported by a breakout of the upper boundary of the Triangle pattern with the price finding a foothold above the 148.65 level.
Forecasts presented in this section only reflect the author’s private opinion and should not be considered as guidance for trading. RoboForex bears no responsibility for trading results based on trading recommendations described in these analytical reviews.