Murrey Math Lines 22.01.2019 (AUDUSD, NZDUSD)
AUDUSD, “Australian Dollar vs US Dollar”
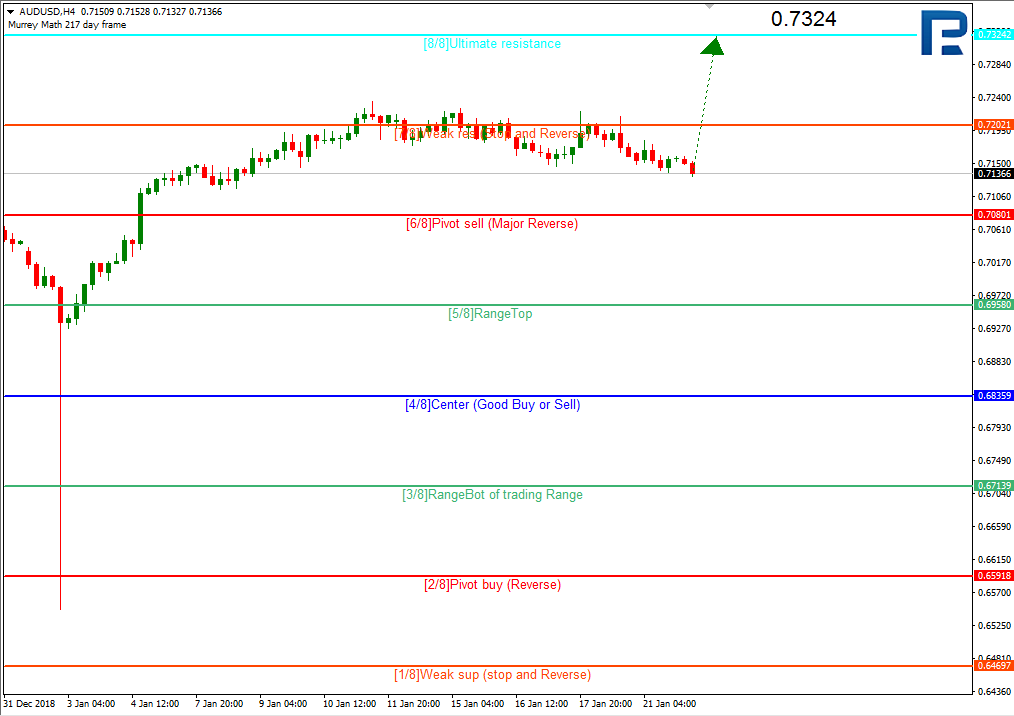
As we can see in the H4 chart, AUDUSD is still trading above the 5/8 level and may continue growing towards the resistance at the 8/8 one.

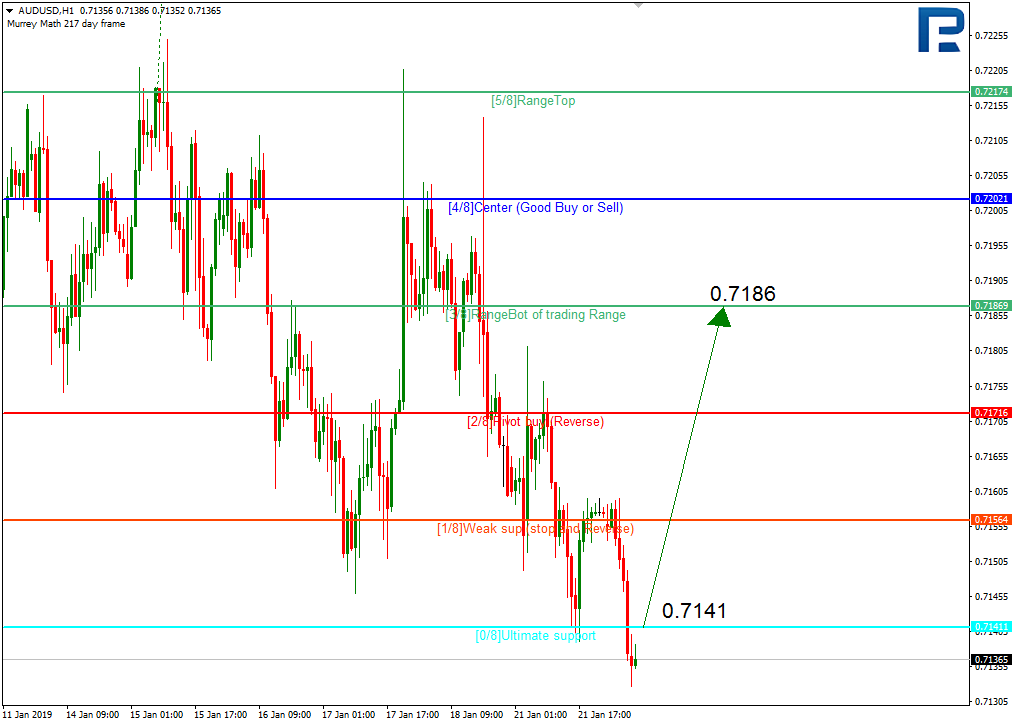
In the H1 chart, the pair is moving inside the “oversold zone”. In this case, the price may break the 0/8 level and continue growing to reach the resistance at the 3/8 one.
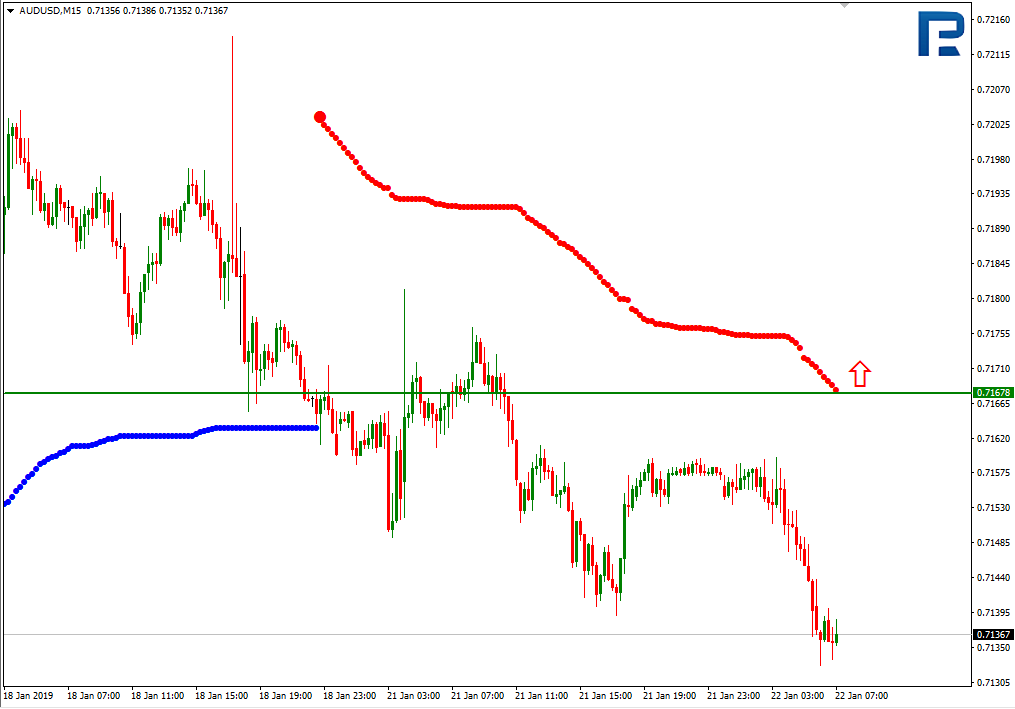
In the M15 chart, the pair may break the upside line of the VoltyChannel indicator and, as a result, continue moving upwards.
NZDUSD, “New Zealand Dollar vs US Dollar”
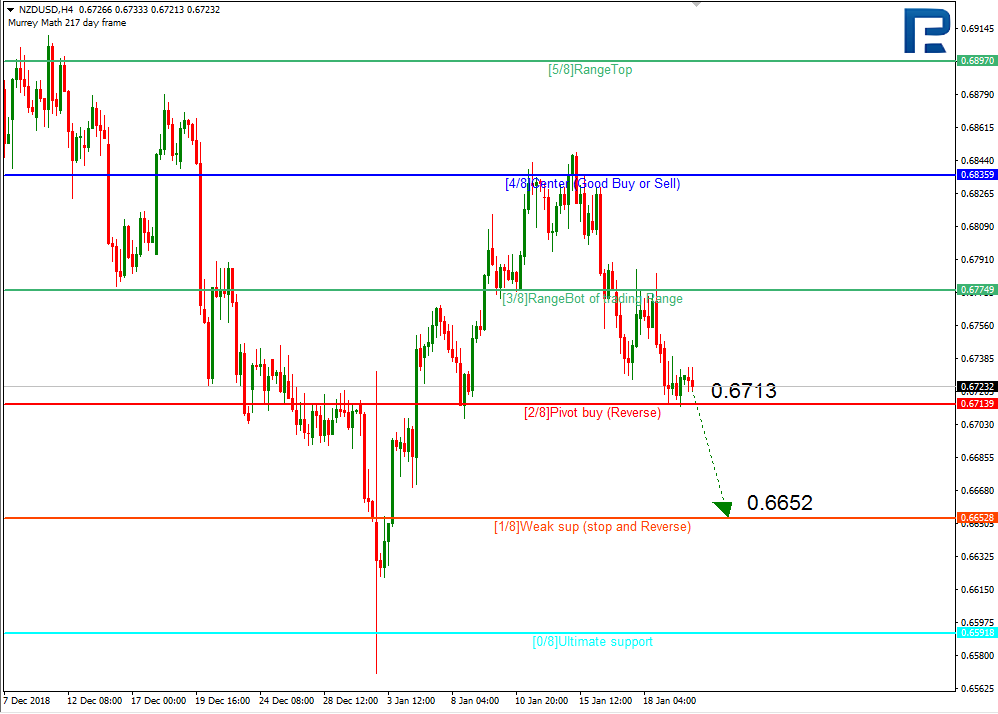
In the H4 chart, NZDUSD is trading below the 3/8 level. In the future, the price may resume falling towards the 1/8 level.
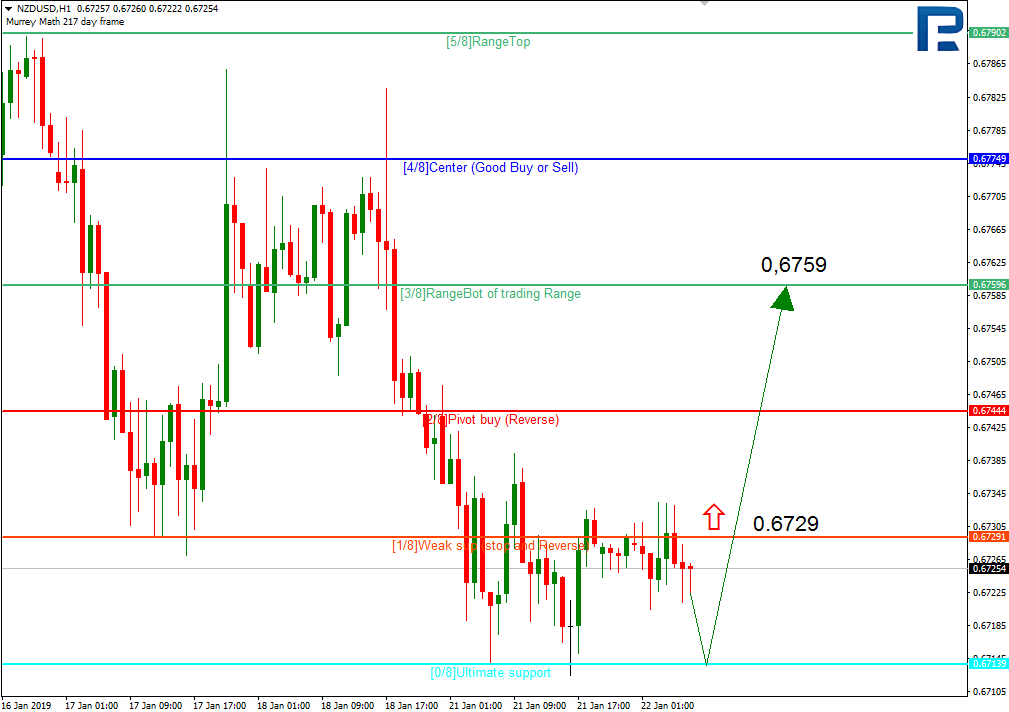
As we can see in the H1 chart, the pair rebounded from the support at the 0/8 level. In this case, the price may break the 1/8 level and continue growing towards the resistance at the 3/8 one.
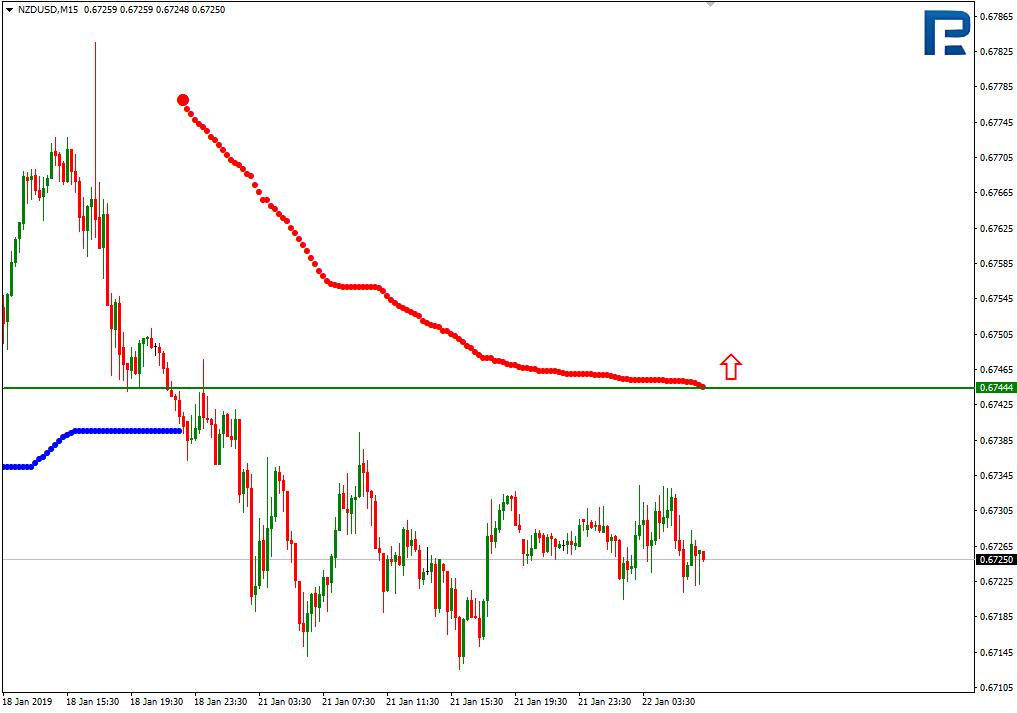
In the M15 chart, the pair may break the upside line of the VoltyChannel indicator and, as a result, continue trading upwards.
Forecasts presented in this section only reflect the author’s private opinion and should not be considered as guidance for trading. RoboForex bears no responsibility for trading results based on trading recommendations described in these analytical reviews.