Murrey Math Lines 25.12.2020 (Brent, S&P 500)
Brent
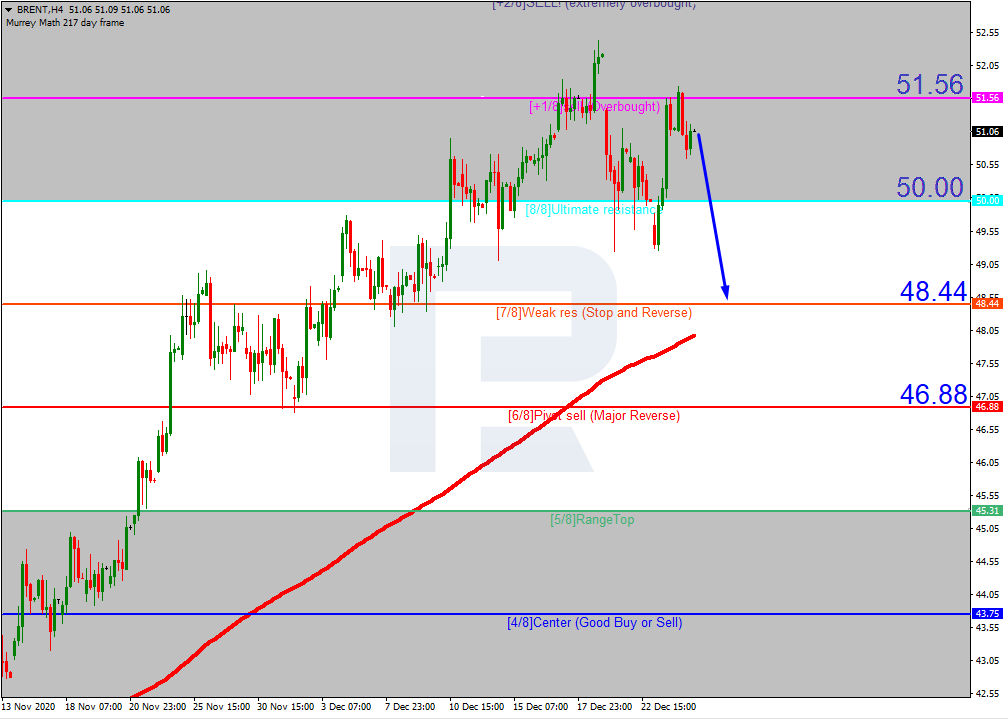
As we can see in the H4 chart, Brent is still moving inside the “overbought area”. At the moment, the price is rebounding from +1/8. In this case, the asset is expected to fall and reach 7/8. However, this scenario may no longer be valid if the price breaks +1/8 to the upside. After that, the instrument may continue growing towards the resistance at +2/8.

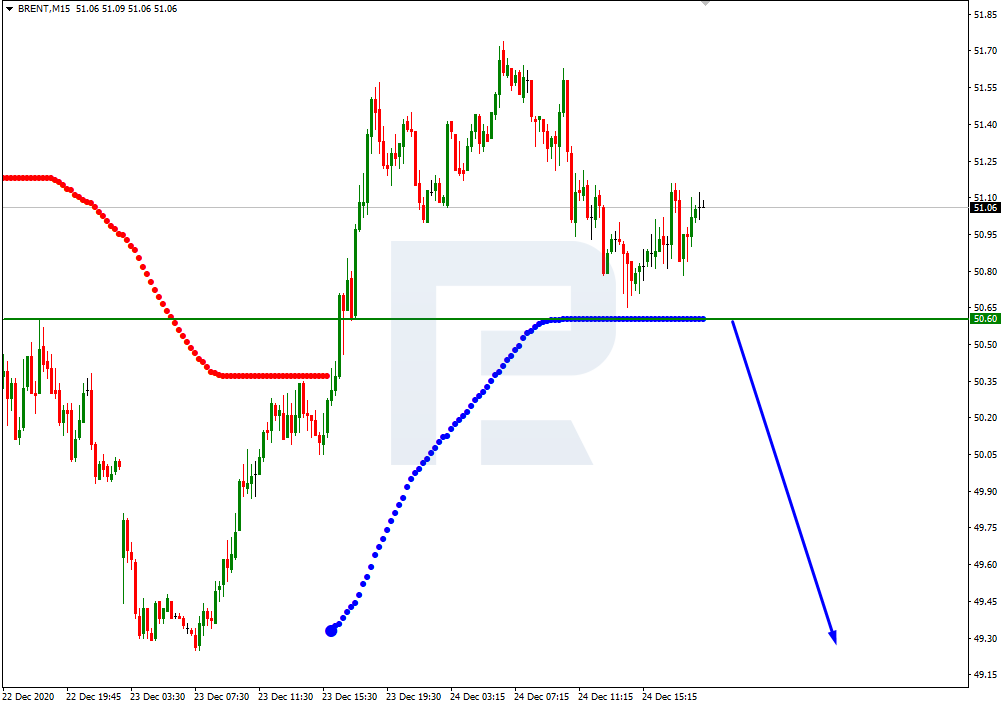
In the M15 chart, the price may break the downside line of the VoltyChannel indicator and, as a result, continue the descending tendency.
S&P 500
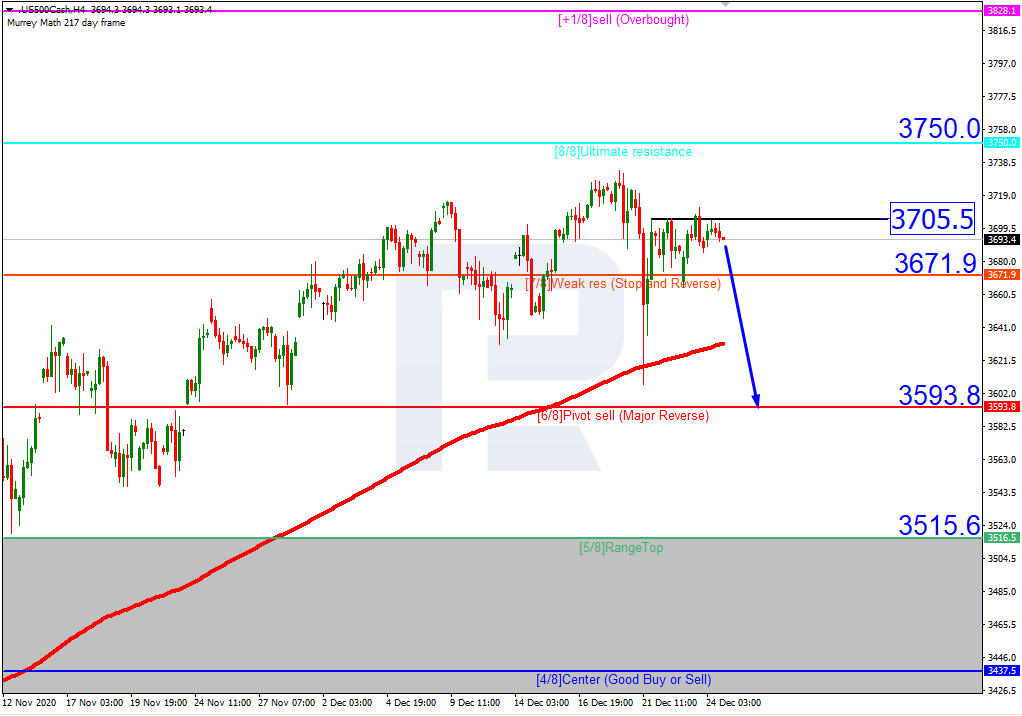
As we can see in the H4, the S&P Index has recovered a little bit after plunging earlier. Still, bulls don’t look strong enough because the asset failed to break its all-time highs. In this case, the asset is expected to break 7/8 and then continue falling towards the support at 6/8. However, this scenario may no longer be valid if the price breaks 3705.5 to the upside. After that, the instrument may continue moving upwards to reach the target at 8/8.
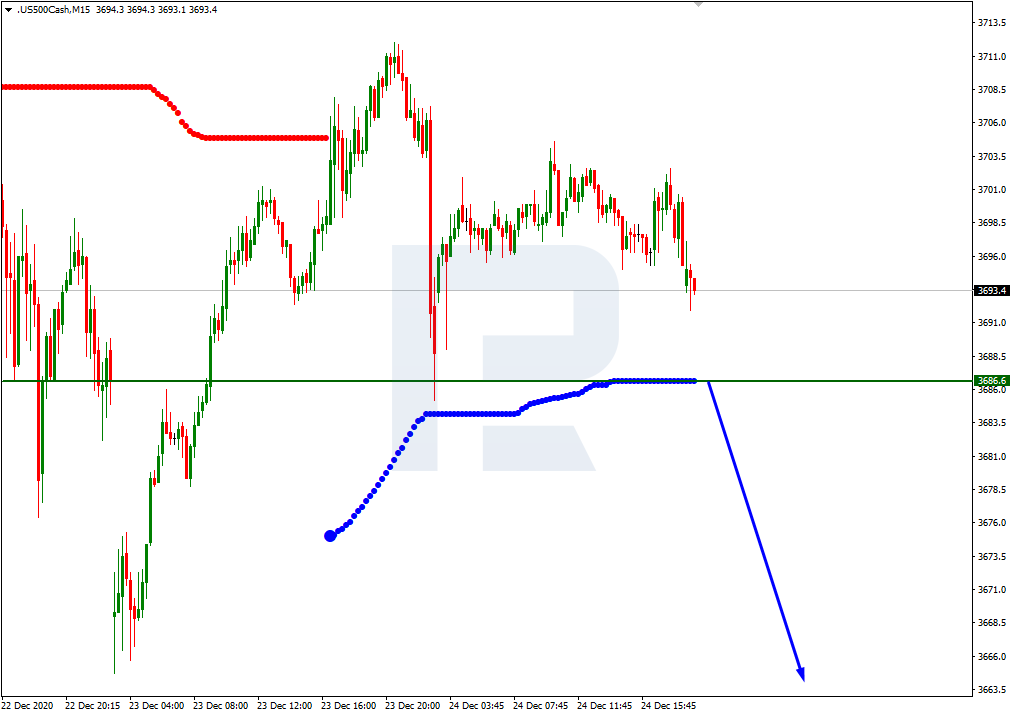
In the M15 chart, the price may break the downside line of the VoltyChannel indicator and, as a result, may continue its decline.
Forecasts presented in this section only reflect the author’s private opinion and should not be considered as guidance for trading. RoboForex bears no responsibility for trading results based on trading recommendations described in these analytical reviews.