Murrey Math Lines 02.08.2017 (EUR/USD, GBP/USD)
EUR USD, “Euro vs. US Dollar”
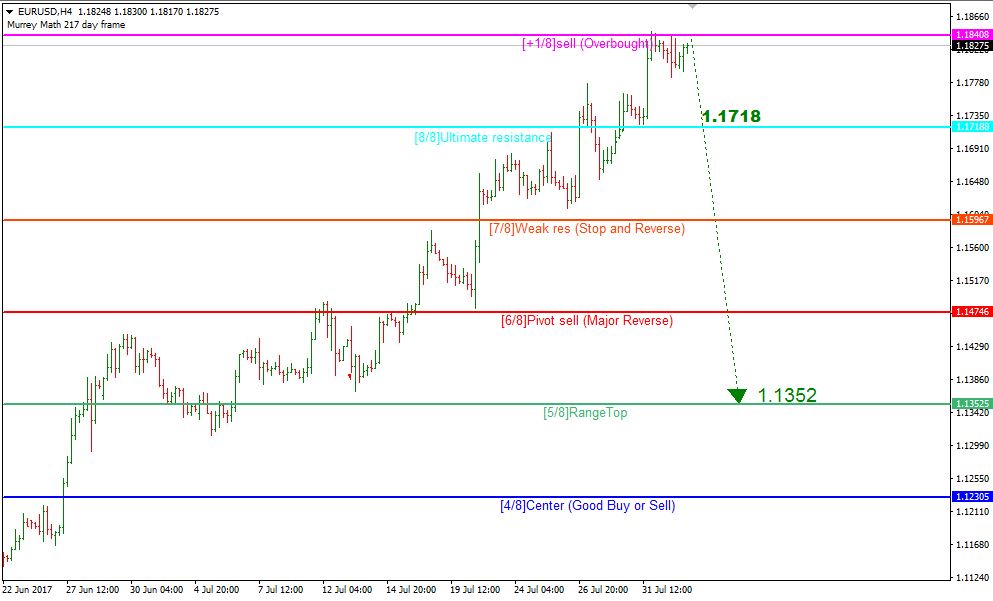
At the H4 chart, the EUR/USD pair is still trading inside the “overbought zone” close to the resistance at the +1/8 level at 1.1840. If the price rebounds from this level, it may fall towards 1.1352.
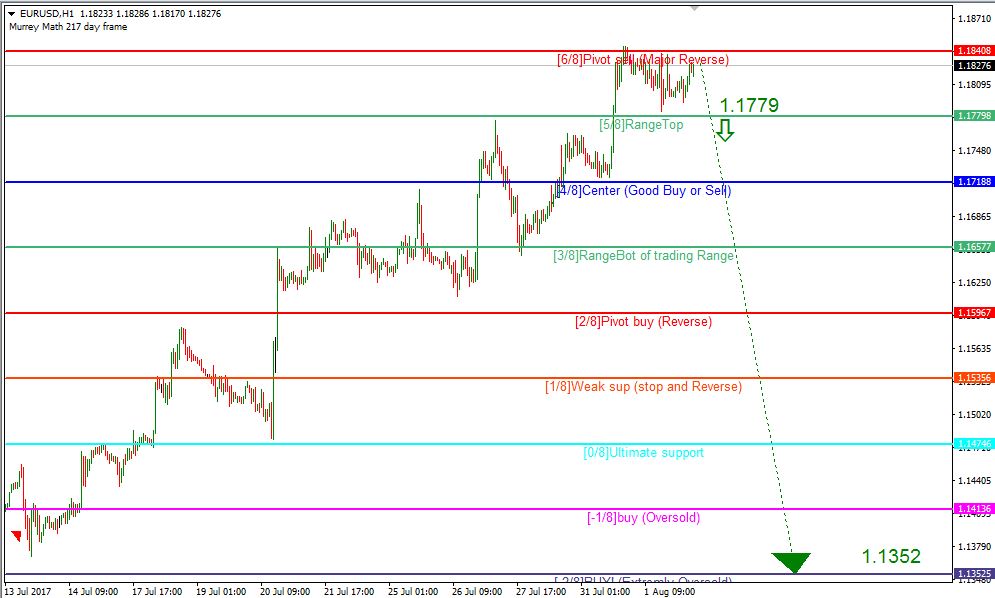
At the H1 chart, the pair is trading between the 5/8 and 6/8 levels. If the instrument breaks the 5/8 one at 1.1779, the price may move downwards to reach 1.1352.
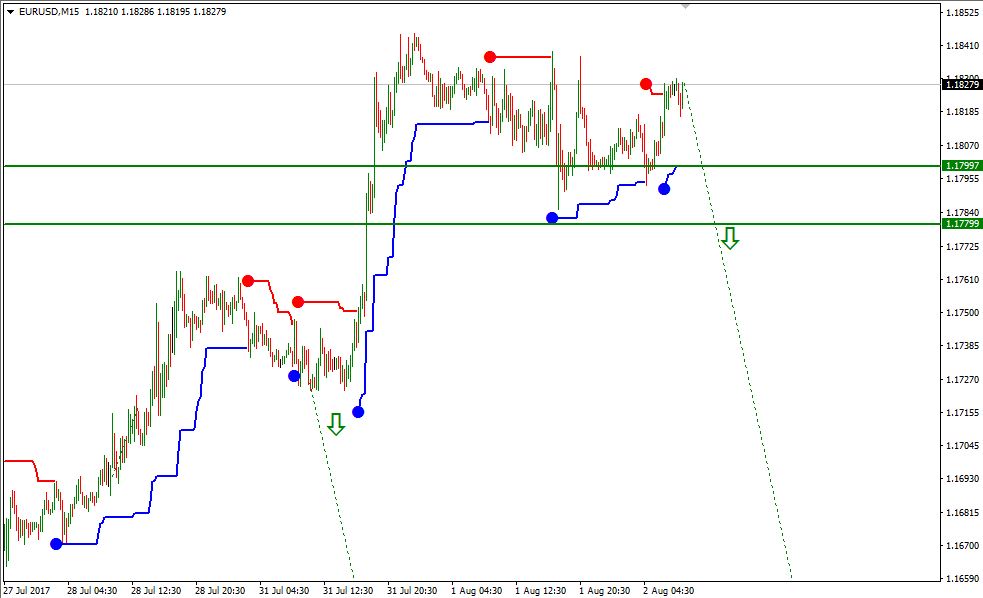
At the M15 chart, the price may break the downside line of the VoltyChannel indicator and, as a result, start a new decline.
GBP USD, “Great Britain Pound vs US Dollar”
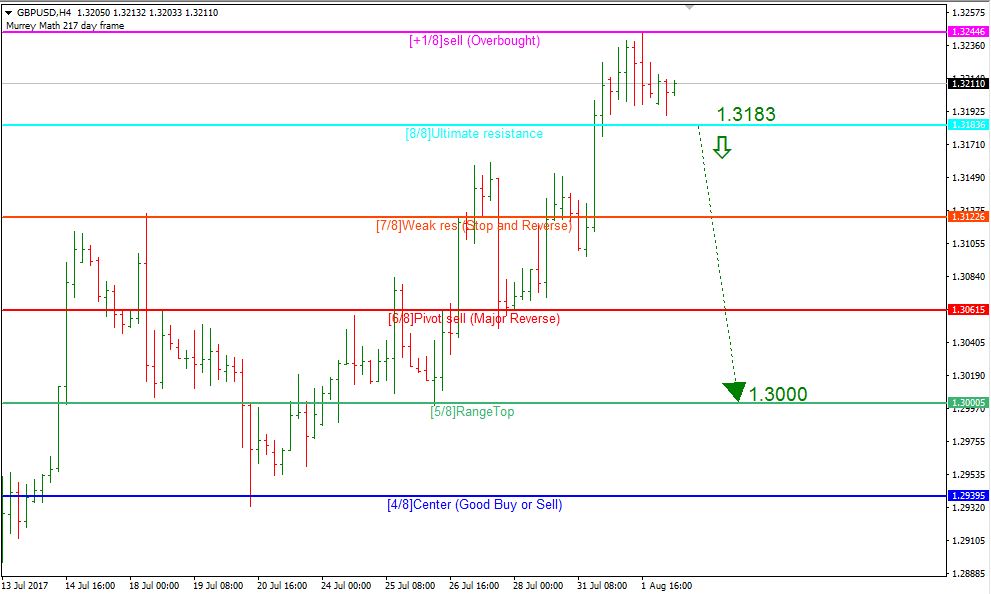
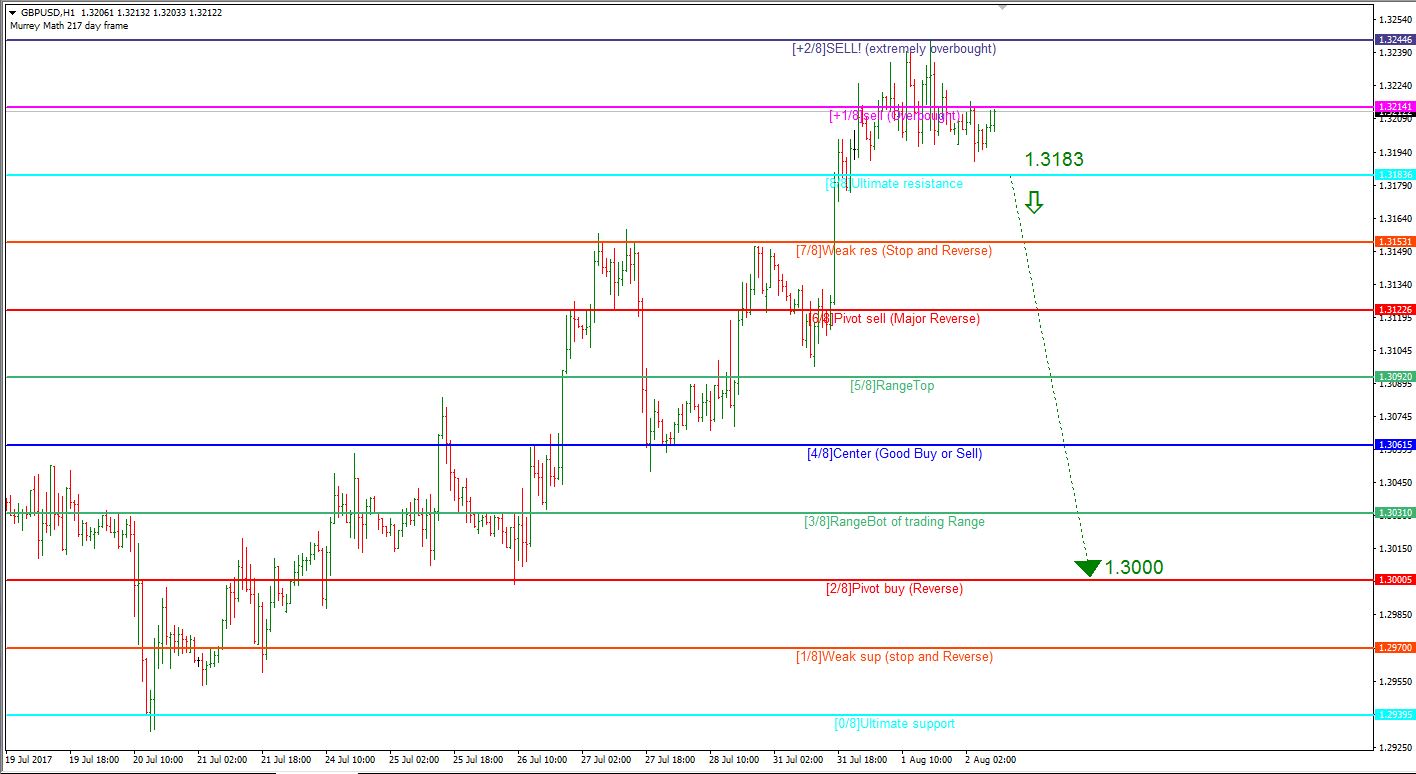
As we can see at the H4 chart, the GBP/USD pair hasn’t been able to decide where to move since yesterday. Right now, the price may fall towards 1.3000. A significant level to be broken is the 8/8 one at 1.3183. If the price breaks the +1/8 level at 1.3244, it may continue growing to break the +2/8 one. in this case, the levels at the chart will be redrawn.
At the H1 chart, the price is also trading inside the resistance area above the 8/8 level (1.3183). If the price breaks it, the pair may move downwards to reach 1.3000.
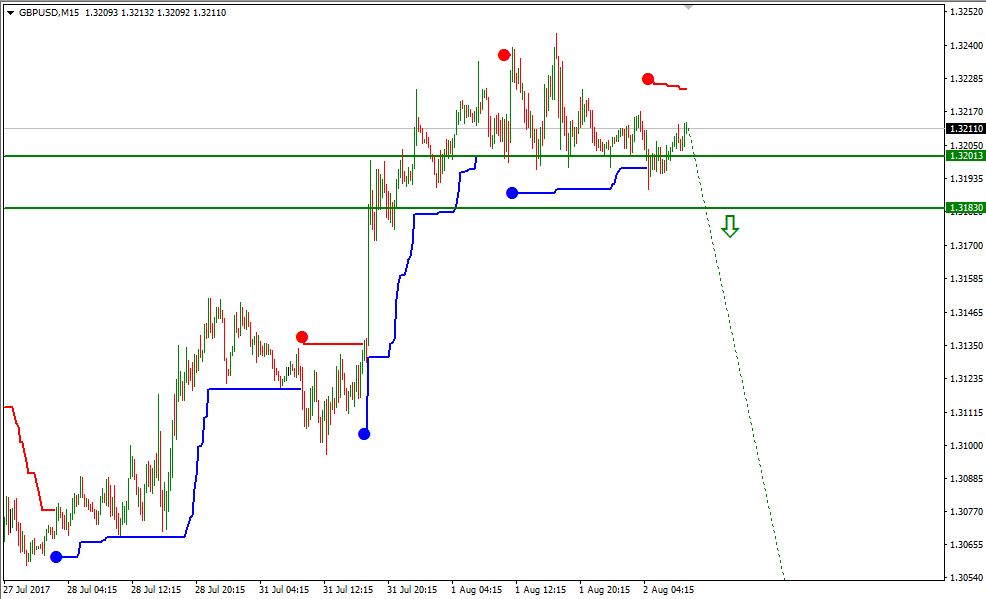
At the M15 chart, the pair broke the downside line of the VoltyChannel indicator. If the price breaks 1.3183, it may continue falling towards 1.3000.
RoboForex Analytical Department
Forecasts presented in this section only reflect the author’s private opinion and should not be considered as guidance for trading. RoboForex bears no responsibility for trading results based on trading recommendations described in these analytical reviews.