Murrey Math Lines 15.05.2019 (USDJPY, USDCAD)
USDJPY, “US Dollar vs. Japanese Yen”
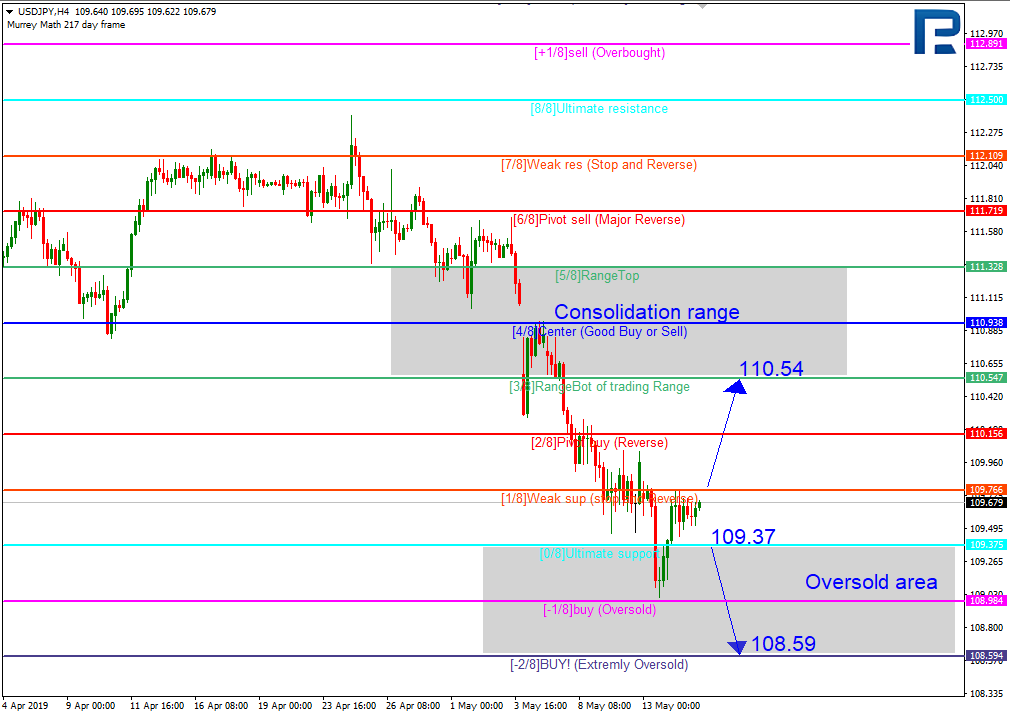
In the H4 chart, USDJPY has been trading downwards for almost two weeks without any significant corrections. In this case, the pair may break the 1/8 level and start a slight correction to the upside towards the resistance at the 3/8 one. However, this scenario will no longer be valid if the instrument breaks the 0/8 level. After that, the pair may resume trading downwards with the first target at the -2/8 level.

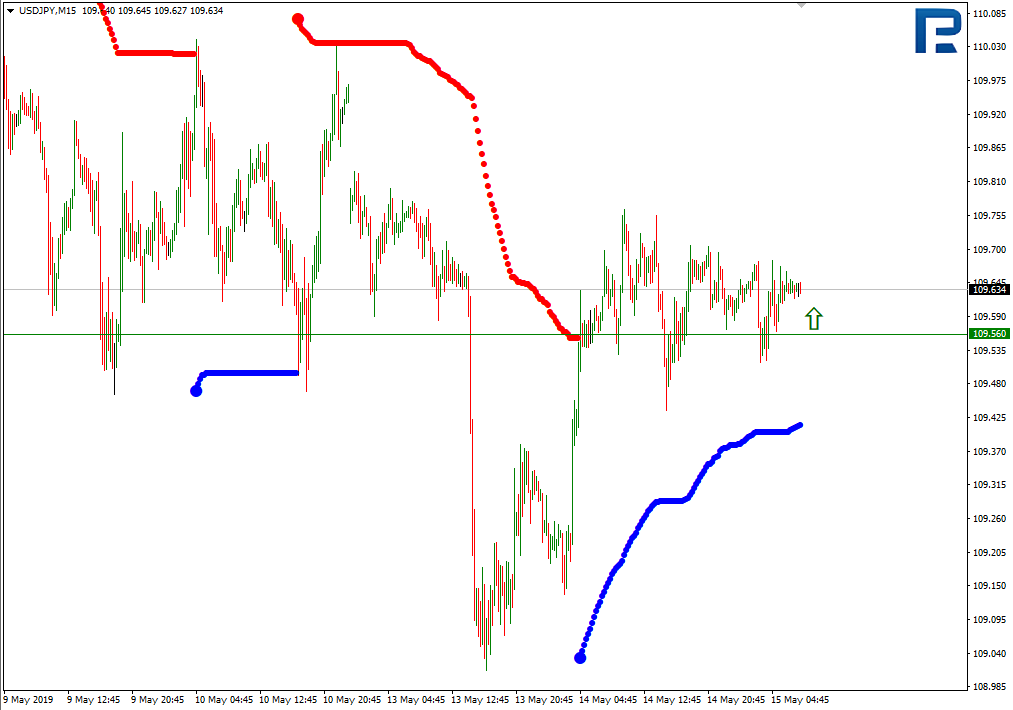
As we can see in the M15 chart, the pair has broken the upside line of the VoltyChannel indicator and, as a result, may resume trading upwards.
USDCAD, “US Dollar vs Canadian Dollar”
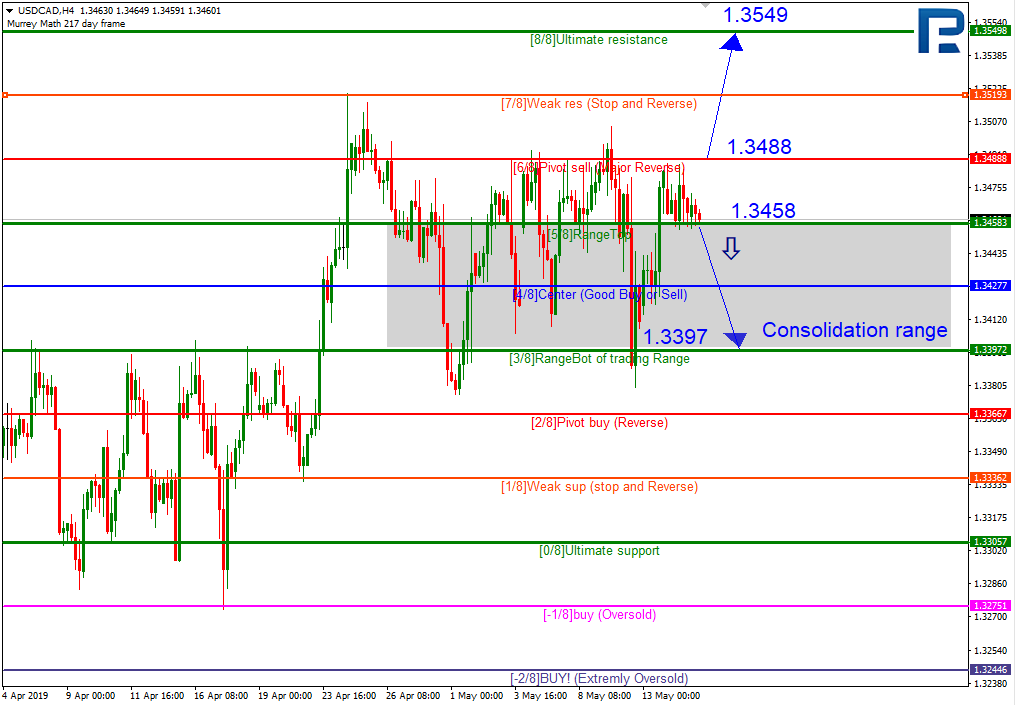
As we can see in the H4 chart, USDCAD has been trying to start a new descending tendency for almost three weeks, but every time it is stopped by the 3/8 level. This time, the price may break the 5/8 level and attempt to reach the 3/8 one again. However, this scenario may be cancelled if the instrument breaks the 6/8 level. In this case, the pair may resume trading upwards to reach the 8/8 one.
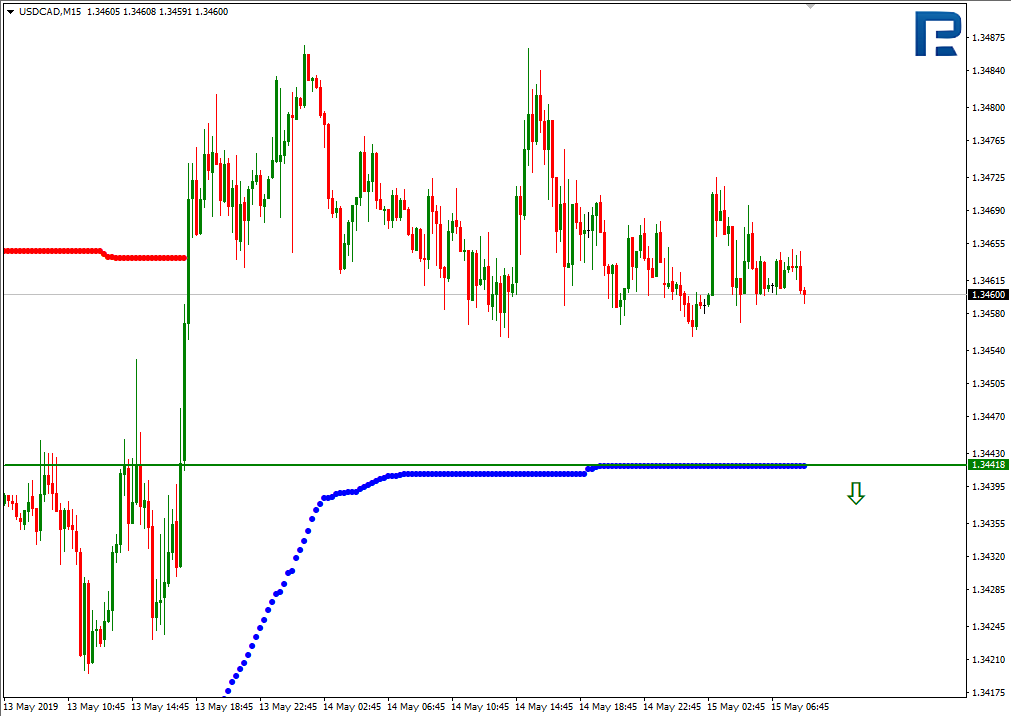
In the M15 chart, the pair may break the downside line of the VoltyChannel indicator and, as a result, continue trading downwards.
Forecasts presented in this section only reflect the author’s private opinion and should not be considered as guidance for trading. RoboForex bears no responsibility for trading results based on trading recommendations described in these analytical reviews.