Wave Analysis 30.04.2014 (DJIA Index, Crude Oil)
30.04.2014
Analysis for April 30th, 2014
DJIA Index
Probably, after completing wave (2), price started forming the third one, during which it may reach several historic maximums, So far, I’ve got two buy order, but I’m planning to increase my position in the future.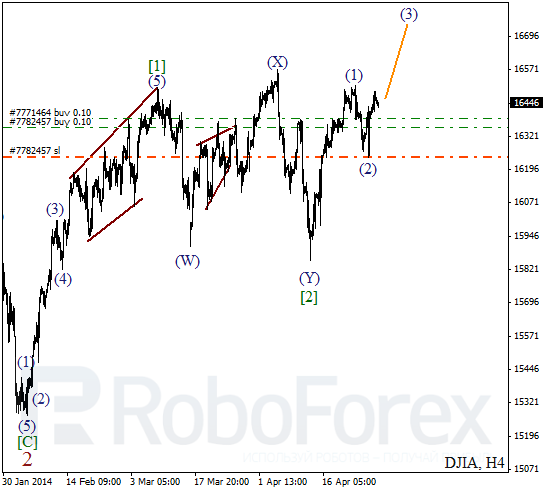
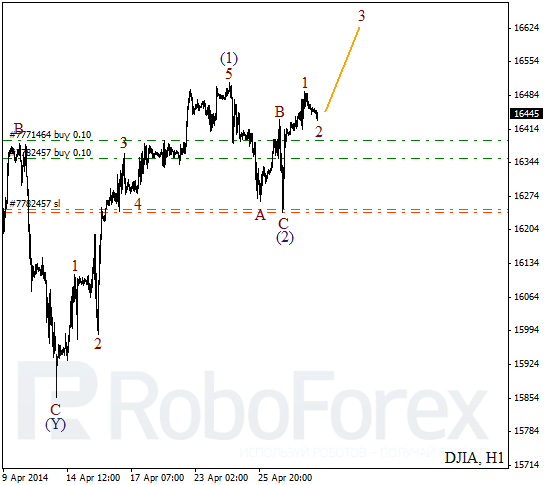
More detailed wave structure is shown on H1 chart. After finishing zigzag pattern inside wave (2), Index formed bullish impulse inside the first wave. During the day, price is expected to complete local correction, start growing up, and break previous maximum while forming the third wave.
Crude Oil
Oil continues falling down inside the third wave. Earlier, after finishing bearish impulse inside wave 1, price completed zigzag pattern inside the second one. In the near term, instrument may continue falling down and break local minimum.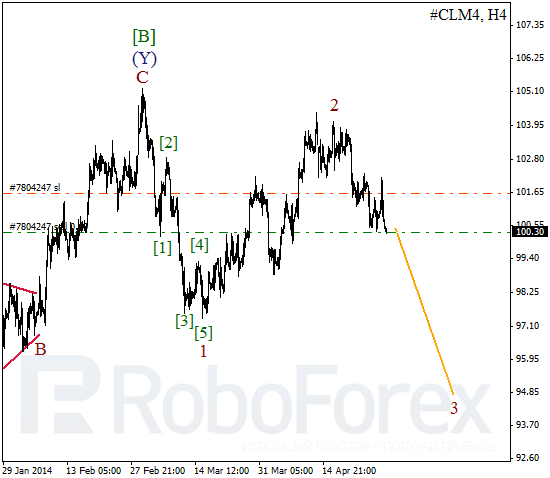
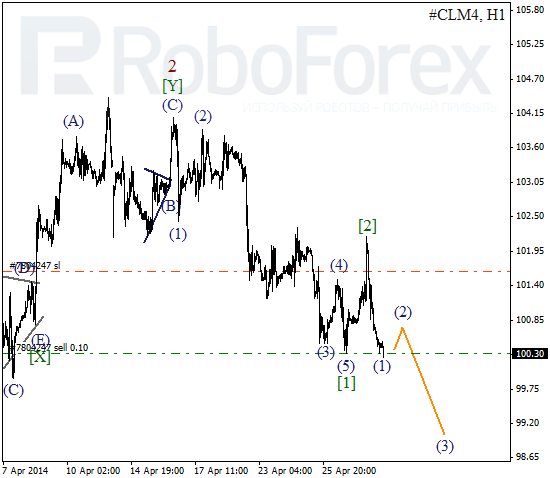
As we can see at the H1 chart, instrument finished descending impulse inside wave [1]. Yesterday market completed correction and then bears formed initial impulse inside wave (1). After a short pause, instrument is expected to continue falling down inside the third wave.
RoboForex Analytical Department
Attention!
Forecasts presented in this section only reflect the author’s private opinion and should not be considered as guidance for trading. RoboForex bears no responsibility for trading results based on trading recommendations described in these analytical reviews.