Wave Analysis 03.09.2013 (DJIA Index, Crude Oil)
03.09.2013
Analysis for September 3rd, 2013
DJIA Index
After completing a descending impulse inside wave [A], the market started a correction. Wave [B] is unlikely to be very long. Most likely, in the nearest future the instrument will start an initial descending impulse.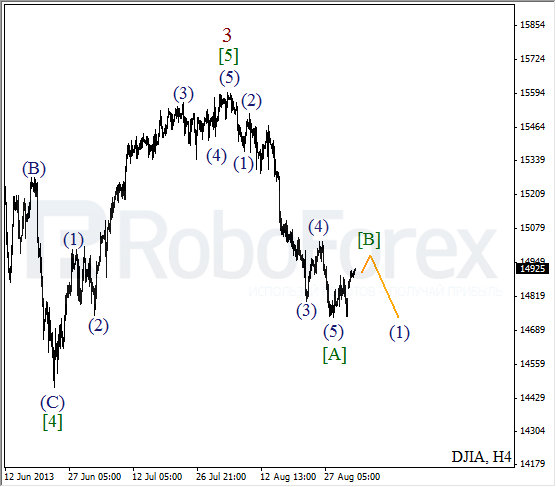
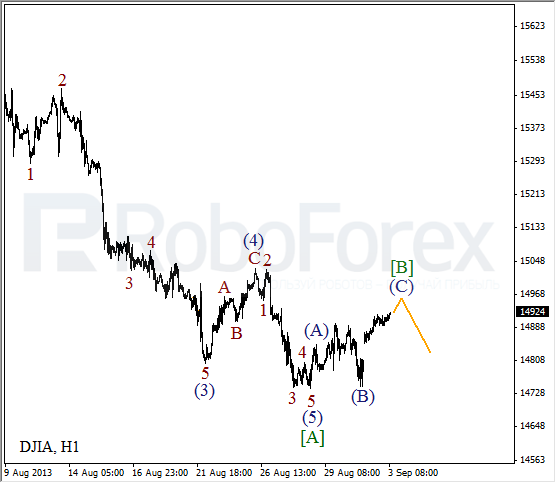
As we can see at the H1 chart, wave [B] is taking the form of zigzag pattern. On the minor wave level, the price is forming an impulse inside wave (C). The instrument may make a reverse during the next several days.
Crude Oil
It looks like Oil formed wave (4) in the form of skewed triangle pattern. The market rebounded from the pattern’s lower border. We may assume that the price is forming an initial impulse inside wave 1 and may continue growing up for a while.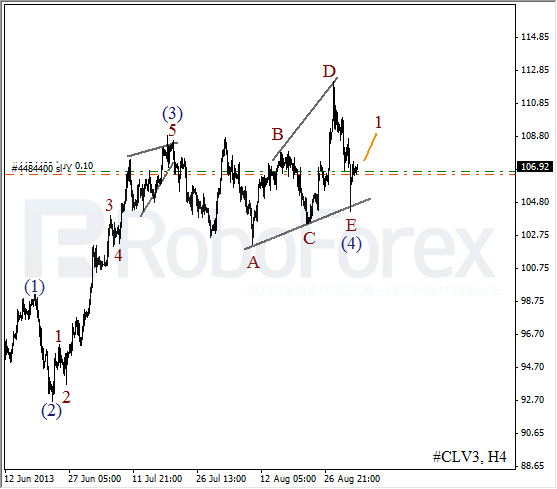
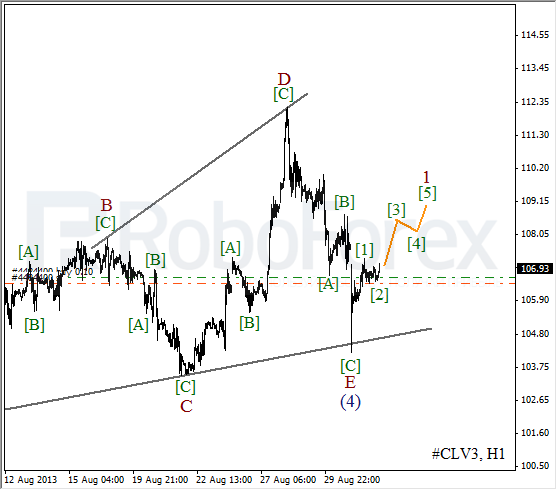
More detailed wave structure is shown on the H1 chart. Wave E took the form of zigzag pattern and then the price formed an impulse inside wave [1]. During a correction, I opened a buy order. The instrument is expected to move upwards inside the third wave during the day.
RoboForex Analytical Department
Attention!
Forecasts presented in this section only reflect the author’s private opinion and should not be considered as guidance for trading. RoboForex bears no responsibility for trading results based on trading recommendations described in these analytical reviews.