Wave Analysis 25.09.2013 (DJIA Index, Crude Oil)
25.09.2013
Analysis for September 25th, 2013
DJIA Index
The Index continues forming diagonal triangle pattern inside wave [5]. On the minor wave level, the price is forming the fourth wave. Most likely, in the future the instrument will complete a local correction and (if the market rebounds from the pattern’s lower border) start moving upwards inside wave (5) of [5].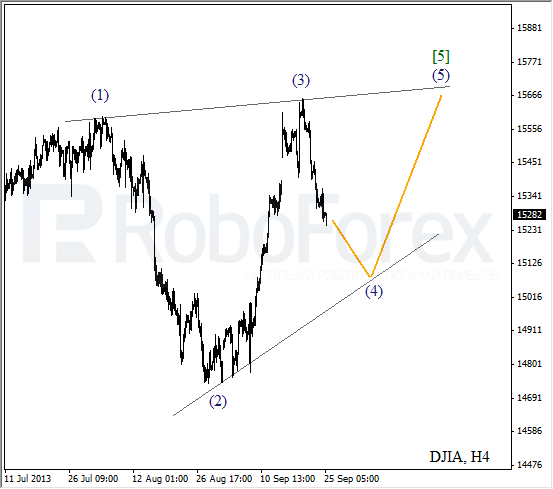
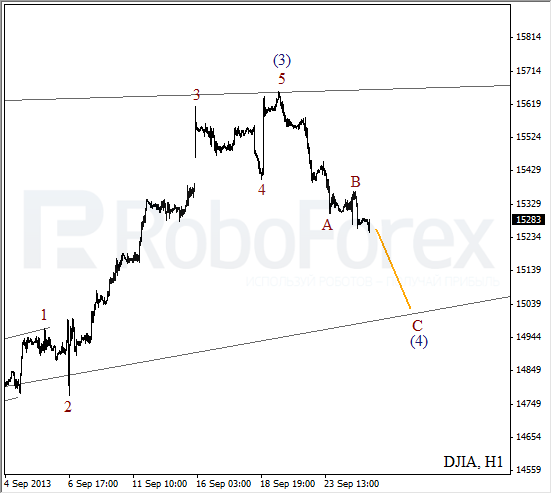
More detailed wave structure is shown on the H1 chart. It looks like the price is forming wave (4) in the form of zigzag pattern with a descending wave C inside it. In the near term, the Index is expected to continue moving downwards.
Crude Oil
Oil is still forming a sideways correction; there is a possibility that the price is forming double three pattern inside wave (4). During the next several days, the instrument may break the minimum once again and then form an initial impulse. Only after that, I’ll consider opening a buy order.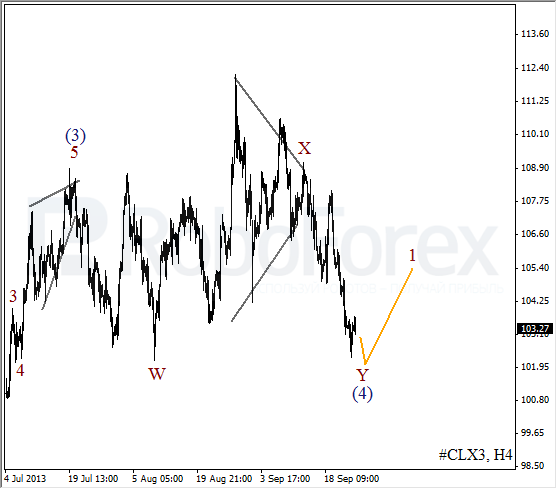
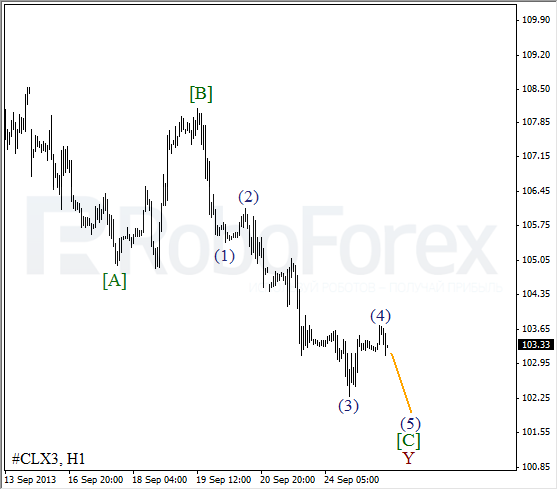
As we can see at the H1 chart, the price is finishing the fourth wave inside wave [C]. We can’t exclude a possibility that the instrument has already completed an initial descending impulse inside the fifth wave. If this assumption is correct, then the price may break the minimum of wave (3) quite soon.
RoboForex Analytical Department
Attention!
Forecasts presented in this section only reflect the author’s private opinion and should not be considered as guidance for trading. RoboForex bears no responsibility for trading results based on trading recommendations described in these analytical reviews.