Wave Analysis 16.11.2012 (DJIA Index, Crude Oil)
16.11.2012
Analysis for November 16th, 2012
DJIA Index
After completing wedge pattern inside wave [1] and forming a short second wave, the Index finished a descending impulse inside wave (1). Later during the day the instrument may start a local correction, but after it we can expect the price to start a descending movement inside wave (3) of [3].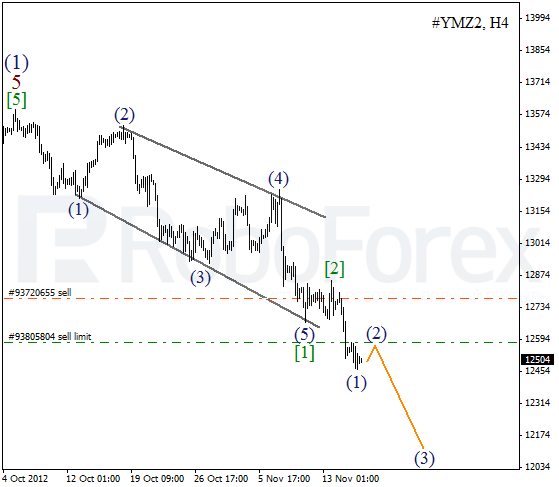
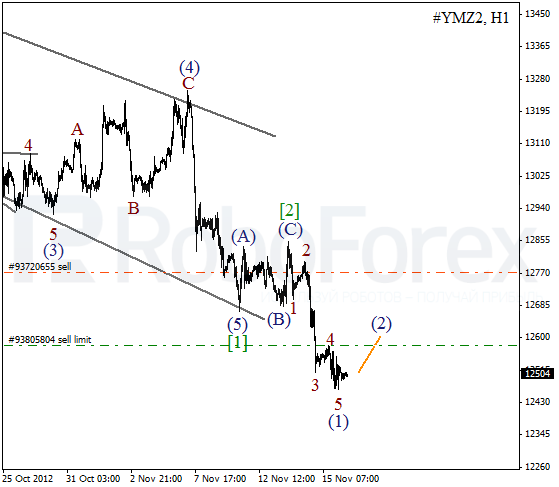
More detailed wave structure is shown on the H1 chart. Yesterday the Index formed a bearish wave 5 of (1). Most likely, there will be a slight pullback during the day, during which I’m planning to open another sell limit order. The price is expected to start a new descending movement in the beginning of the next week.
Crude Oil
Since the beginning of September Oil has been forming a descending wedge pattern inside wave (1). We may assume that yesterday the instrument completed wave (2). If the price is really starting to form wave (3), then during the next several month Oil may fall down significantly and reach the level of $70 per barrel of Light Sweet.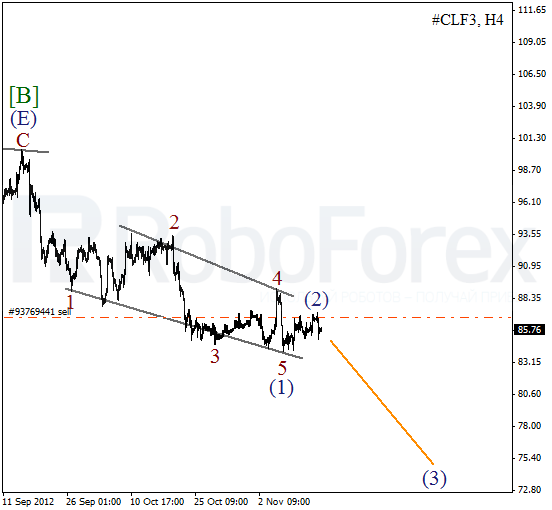
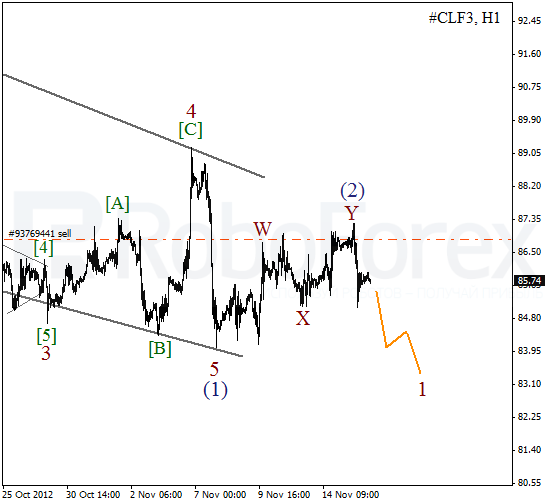
As we can see at the H1 chart, wave (2) took the form of double three pattern. On the minor wave level the price is forming an initial descending impulse inside wave 1. We can’t exclude a possibility that the instrument may break a local minimum during the day.
RoboForex Analytical Department
Attention!
Forecasts presented in this section only reflect the author’s private opinion and should not be considered as guidance for trading. RoboForex bears no responsibility for trading results based on trading recommendations described in these analytical reviews.