Wave Analysis 24.01.2017 (EUR/USD, GBP/USD, USD/JPY, AUD/USD)
EUR USD, “Euro vs US Dollar”
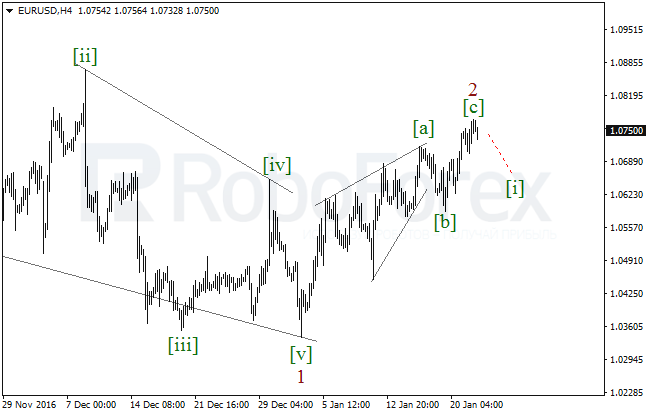
Probably, after completing the descending wedge in the wave 1, the EUR/USD pair finished the correctional wave 2 in the form of the zigzag. Consequently, in the nearest future the market may resume falling and form the impulse in the wave [i].
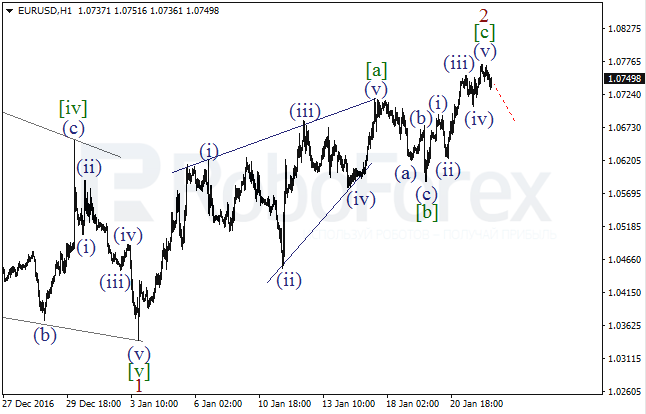
As we can see at the H1 chart, after finishing the zigzag in the wave [b] earlier, yesterday the pair completed the ascending impulse in the wave [c] of 2. As a result, in the nearest future the price may resume moving downwards and form the bearish impulse.
GBP USD, “Great Britain Pound vs US Dollar”
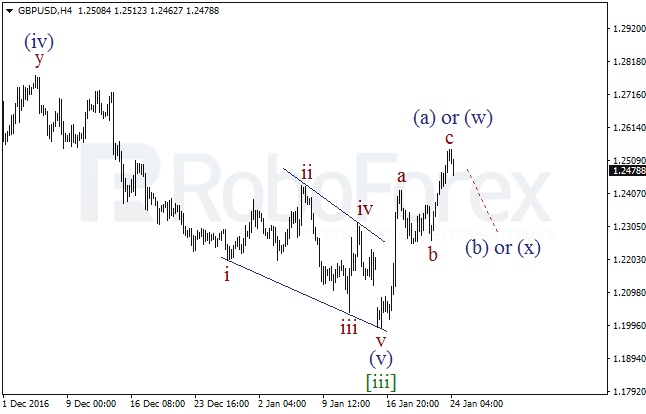
It’s highly likely that the GBP/USD pair formed the ascending zigzag in the wave (a) or (w), which may start the long correctional wave [iv]. However, in the nearest future the market may form the descending correction in the wave (b) or (x).
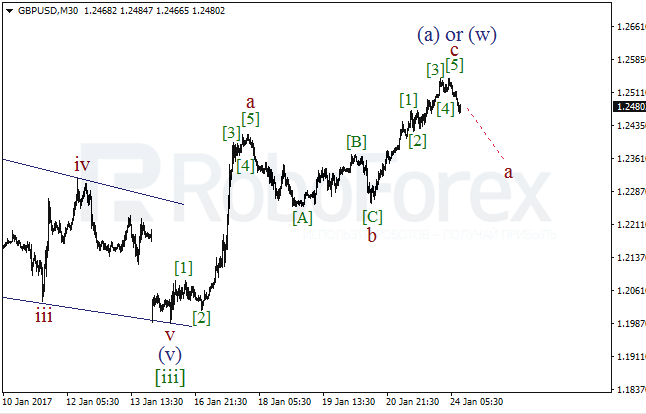
As we can see at the M30 chart, the price finished the impulse in the wave c and, as a result, completed the zigzag in the wave (a) or (w). Consequently, in the nearest future the price may form the descending impulse in the wave a.
USD JPY, “US Dollar vs Japanese Yen”
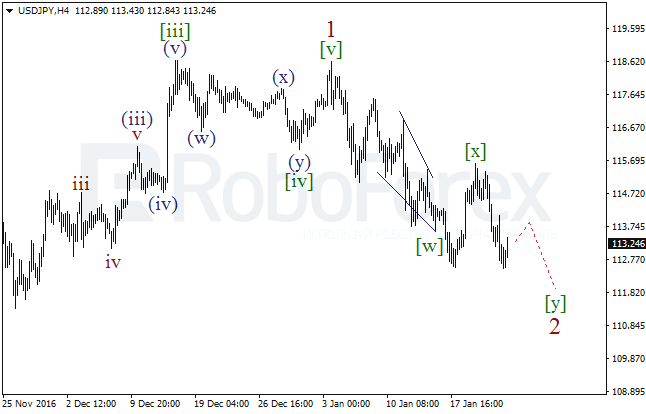
The USD/JPY pair reached a new low, which means that the correction continues. It looks like the wave 2 is taking the form of the double zigzag. As a result, during the next several days the market may form another zigzag in the wave [y].
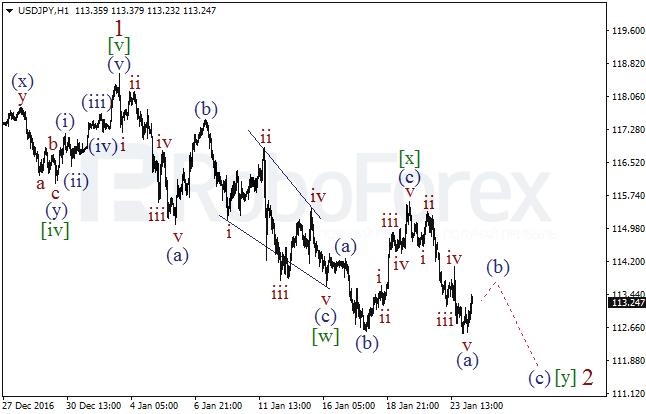
More detailed structure is shown on the H1 chart. After finishing the wave [x] in the form of the flat with the impulse (c) inside it, the pair formed the bearish wave (a). Consequently, in the nearest future the market is expected to complete the local correction and form another impulse in the wave (c) of [y] of 2.
AUD USD, “Australian Dollar vs US Dollar”
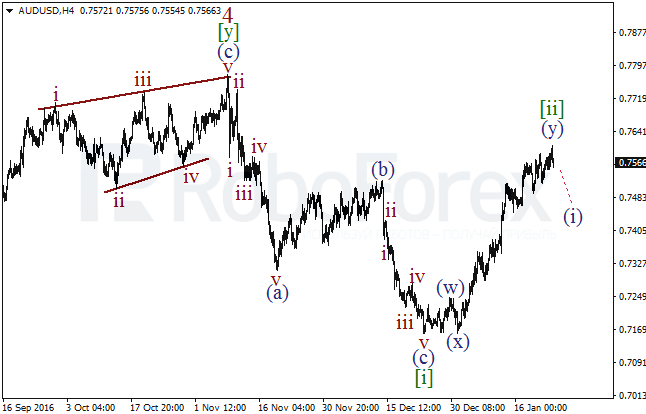
Possibly, the wave 5 is taking the form of the diagonal triangle with the zigzag[i] inside it. It looks like the wave [ii] took the form of the double zigzag. However, to confirm the wave [iii], the price has to form the descending impulse in the wave (i).
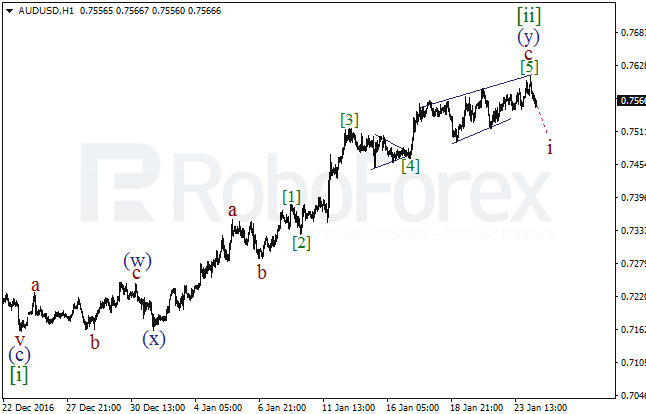
At the H1 chart, the pair completed the diagonal triangle in the wave [5] of c and then rebounded from its upside border. As a result, on Tuesday the market may start forming the descending impulse in the wave i.
RoboForex Analytical Department
Forecasts presented in this section only reflect the author’s private opinion and should not be considered as guidance for trading. RoboForex bears no responsibility for trading results based on trading recommendations described in these analytical reviews.