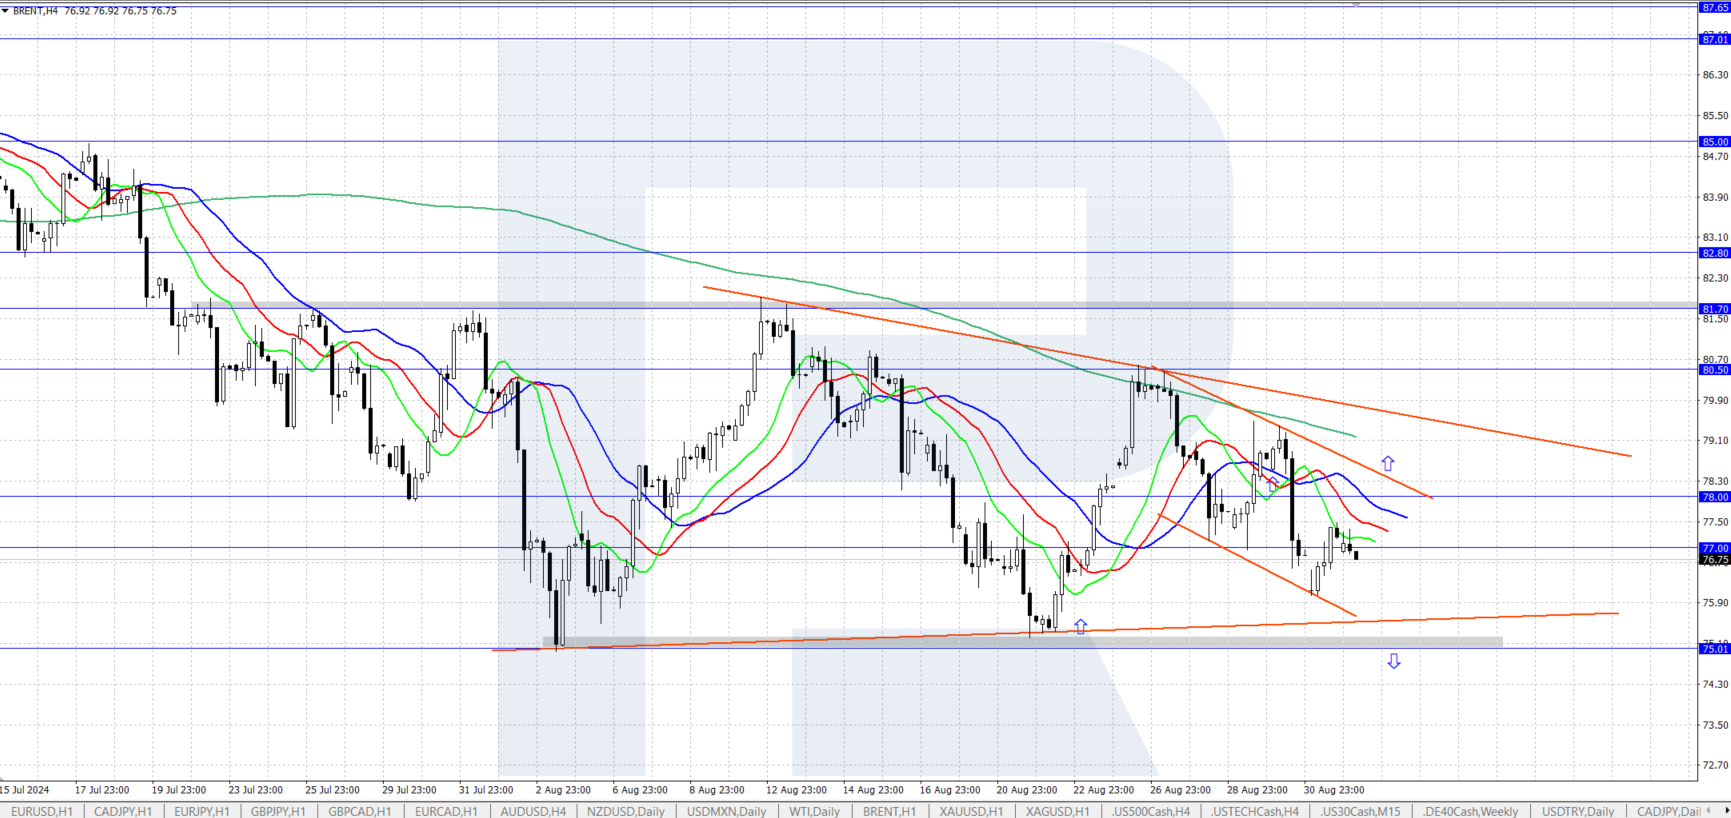
Brent is trading just below 77.00 USD, consolidating in a sideways range
Brent’s price is moving within a broad sideways range while a triangle pattern is forming on the chart. As we move through 3 September 2024, market participants are closely watching for key signals that may influence the price direction in the coming days. This Brent analysis provides a detailed outlook, incorporating the latest news and data-driven predictions.
Brent forecast: key trading points
- US data: the market is highly anticipatory of the upcoming US oil stock reports from the American Petroleum Institute (API) and the Energy Information Administration (EIA). Additionally, this week’s US employment data, including ADP employment figures and nonfarm payrolls, could serve as significant signals that impact Brent's price movements
- Current trend: the Brent price is consolidating within a wide sideways range, and a triangle pattern is emerging on the chart, offering a critical signal for future price action
- Brent forecast for 3 September 2024: the key levels to watch are 80.50 USD on the upside and 75.00 USD on the downside
Fundamental Analysis: news impact on brent price outlook
Brent crude oil quotes have halted their decline as part of a downward correction and are now trading within a broad sideways range. Market participants await this week’s release of US oil inventory data from the American Petroleum Institute (API) and the Energy Information Administration (EIA).
The market will also focus on US employment market statistics, with the ADP employment data due on Thursday, nonfarm payrolls, and the unemployment rate scheduled for release on Friday. Employment figures may affect Brent prices: robust statistics will contribute to strengthening, while a decline will exert pressure on the price.
Brent technical analysis
Currently, Brent is hovering just below 77.00 USD. On the H4 chart, the price is confined within a wide sideways range between 75.00 and 80.50 USD, with a triangle pattern gradually forming. This pattern is a crucial signal that traders are watching closely. The prediction for Brent's next move hinges on whether it breaks out of this pattern.
- Bullish scenario: the short-term Brent price forecast suggests that if bulls push the price above the upper boundary of the triangle and the 80.50 level, this will open the way towards 85.00
- Bearish scenario: if bears push the price below the triangle’s lower line and the 75.00 USD support level, it could fall further to 70.00
Summary
Oil prices are currently trading within a broad sideways range between 75.00 and 80.50 USD. The upcoming API and EIA oil stock data, along with US employment statistics, are likely to provide crucial signals that will influence Brent's price direction. Traders should closely monitor these key levels and news events to gauge potential breakout points and make informed predictions for Brent's future movements.
Forecasts presented in this section only reflect the author’s private opinion and should not be considered as guidance for trading. RoboForex bears no responsibility for trading results based on trading recommendations described in these analytical reviews.


