Brent forms a reversal at key resistance
Brent quotes are showing signs of a reversal amid technical signals and negative US oil inventory data, currently trading at 69.08 USD. Find more details in our analysis for 12 February 2026.
Brent forecast: key takeaways
- US gasoline inventories also increased contrary to forecasts
- Tensions between the US and Iran persist
- Investors continue to factor in military risks
- Brent forecast for 12 February 2026: 70.00
Fundamental analysis
Brent oil prices are declining after rebounding from the key resistance level of 71.05 USD. Buyers have failed for the second time to gain a foothold above this level, increasing the risk of a Double Top reversal pattern forming on the daily chart.
Market pressure intensified following the EIA report. US crude oil stocks unexpectedly rose by 8.53 million barrels over the week, acting as a strong bearish factor for prices. Gasoline inventories also increased despite forecasts for a decline. The increase in inventories was largely due to a recovery in production after a sharp drop the previous week caused by severe weather in the US. After the data release, oil prices accelerated their corrective pullback from weekly highs but later partially recovered losses.
At the same time, the geopolitical factor continues to provide potential support to the market. Tensions between the US and Iran persist despite statements by President Donald Trump about seeking an agreement with Tehran following regional talks with Israeli Prime Minister Benjamin Netanyahu. Investors continue to factor in the risk of potential military scenarios and supply disruptions, which is holding back a deeper bearish correction.
Technical outlook
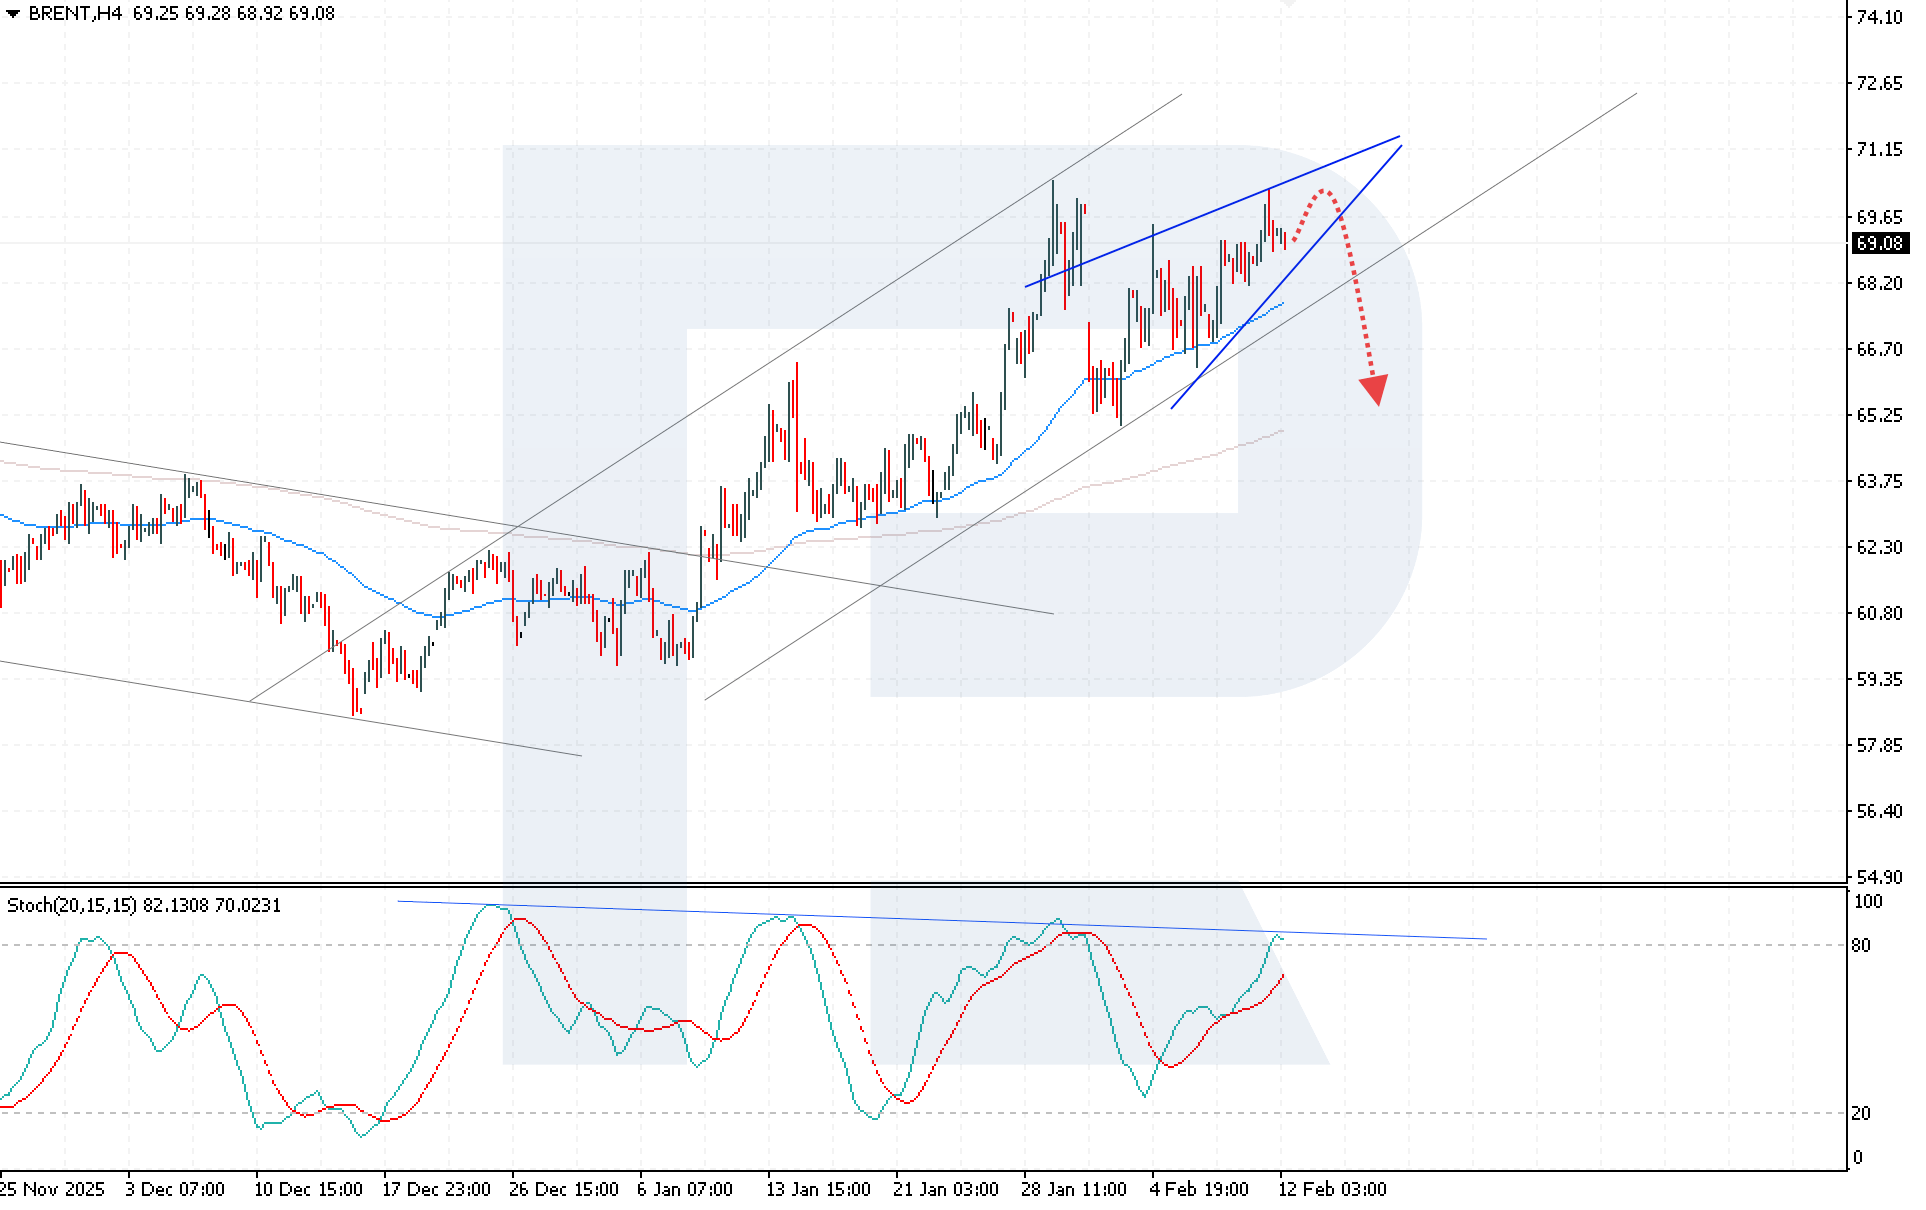
Brent quotes are correcting within a developing Wedge reversal pattern. Although prices remain above the EMA-65, the risks of further downside movement remain high.
Today’s Brent forecast suggests a possible rebound from the 69.70 resistance level, followed by a decline towards a potential target at 65.25. The Stochastic Oscillator further confirms the bearish scenario. Its signal lines have nearly reached overbought territory and the resistance line, from which the market has already reversed three times, increasing the probability of another pullback.
The key technical condition for the downside scenario is a consolidation below 68.20. A breakout of this level would indicate a move below the lower boundary of the Wedge pattern and confirm the reversal setup with downside targets.
Brent overview
- Asset: Brent
- Timeframe: H4 (Intraday)
- Trend: moderately bullish
- Key resistance levels: 69.70 and 71.05
- Key support levels: 68.20 and 65.25
Brent trading scenarios for today
Main scenario (Sell Stop)
The Brent chart still shows risks of a reversal pattern forming despite the overall upward momentum. A breakout below the lower boundary of the Wedge with consolidation under 68.20 will create conditions for short positions, with a downside target at 65.25.
The risk-to-reward ratio exceeds 1:2.
- Take Profit: 65.25 USD
- Stop Loss: 69.65 USD
Alternative scenario (Buy Stop)
If geopolitical tensions between the US and Iran ease, prices may consolidate above the local resistance level at 71.05, strengthening buying pressure and creating conditions for a new bullish impulse.
- Take Profit: 74.05 USD
- Stop Loss: 69.05 USD
Risk factors
The main risk to further downside in Brent prices remains a potential easing of geopolitical tensions between the US and Iran, which could reduce the risk premium related to possible supply disruptions.
Summary
The technical and fundamental outlook for Brent highlights reversal risks amid a Double Top pattern and rising US inventories, while geopolitical tensions are merely holding back a deep correction and maintaining elevated volatility. Brent technical analysis indicates a high probability of a sustained downward move if prices consolidate below 68.20, with a downside target around 65.25.
Editors’ picks
 EURUSD 2026-2027 forecast: key market trends and future predictions
This article provides the EURUSD forecast for 2026 and 2027 and highlights the main factors determining the direction of the pair’s movements. We will apply technical analysis, take into account the opinions of leading experts, large banks, and financial institutions, and study AI-based forecasts. This comprehensive insight into EURUSD predictions should help investors and traders make informed decisions.
 Gold (XAUUSD) forecast 2026 and beyond: expert insights, price predictions, and analysis
Dive deep into the Gold (XAUUSD) price outlook for 2026 and beyond, combining technical analysis, expert forecasts, and key macroeconomic factors. It explains the drivers behind gold’s recent surge, explores potential scenarios including a move toward 4,500 to 5,000 USD per ounce, and highlights why the metal remains a strong hedge during global uncertainty.
Forecasts presented in this section only reflect the author’s private opinion and should not be considered as guidance for trading. RoboForex bears no responsibility for trading results based on trading recommendations described in these analytical reviews.