XAUUSD supported by steady demand from central banks
XAUUSD prices remain in a steady growth phase amid easing expectations for Federal Reserve policy and weak US macroeconomic data, currently standing at 5,055 USD. Find more details in our analysis for 11 February 2026.
XAUUSD forecast: key takeaways
- Statistics indicate a slowdown in US consumer spending
- The People’s Bank of China has been buying gold for 15 consecutive months
- Central banks increased gold purchases in Q4 2025
- XAUUSD forecast for 11 February 2026: 5,305
Fundamental analysis
XAUUSD quotes continue to rise; however, sellers are restraining the movement below the key resistance level of 5,095. Prices are hovering near two-week highs amid expectations of a more accommodative monetary policy from the Federal Reserve.
Weak US macroeconomic data reinforces these expectations. Retail sales in December remained unchanged from the previous month, while a 0.4% increase had been expected. Sales excluding the automotive sector also remained flat, although the market had anticipated a 0.3% rise. These figures point to a slowdown in consumer activity and create risks of weaker economic growth in the US.
Gold continues to receive fundamental support from robust central bank demand. The People’s Bank of China has been increasing its gold reserves for 15 consecutive months. In Q4 2025, global central banks, remaining key market participants, significantly boosted gold purchases, strengthening the long-term bullish foundation for the precious metal.
Technical outlook
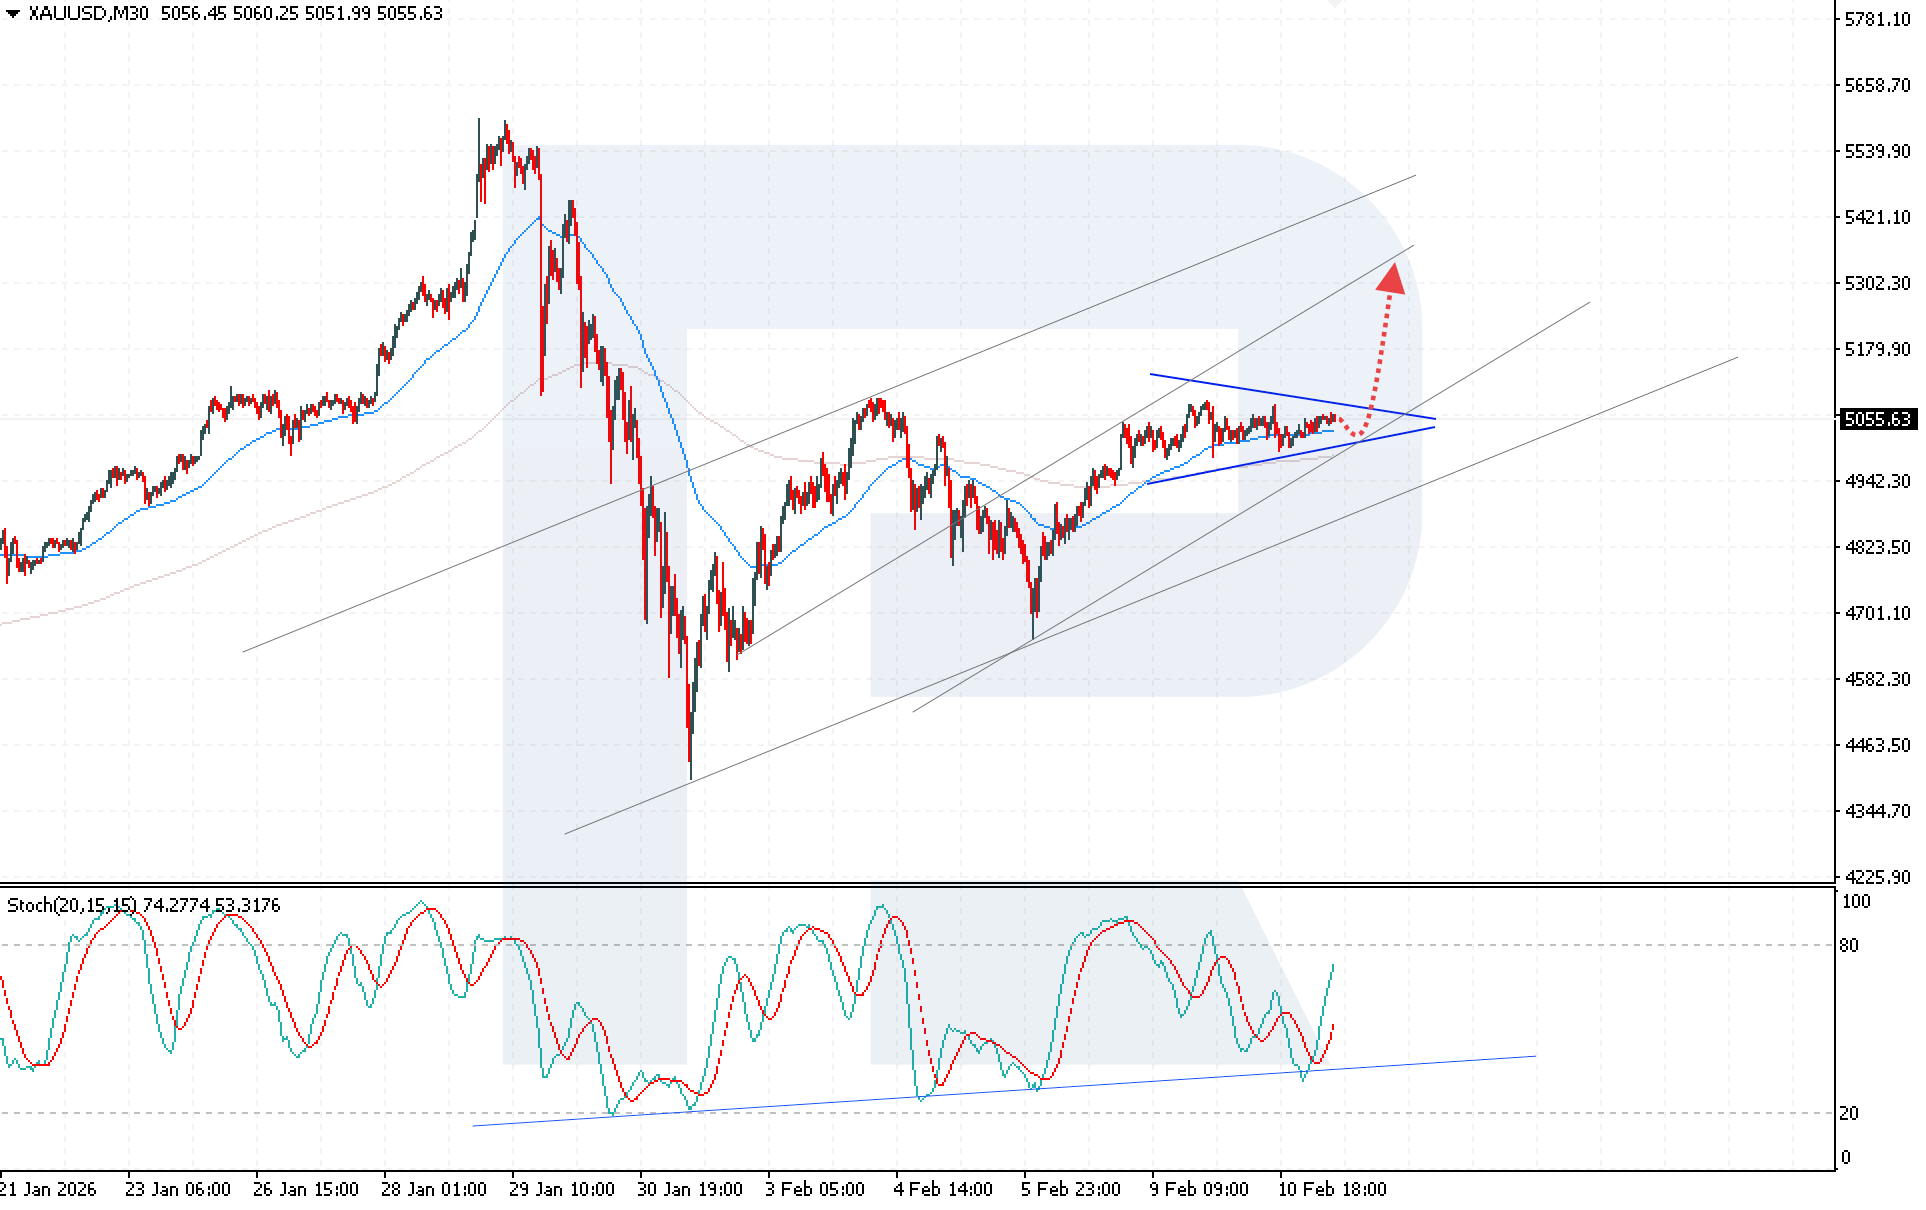
XAUUSD quotes are undergoing a correction within a Triangle pattern while remaining above the EMA-65, indicating that the medium-term bullish structure is intact. To develop a full-fledged upward momentum, buyers need to gain a foothold above the key resistance level of 5,095. The XAUUSD forecast for today suggests continued growth after a rebound from the lower boundary of the bullish channel, targeting the 5,305 area. The current correction is technical and does not disrupt the overall uptrend.
The Stochastic Oscillator further confirms the bullish scenario. The signal lines have rebounded from the support line and formed a bullish crossover, increasing the probability of renewed upward momentum in the short term. A key technical condition for the upside scenario remains consolidation above the upper boundary of the Triangle pattern, which would indicate pattern completion with targets significantly above current levels.
XAUUSD overview
- Asset: XAUUSD
- Timeframe: M30 (Intraday)
- Trend: ьoderately bullish
- Key resistance levels: 5,095 and 5,175
- Key support levels: 4,965 and 4,825
XAUUSD trading scenarios for today
Main scenario (Buy Stop)
Consolidation above 5,105 will confirm a breakout above the upper boundary of the Triangle pattern and create technical conditions for opening long positions. Further movement may be impulsive, which is typical after the price breaks out of a consolidation pattern. The risk-to-reward ratio exceeds 1:3. The potential profit upon reaching the take-profit level is around 20,000 pips, with possible losses capped at 6,000 pips.
- Take Profit: 5,305 USD
- Stop Loss: 5,045 USD
Alternative scenario (Sell Stop)
A breakout below the lower boundary of the Triangle pattern with consolidation below 5,005 will indicate increased selling pressure and confirm pattern realization with targets shifting to the downside.
- Take Profit: 4,705 USD
- Stop Loss: 5,055 USD
Risk factors
The main risk to continued growth is the failure of XAUUSD quotes to consolidate above the 5,095–5,105 resistance zone, which could trigger a deeper correction. If prices break below the lower boundary of the Triangle pattern, a new downward impulse may form, shifting the market into a bearish phase.
Summary
The combination of weak US macroeconomic data, expectations of Federal Reserve policy easing, and steady demand from central banks forms a strong bullish foundation for XAUUSD. The market structure remains upward, and consolidation above the 5,095–5,105 zone will be the key trigger for a momentum rally towards 5,305 and beyond.
Editors’ picks
 EURUSD 2026-2027 forecast: key market trends and future predictions
This article provides the EURUSD forecast for 2026 and 2027 and highlights the main factors determining the direction of the pair’s movements. We will apply technical analysis, take into account the opinions of leading experts, large banks, and financial institutions, and study AI-based forecasts. This comprehensive insight into EURUSD predictions should help investors and traders make informed decisions.
 Gold (XAUUSD) forecast 2026 and beyond: expert insights, price predictions, and analysis
Dive deep into the Gold (XAUUSD) price outlook for 2026 and beyond, combining technical analysis, expert forecasts, and key macroeconomic factors. It explains the drivers behind gold’s recent surge, explores potential scenarios including a move toward 4,500 to 5,000 USD per ounce, and highlights why the metal remains a strong hedge during global uncertainty.
Forecasts presented in this section only reflect the author’s private opinion and should not be considered as guidance for trading. RoboForex bears no responsibility for trading results based on trading recommendations described in these analytical reviews.