Gold (XAUUSD) weekly forecast: extreme volatility as the new normal
Gold (XAUUSD) enters the week of 9–13 February in a phase of heightened volatility following a sharp correction from all-time highs. Prices are stabilising around 4,900 USD per ounce, balancing between support from geopolitical uncertainty and demand for safe-haven assets and pressure from more hawkish Fed signals and US dollar strength.
Investor focus is on Fed officials’ rhetoric, dollar dynamics, and whether the correction following the extreme moves of late January has ended. These factors will determine whether the market transitions to consolidation and recovery, or whether selling pressure on gold persists in the coming days.
XAUUSD forecast for this week: quick overview
- Weekly performance: gold (XAUUSD) ended the week at 4,930 USD per ounce after sharp volatility. Pressure increased amid US dollar gains, more cautious Fed signals, and the nomination of Kevin Warsh as Federal Reserve chairman – a development viewed as a hawkish shift by markets. Before this, gold surged over 6%, the strongest intraday rise since 2008, driven by aggressive dip-buying after collapsing from record highs
- Support and resistance: the long-term uptrend remains intact, but the market has shifted into a redistribution phase. After peaking around 5,600, gold saw a momentum-driven pullback. Prices are now consolidating in the 4,860–4,900 zone, which acts as immediate resistance. Volatility remains high, and technical indicators show weakening momentum
- Fundamentals and outlook: US macroeconomic data delivered mixed signals, while geopolitical risks persist. The baseline scenario for the week is range-bound consolidation with potential recovery attempts towards 4,900–5,000, although downside risks remain if the correction continues
Gold (XAUUSD) fundamental analysis
Gold (XAUUSD) finished the week at 4,930 USD per ounce, following a two-day rebound amid US dollar strength and more cautious Fed commentary. Downward pressure on gold intensified after Fed officials emphasised inflation risks and indicated less willingness to ease policy quickly. Another catalyst was the nomination of Kevin Warsh as Fed chair, which the market interpreted as a sign of a more hawkish policy path and a slower pace of rate cuts.
US macroeconomic data presented a mixed picture. The ADP report pointed to weak private-sector job growth, while the ISM services index exceeded expectations, confirming resilient business activity. The geopolitical backdrop remained tense. Despite planned US–Iran talks in Oman, escalation risks have not been fully removed.
The week was extremely volatile. At the start of the period, gold prices soared over 6%, marking the largest intraday surge since 2008, driven by strong buying interest following a sharp drop from all-time highs.
As a result, the market entered a high-volatility phase, where the balance between hawkish Fed rhetoric and safe-haven demand will determine further price action.
XAUUSD technical analysis
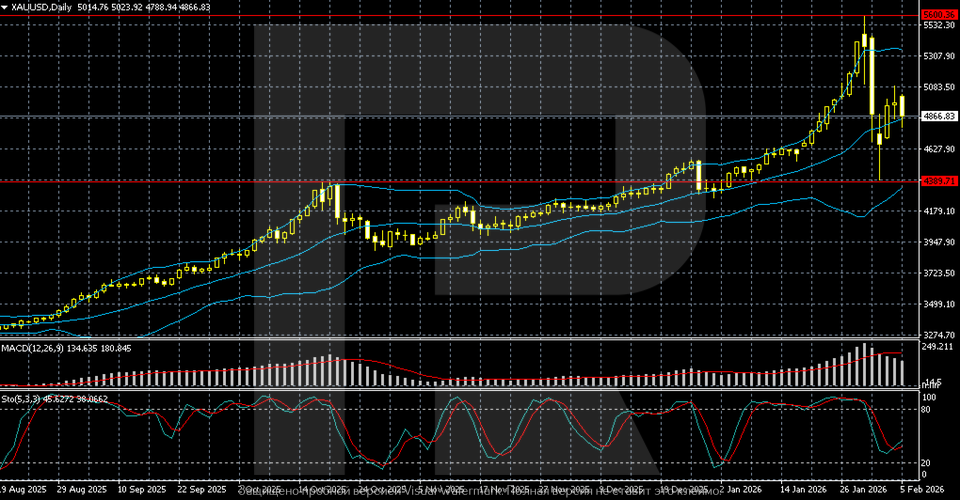
On the daily chart, gold (XAUUSD) maintains a long-term uptrend that started in August 2025. Prices had been trending steadily above the middle Bollinger Band, consistently making new highs, confirming buyer dominance.
In late January, the rally entered an extreme phase, with quotes accelerating sharply to a peak around 5,600, followed by a steep collapse. The drop was momentum-driven and saw prices fall below the middle Bollinger Band – a sign of a shift in market regime.
Gold is now recovering from the lows and trading near 4,860–4,900, around the area of previously broken support, which now acts as resistance. Volatility remains high. While MACD is still in positive territory, the histogram is shrinking, indicating a loss of medium-term momentum. The Stochastic Oscillator has exited oversold territory, supporting a short-term rebound, but this does not negate the risk of a continued correction.
The overall picture reflects a transition from a sustained uptrend to a high-volatility redistribution phase, as the market searches for a new equilibrium point.
XAUUSD trading scenarios
The fundamental backdrop for gold remains mixed. Gold (XAUUSD) closed the week near 4,930 USD per ounce after a period of extreme volatility. Selling pressure increased due to US dollar strength, more cautious signals from the Fed, and the nomination of Kevin Warsh as the next Federal Reserve chairman, perceived by markets as a hawkish shift in monetary policy. However, geopolitical uncertainty and demand for safe-haven assets continue to limit the depth of the correction.
From a technical perspective, the market has transitioned from a sustained uptrend to a redistribution phase. After peaking near 5,600, gold experienced a sharp reversal, with prices currently consolidating in the 4,860–4,900 range, which serves as immediate resistance. Volatility remains elevated: MACD is in positive territory, but momentum is weakening, while the Stochastic Oscillator supports a short-term rebound without confirming a trend resumption.
- Buy scenario
Local long positions may be considered if prices stabilise above 4,860–4,900, aiming for a corrective recovery.
- Sell scenario
A return below 4,860 will increase the risk of a further correction within the new volatile range.
Conclusion: the base case is consolidation within a wide range, with elevated volatility and the market seeking a new equilibrium.
Summary
Gold (XAUUSD) ended the week near 4,930 USD per ounce following a sharp correction from all-time highs. Price action was shaped by a stronger US dollar and hawkish Fed rhetoric, amplified by the nomination of Kevin Warsh as Fed chair. US macroeconomic data delivered mixed signals. Meanwhile, geopolitical uncertainty and safe-haven demand eased the pressure, preventing a deeper drop. The week saw extreme volatility.
From a technical perspective, the market has moved from a sustained uptrend into a phase of high volatility and redistribution. After peaking near 5,600, prices have pulled back and are now consolidating in the 4,860–4,900 area, which acts as the nearest resistance. The baseline scenario suggests range-bound consolidation, with elevated sensitivity to Fed signals and US dollar moves.
Editors’ picks
 EURUSD 2026-2027 forecast: key market trends and future predictions
This article provides the EURUSD forecast for 2026 and 2027 and highlights the main factors determining the direction of the pair’s movements. We will apply technical analysis, take into account the opinions of leading experts, large banks, and financial institutions, and study AI-based forecasts. This comprehensive insight into EURUSD predictions should help investors and traders make informed decisions.
 Gold (XAUUSD) forecast 2026 and beyond: expert insights, price predictions, and analysis
Dive deep into the Gold (XAUUSD) price outlook for 2026 and beyond, combining technical analysis, expert forecasts, and key macroeconomic factors. It explains the drivers behind gold’s recent surge, explores potential scenarios including a move toward 4,500 to 5,000 USD per ounce, and highlights why the metal remains a strong hedge during global uncertainty.
Forecasts presented in this section only reflect the author’s private opinion and should not be considered as guidance for trading. RoboForex bears no responsibility for trading results based on trading recommendations described in these analytical reviews.