EURUSD, USDJPY, GBPUSD, AUDUSD, USDCAD, XAUUSD, and Brent technical analysis and forecast for 5 February 2025
Here is a detailed daily technical analysis and forecast for EURUSD, USDJPY, GBPUSD, AUDUSD, USDCAD, XAUUSD, and Brent for 5 February 2025.
EURUSD forecast
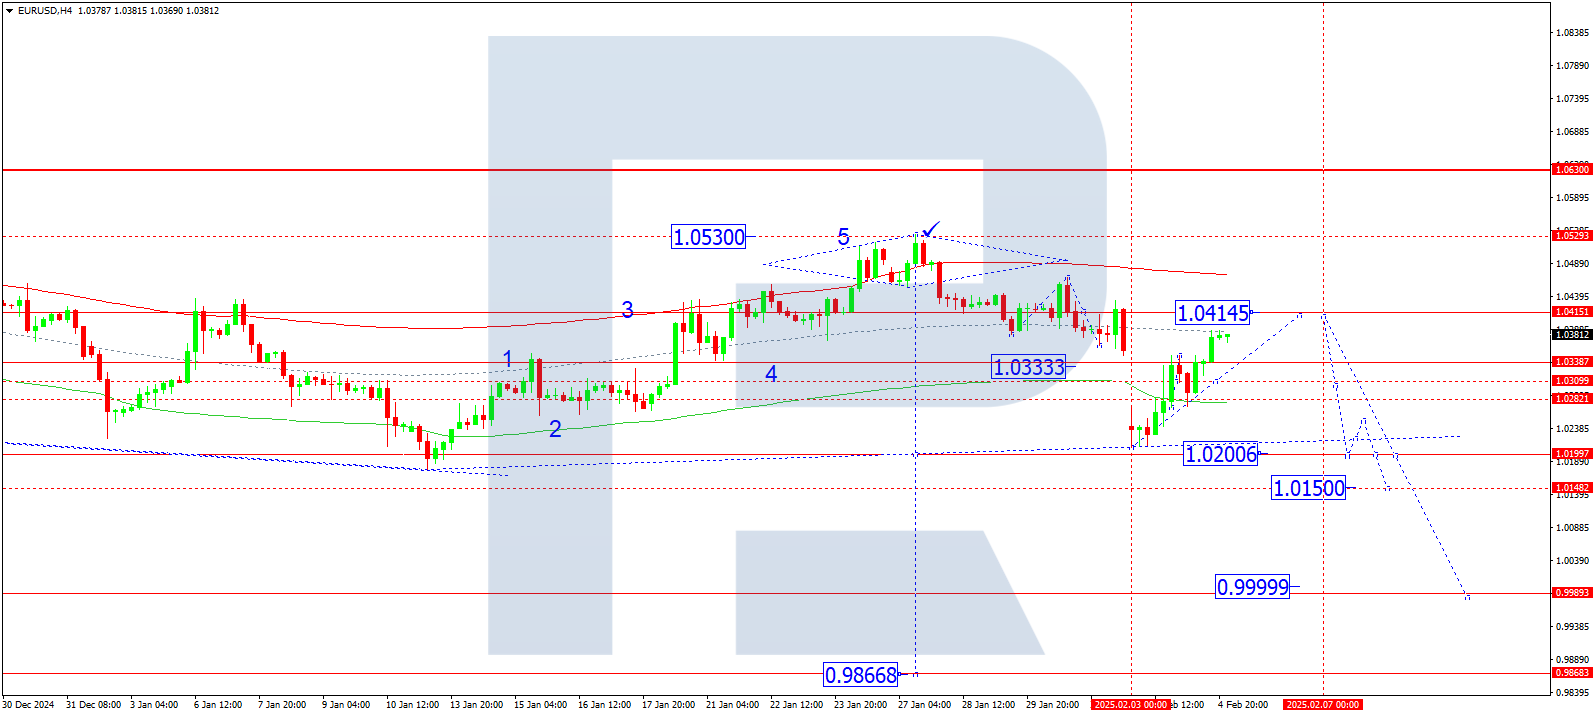
On the H4 chart, EURUSD formed a consolidation range around 1.0300. A breakout upwards suggests the possibility of further correction towards 1.0414. Today, 5 February 2025, the market is expected to reach this target. Once the correction is complete, a new downward wave towards 1.0200 is anticipated, with a further trend extension to 1.0150.
Technically, this scenario is supported by the Elliott wave structure and the growth wave matrix with a pivot point at 1.0300, which serves as a key level for EURUSD. Currently, the market continues moving towards the upper boundary of the price Envelope at 1.0414. Later, a potential downward move towards the lower boundary at 1.0200 may follow.
Technical indicators for today's EURUSD forecast suggest the probability of a decline towards 1.0200 and 1.0150.
USDJPY forecast
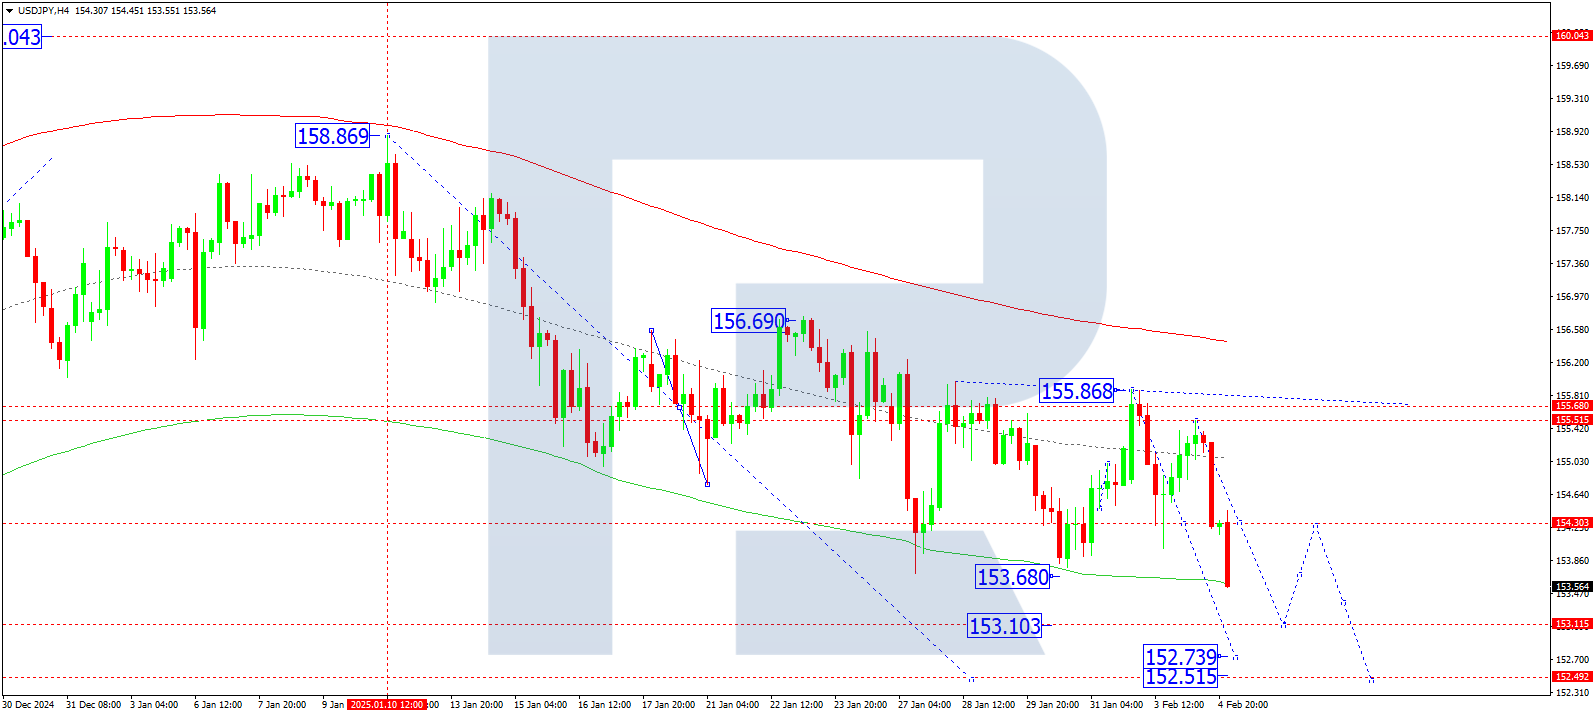
On the H4 chart, USDJPY completed a growth wave to 155.10, followed by a downward impulse to 154.30. Today, 5 February 2025, a narrow consolidation range has formed around this level. A breakout downwards would continue the downward wave towards 153.10. After reaching this level, a correction to 154.30 is possible, followed by further decline towards 152.52.
Technically, this scenario for USDJPY is supported by the Elliott wave structure and the downward wave matrix with a pivot point at 154.30. Currently, the market is consolidating around the central line of the price Envelope. A move towards the lower boundary at 153.10 is anticipated.
Technical indicators for today's USDJPY forecast suggest the possibility of a decline towards 153.10 and 152.52.
GBPUSD forecast
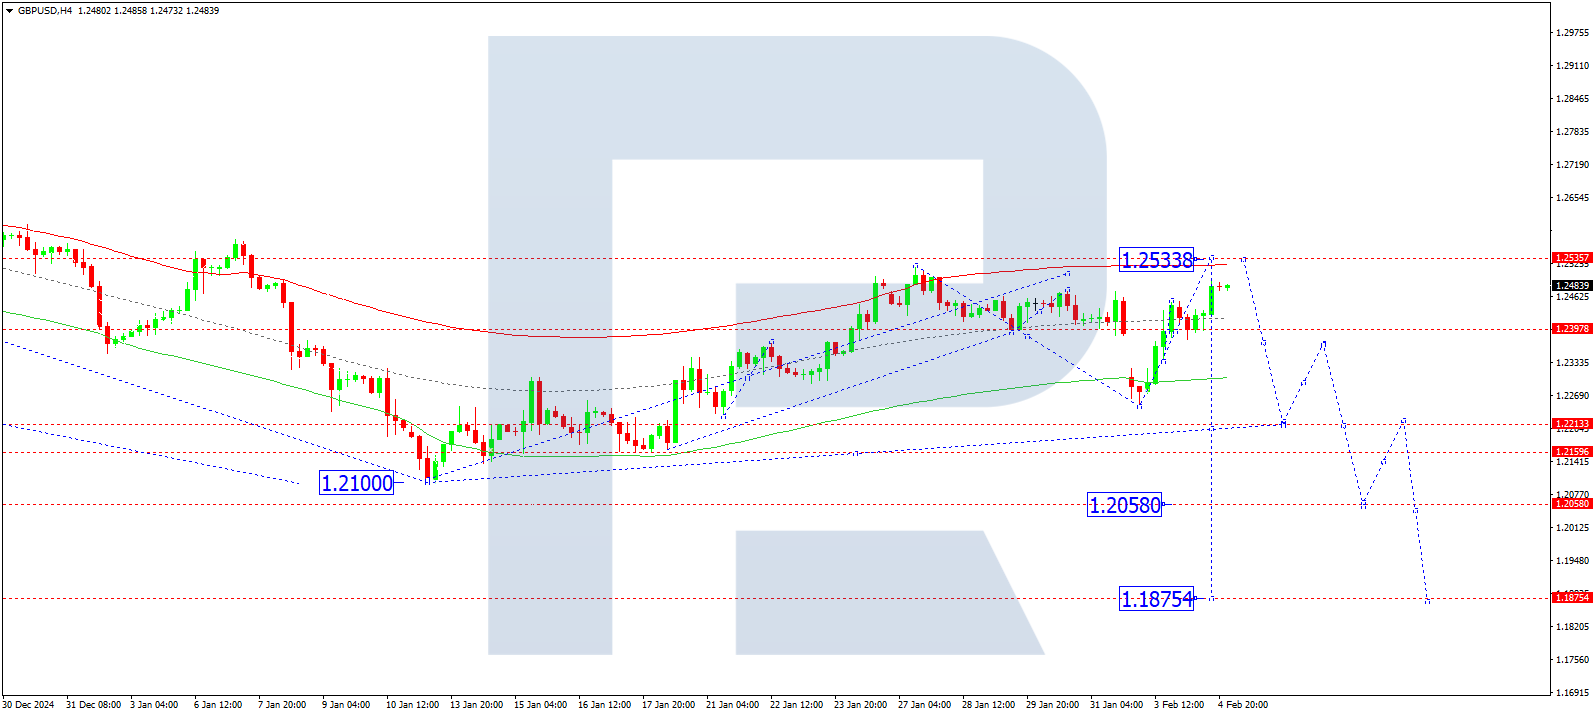
On the H4 chart, GBPUSD formed a consolidation range around 1.2390. A breakout upwards suggests the possibility of further correction towards 1.2533. Today, 5 February 2025, this target level is expected to be reached. Later, a potential downward wave towards 1.2220 may develop.
Technically, this scenario for GBPUSD is confirmed by the Elliott wave structure and the growth wave matrix with a pivot point at 1.2390. Currently, the market is consolidating around the central line of the price Envelope. A breakout upwards would continue the growth wave towards the upper boundary at 1.2533.
Technical indicators for today's GBPUSD forecast suggest the probability of an upward wave towards 1.2533.
AUDUSD forecast
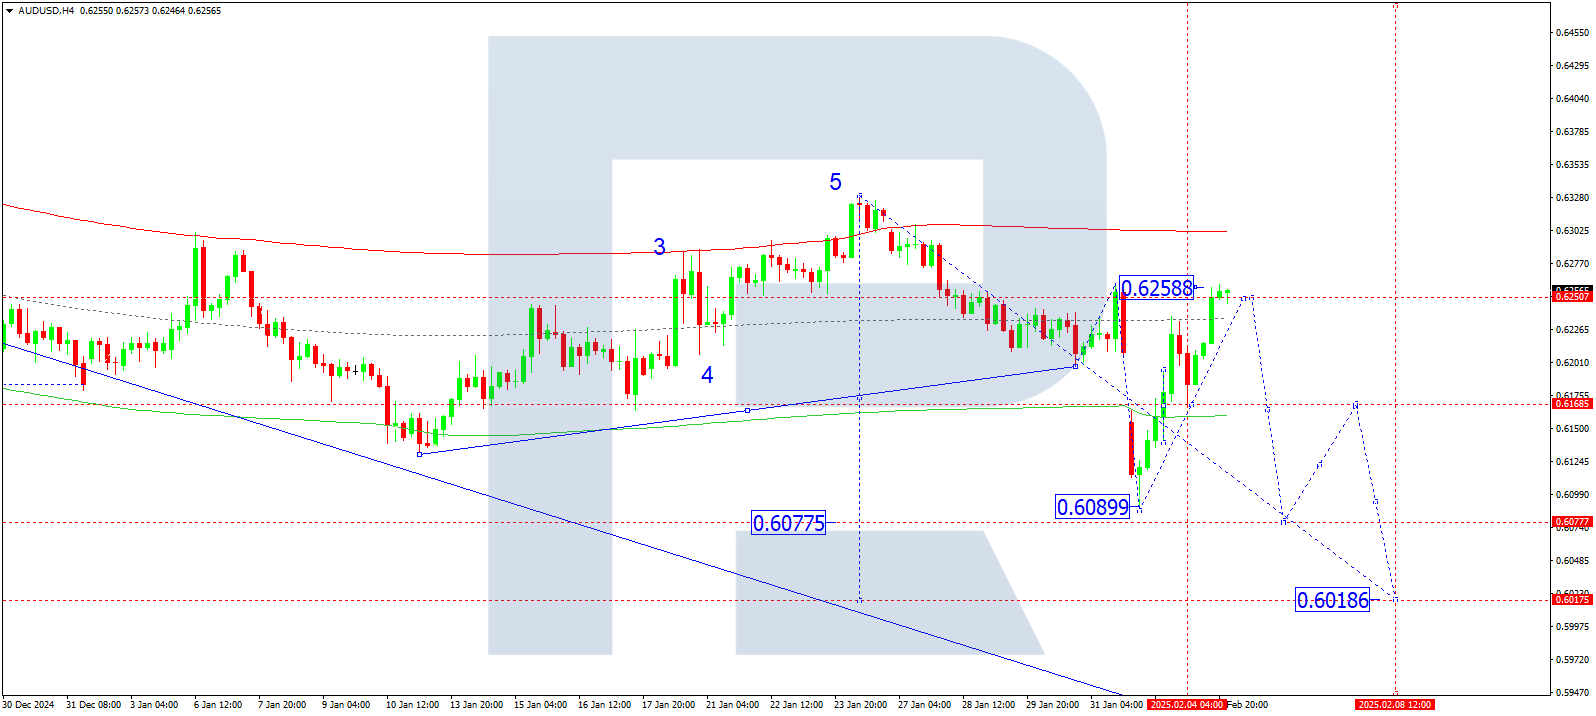
On the H4 chart, AUDUSD completed a correction wave to 0.6258. Today, 5 February 2025, a decline towards 0.6161 is expected. After reaching this level, a consolidation range may form. If the price breaks upwards, a correction to 0.6200 is possible. A downward breakout could extend the wave towards 0.6077.
Technically, this scenario is supported by the Elliott wave structure and the growth wave matrix for AUDUSD, with a pivot point at 0.6161. Currently, the market has risen towards the upper boundary of the price Envelope at 0.6258. Later, a downward move towards the lower boundary at 0.6077 is expected.
Technical indicators for today's AUDUSD forecast suggest the probability of a decline towards 0.6077 and 0.6018.
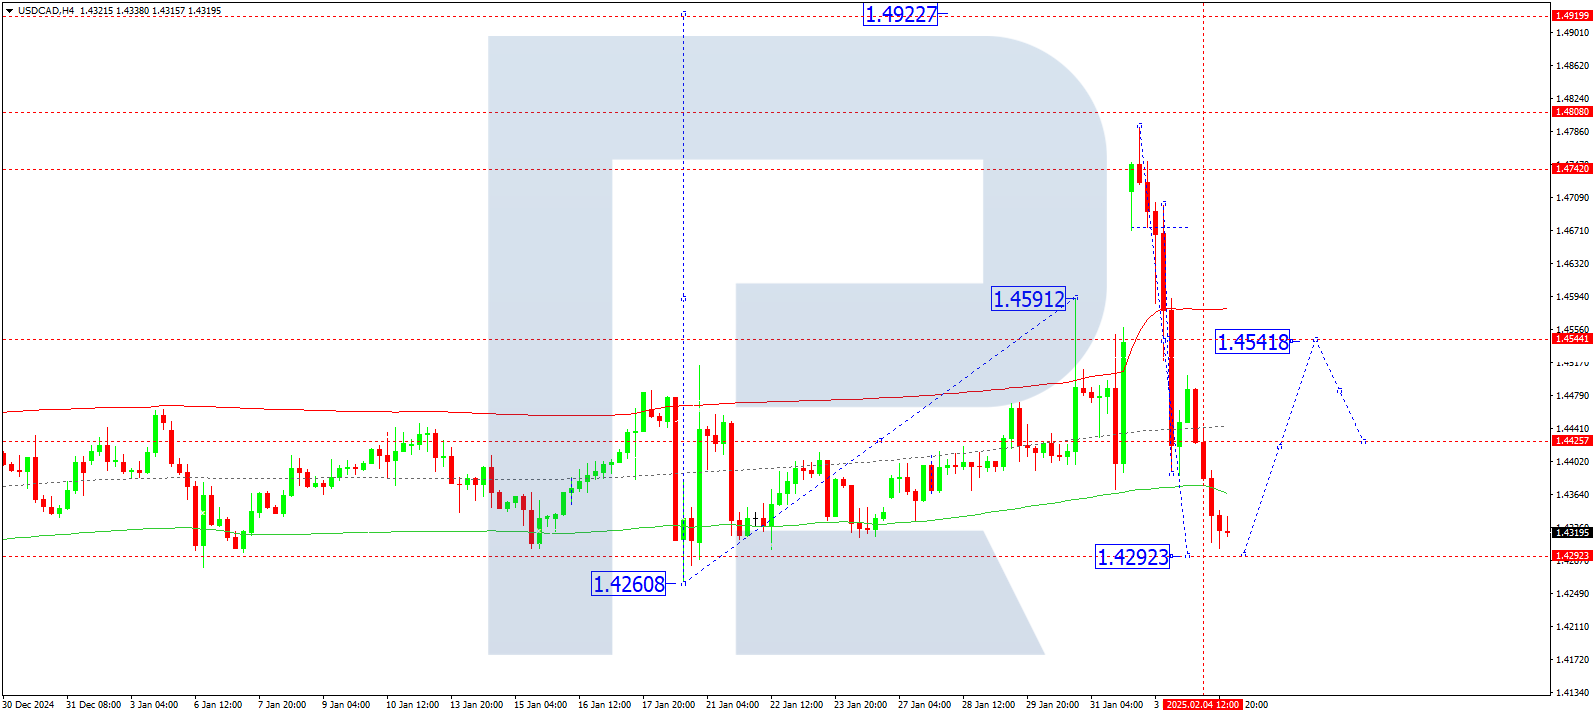
USDCAD forecast
On the H4 chart, USDCAD is forming a downward wave towards 1.4292. Today, 5 February 2025, this level is expected to be reached, followed by the formation of a consolidation range above it. If the price breaks upwards, potential growth towards 1.4545 may develop, with a further trend extension to 1.4808.
Technically, this scenario is supported by the Elliott wave structure and the downward wave matrix with a pivot point at 1.4545, which is a key level for USDCAD in this wave structure. Currently, the downward wave continues towards the lower boundary of the price Envelope at 1.4292. Later, a potential upward move towards the upper boundary at 1.4808 may occur.
Technical indicators for today's USDCAD forecast suggest the probability of a decline towards 1.4292.
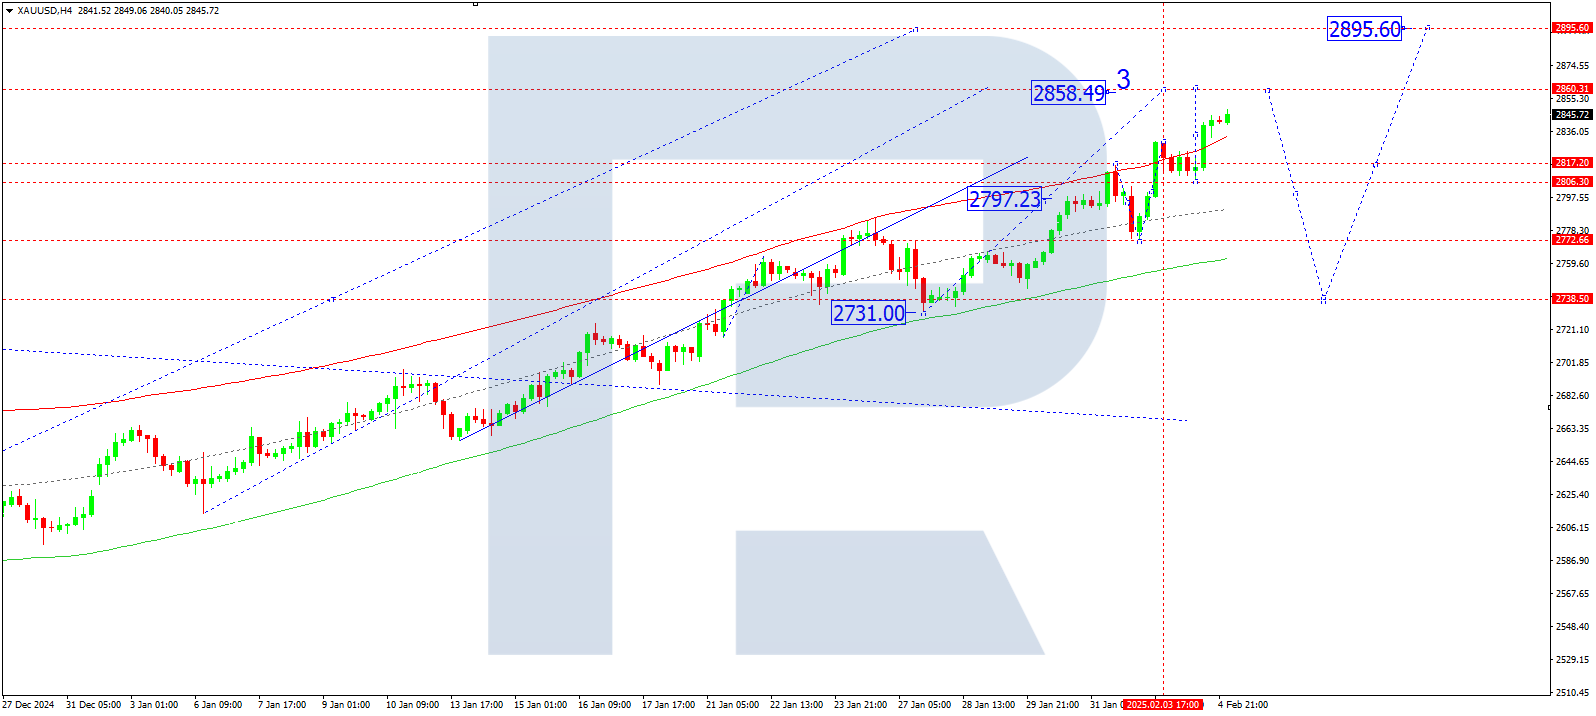
XAUUSD forecast
On the H4 chart, XAUUSD has broken through 2,830 and continues developing a growth wave towards 2,858. Today, 5 February 2025, this target level is expected to be reached, followed by a correction to 2,800. After completing the correction, further growth towards 2,895 is anticipated.
Technically, this scenario is confirmed by the Elliott wave structure and the growth wave matrix with a pivot point at 2,797, which is a key level for XAUUSD in this wave. Currently, the market is forming a growth wave structure towards the upper boundary of the price Envelope at 2,858. Later, a correction towards the central line at 2,800 is expected, followed by a possible new growth wave towards the upper boundary at 2,890.
Technical indicators for today's XAUUSD forecast indicate the probability of growth towards 2,858.
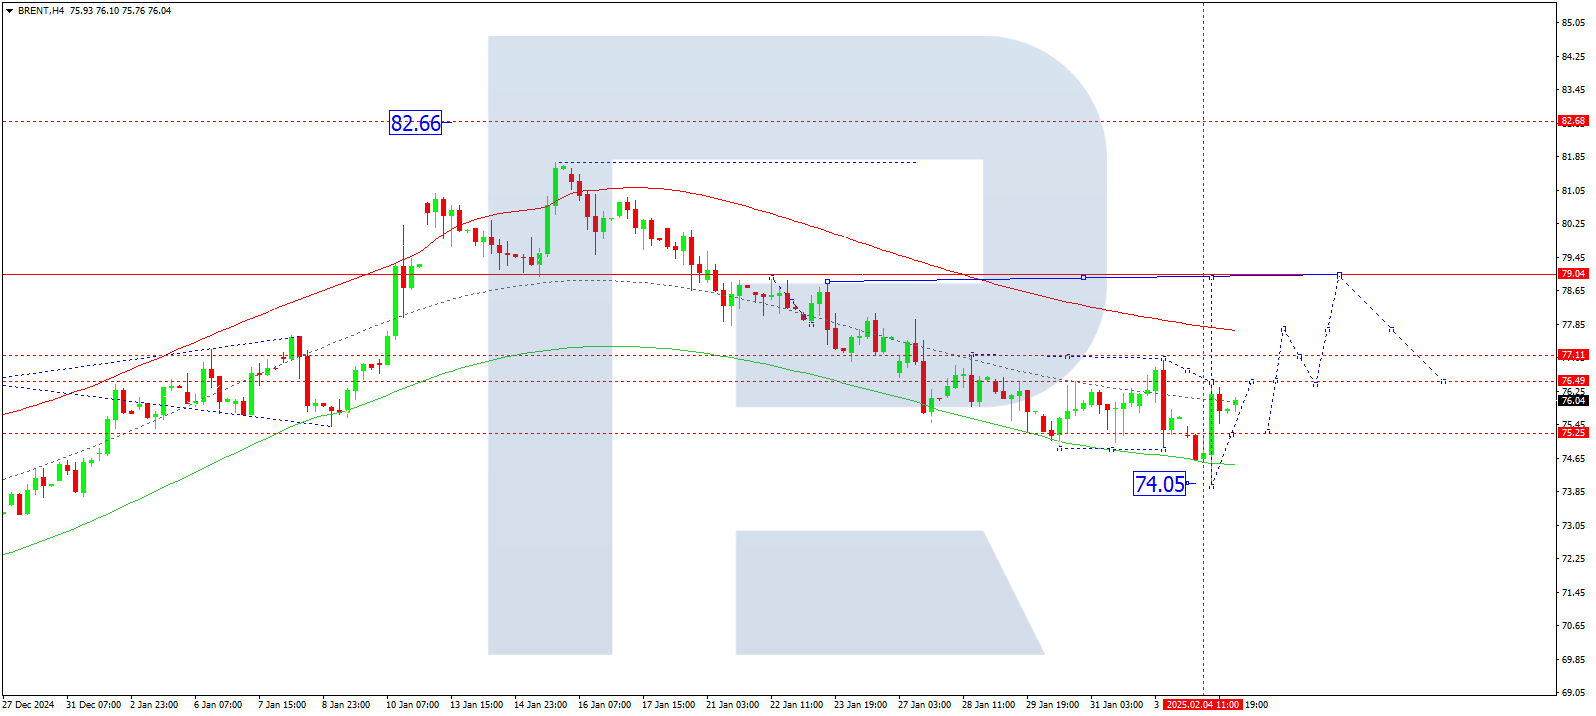
Brent forecast
On the H4 chart, Brent formed a growth impulse towards 76.46. Today, 5 February 2025, a corrective move towards 75.25 is expected. Later, further growth towards 79.00 is anticipated as the first target.
Technically, this scenario is confirmed by the Elliott wave structure and the growth wave matrix with a pivot point at 77.00, which is considered a key level for Brent. Currently, the market has completed a downward wave towards the lower boundary of the price Envelope at 74.05. After reaching this level, a consolidation range is forming. A breakout upwards is expected, initiating a growth wave towards the central line of the Envelope at 77.00, with a further trend extension towards the upper boundary at 79.00.
Technical indicators suggest that today's Brent forecast considers the probability of growth towards 77.00 and 79.00.
Forecasts presented in this section only reflect the author’s private opinion and should not be considered as guidance for trading. RoboForex bears no responsibility for trading results based on trading recommendations described in these analytical reviews.