EURUSD, USDJPY, GBPUSD, AUDUSD, USDCAD, XAUUSD, and Brent technical analysis and forecast for 27 March 2025
Here is a detailed daily technical analysis and forecast for EURUSD, USDJPY, GBPUSD, AUDUSD, USDCAD, XAUUSD, and Brent for 27 March 2025.
EURUSD forecast
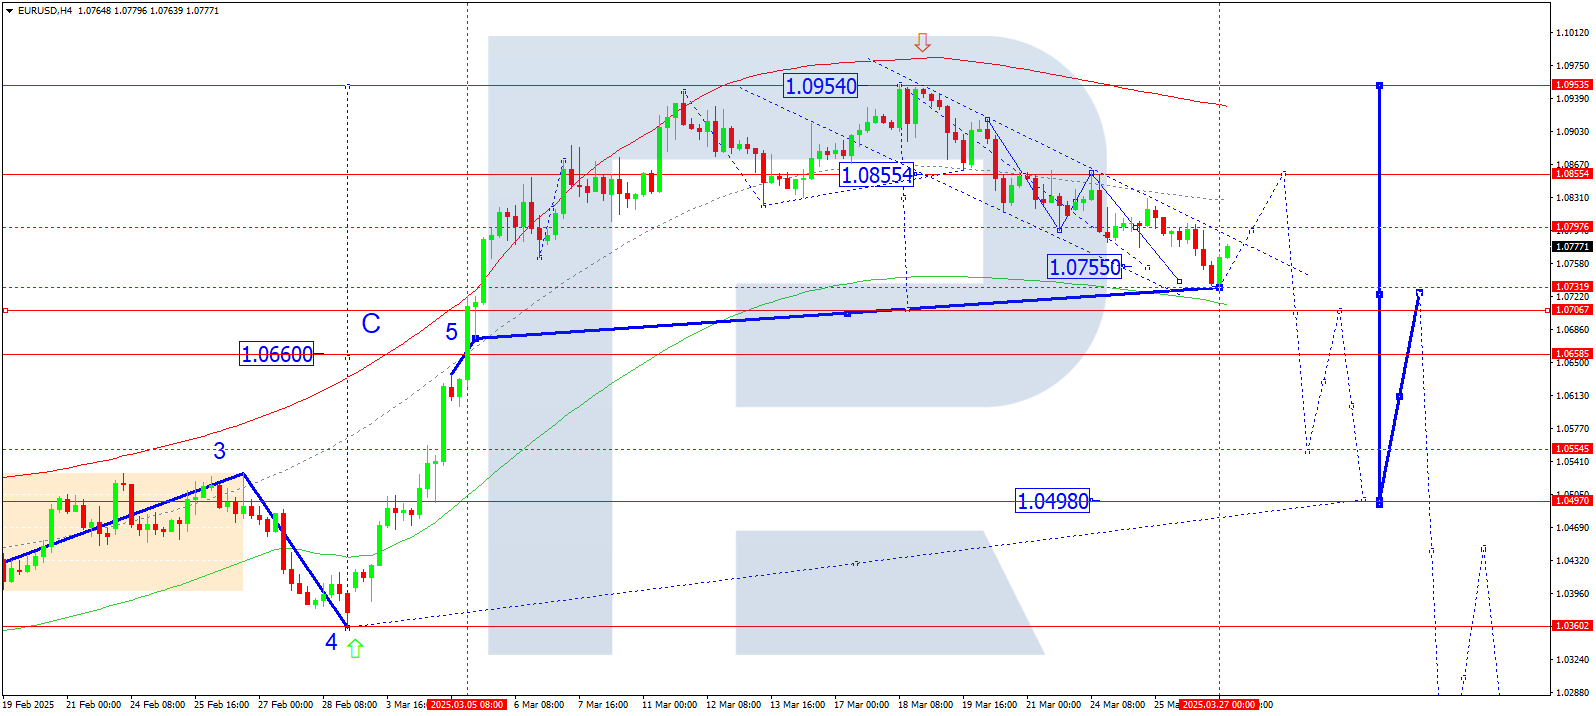
On the H4 chart of EURUSD, the market completed a downward wave to 1.0733, the first target. It is currently developing a correction towards 1.0855, the second target. Today, 27 March 2025, the market may reach this level. Afterwards, the downtrend may resume towards 1.0707.
Technically, this scenario is confirmed by the Elliott wave structure and the downward wave matrix with a pivot at 1.0855, viewed as key for EURUSD. A rise to the central line of the price Envelope at 1.0855 is anticipated. Then, a decline to the lower boundary at 1.0707 is possible.
Technical indicators for today’s EURUSD forecast suggest a likely corrective move to 1.0855.
USDJPY forecast
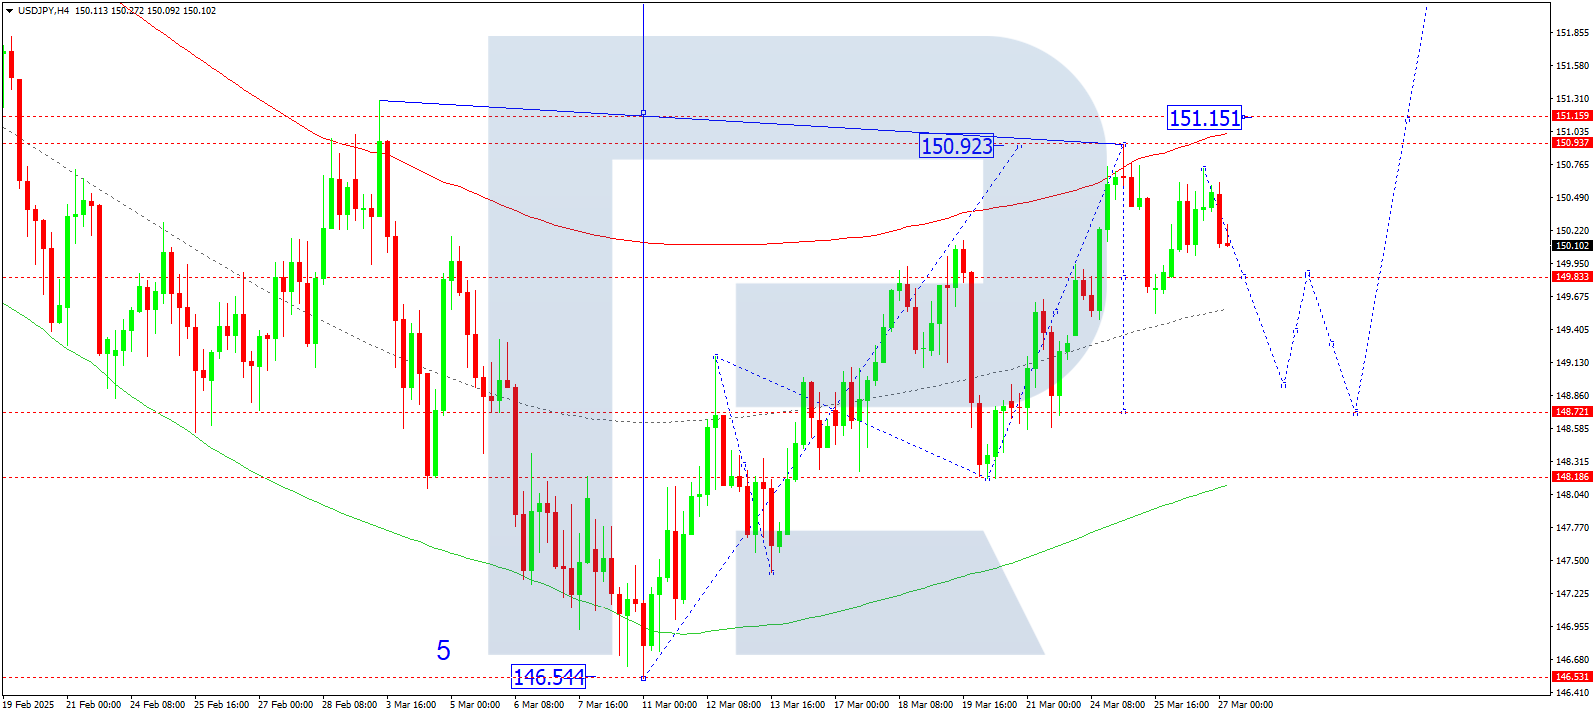
On the H4 chart of USDJPY, the market is consolidating around 149.83. Today, 27 March 2025, a downward move to 148.93 is expected. After reaching this level, a bounce to 149.83 is possible, followed by a potential drop to 148.72, marking a correction wave structure in progress.
Technically, this scenario is supported by the Elliott wave structure and the growth wave matrix with a pivot at 148.72. The market is currently correcting towards the lower boundary of the price Envelope at 148.72. After the correction, growth to the upper boundary at 151.15 may resume.
Technical indicators for today’s USDJPY forecast suggest a correction wave to 148.72.
GBPUSD forecast
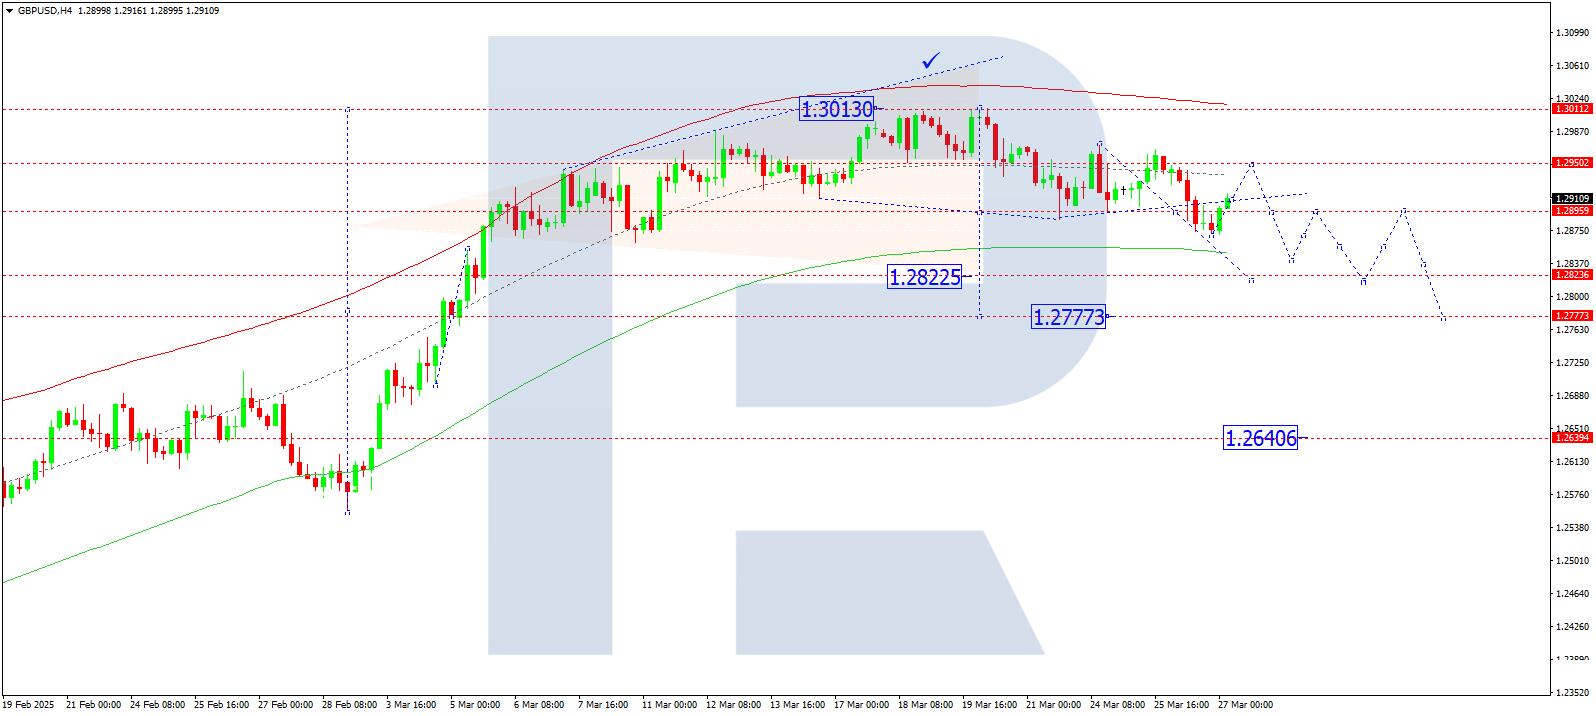
On the H4 chart of GBPUSD, the market completed a downward move to 1.2872 and is now forming a correction towards 1.2950. Today, 27 March 2025, reaching this target looks likely. Once the correction ends, a new wave down to 1.2777 may begin.
Technically, this scenario is supported by the Elliott wave structure and the downward wave matrix with a pivot at 1.2950. The market is consolidating around this level and may develop a drop to the lower boundary of the price Envelope at 1.2777.
Technical indicators for today’s GBPUSD forecast suggest a likely move down to 1.2777.
AUDUSD forecast
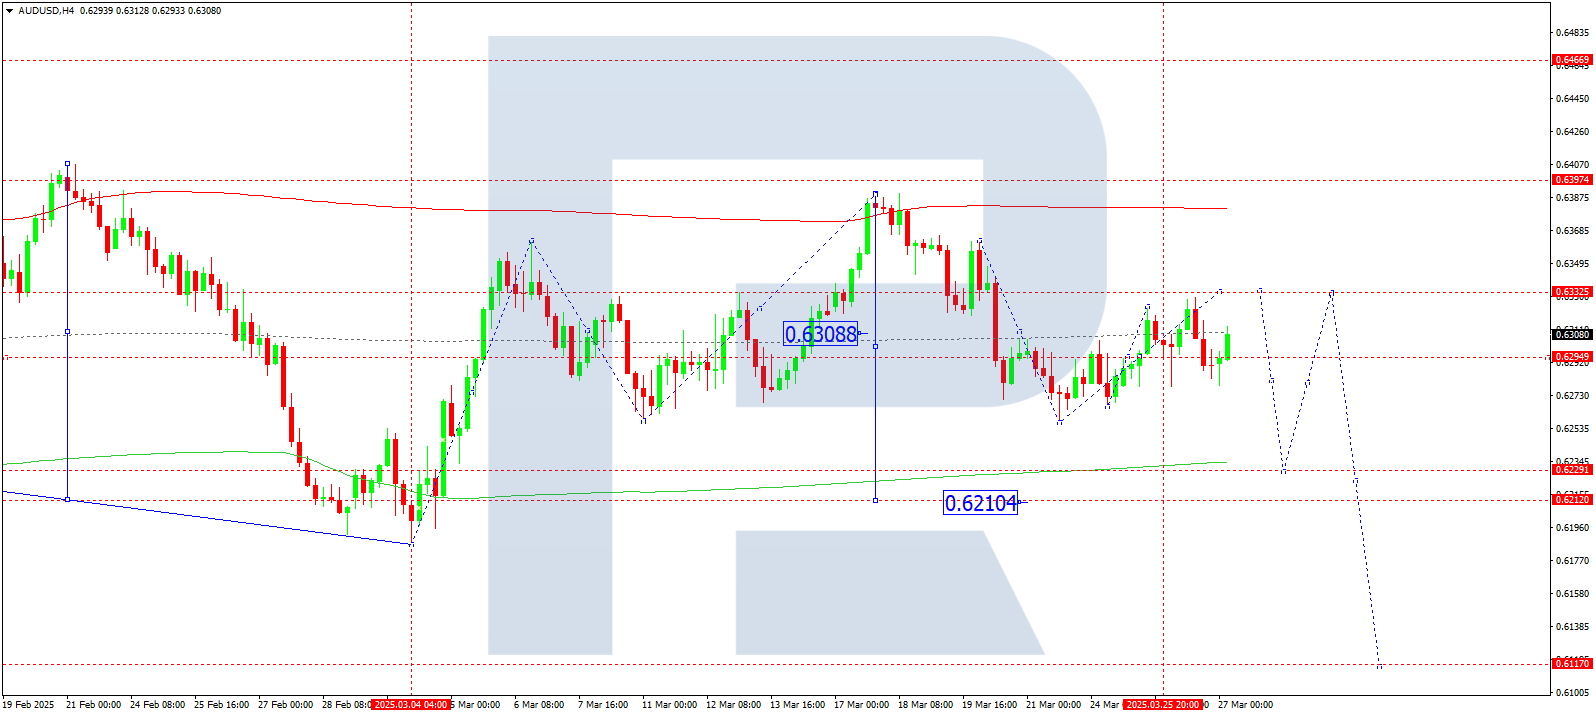
On the H4 chart of AUDUSD, the market continues its correction towards 0.6333. Today, 27 March 2025, this level is expected to be reached. Afterwards, a new downward wave towards 0.6222 is anticipated.
Technically, this scenario is confirmed by the Elliott wave structure and the downward wave matrix for AUDUSD with a pivot at 0.6300. The market is consolidating around the central line of the price Envelope at 0.6300. A decline to the lower boundary at 0.6222 is expected.
Technical indicators for today’s AUDUSD forecast suggest a continuation of the downtrend towards 0.6222.
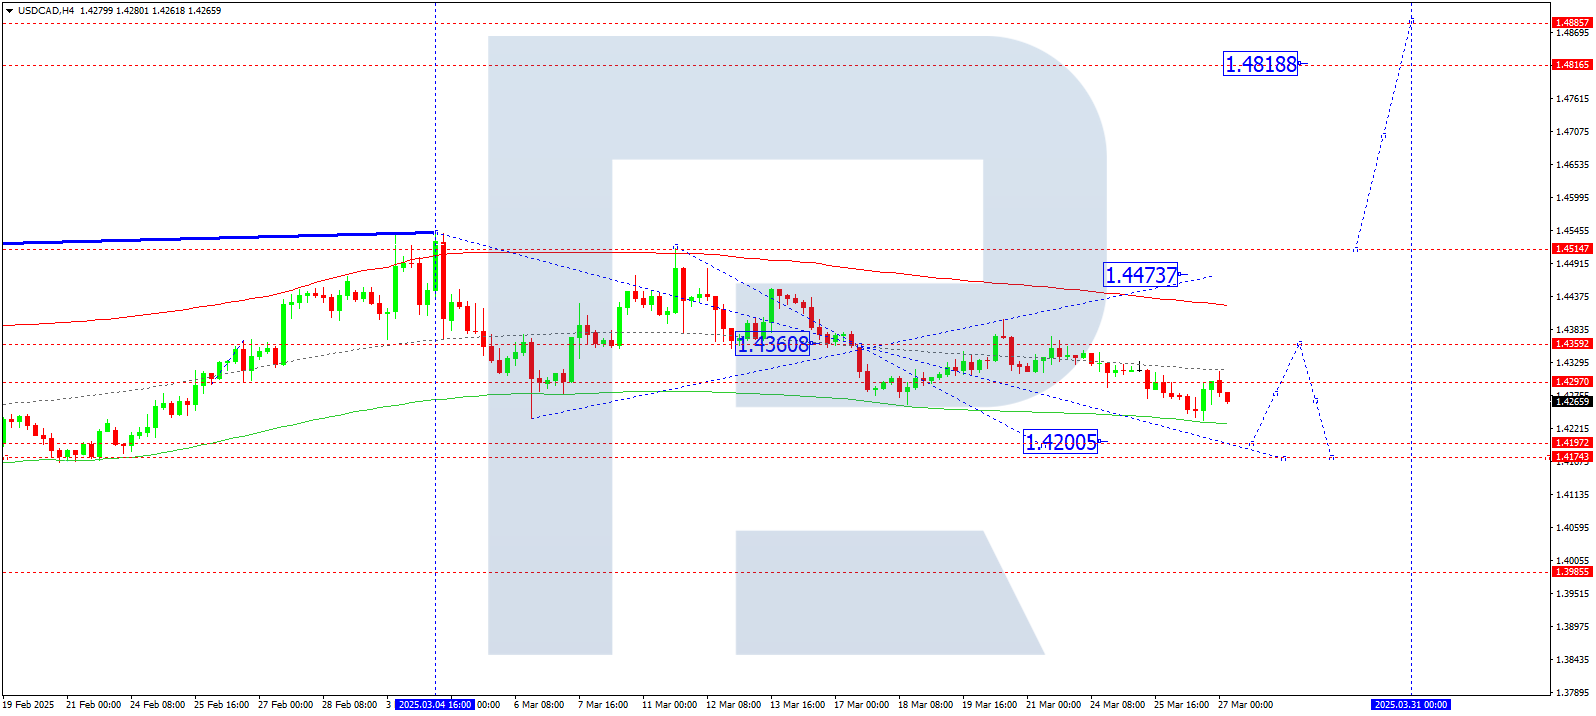
USDCAD forecast
On the H4 chart of USDCAD, the market is forming a downward wave structure aiming for the local target of 1.4200. Today, 27 March 2025, this level is likely to be reached. Afterwards, a new upward wave towards 1.4360 may begin.
Technically, this scenario is supported by the Elliott wave structure and the downward wave matrix with a pivot at 1.4360. This level is considered crucial for this wave in the USDCAD rate. The market is currently heading towards the lower boundary of the price Envelope at 1.4200. A recovery to the upper boundary at 1.4360 could follow.
Technical indicators for today’s USDCAD forecast suggest a decline to 1.4200.
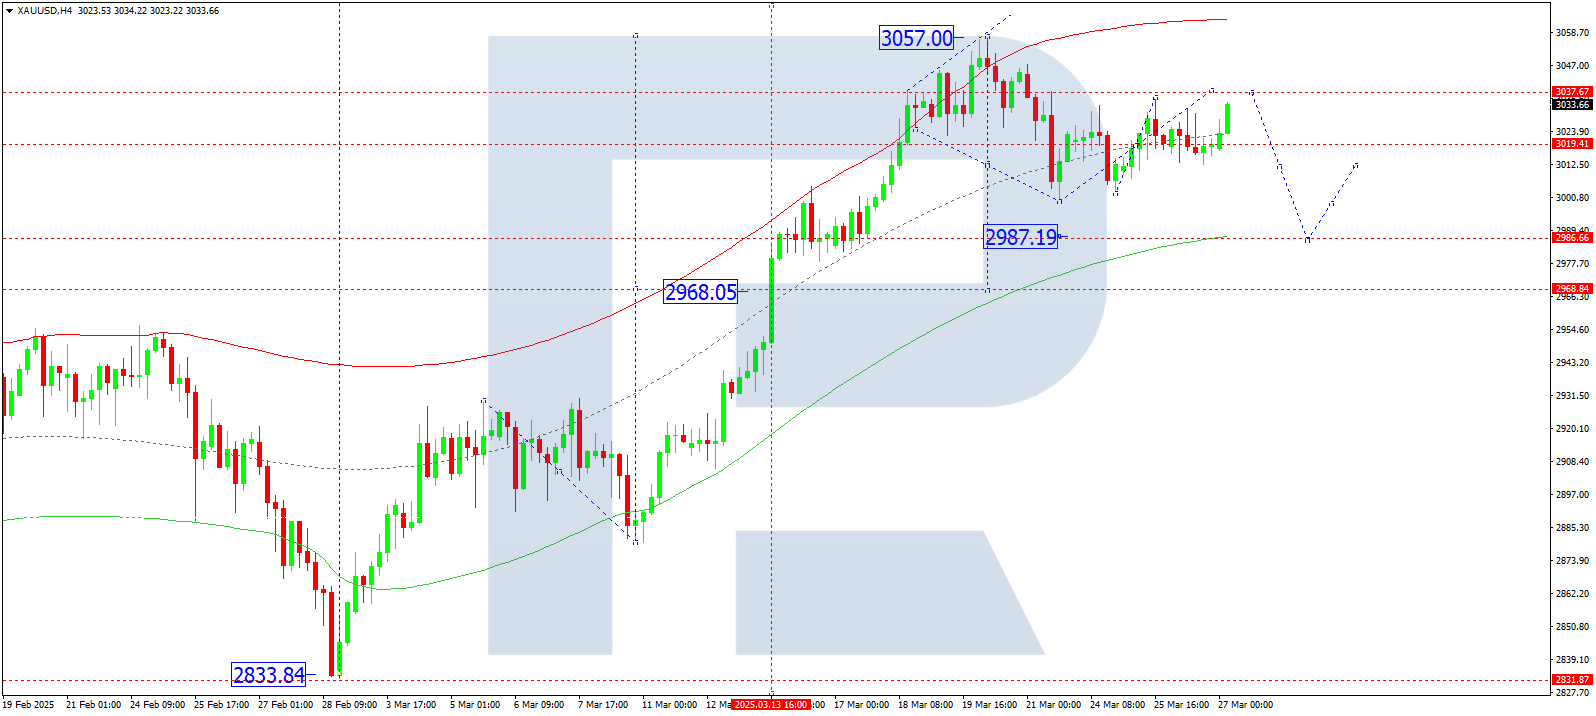
XAUUSD forecast
On the H4 chart of XAUUSD, the market is forming an upward wave structure targeting 3,035. Today, 27 March 2025, this level is expected to be reached. Afterwards, a downward wave may develop towards 2,986, the local target.
Technically, this scenario is confirmed by the Elliott wave structure and the downward wave matrix with a pivot at 3,035, considered key for XAUUSD. The market continues to consolidate around the central line of the price Envelope at 3,020. A decline to the lower boundary at 2,986 is expected.
Technical indicators for today’s XAUUSD forecast suggest a possible move down to 2,986.
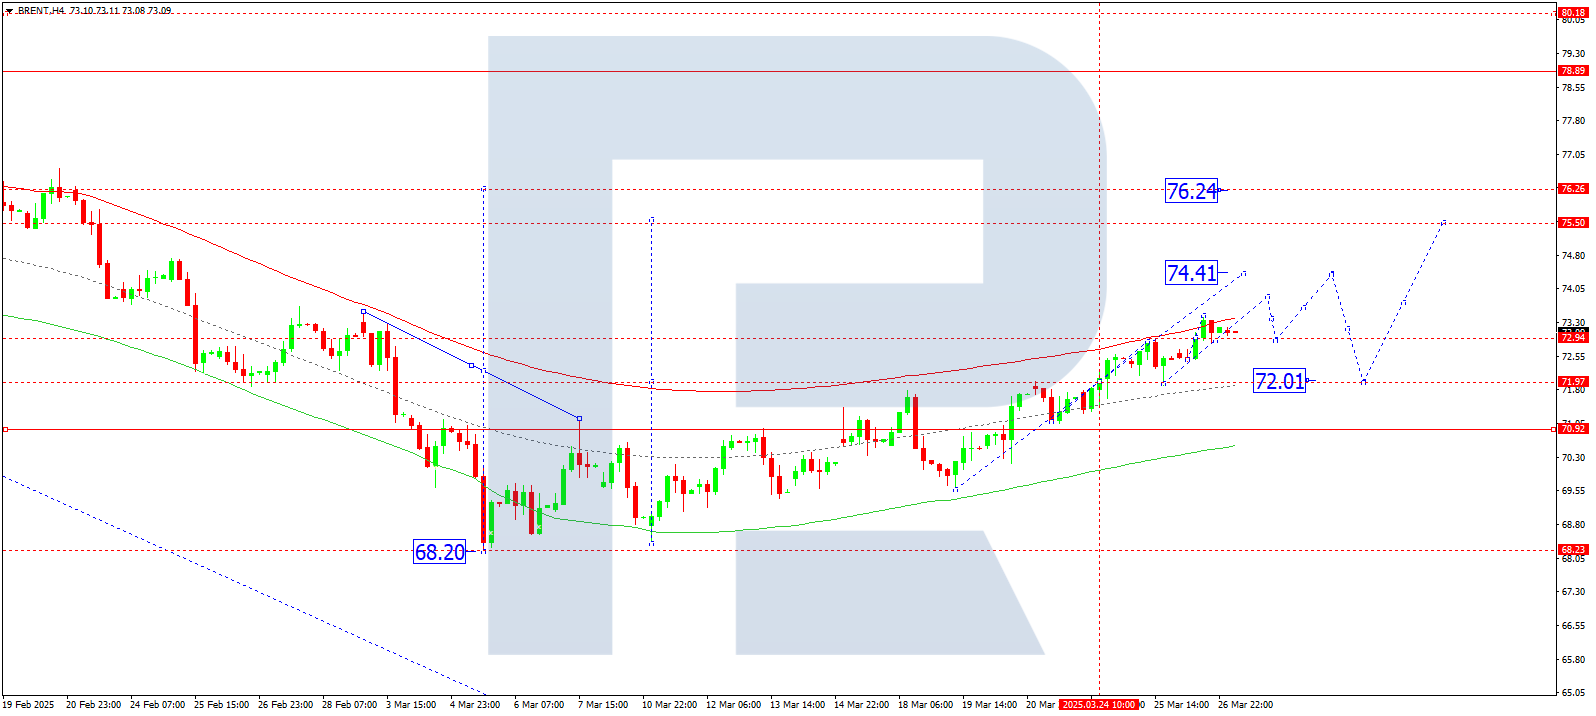
Brent forecast
On the H4 chart of Brent crude, the market is extending its upward wave structure to 74.40. Today, 27 March 2025, this target is likely to be reached. Afterwards, a correction to 72.00 may begin.
Technically, this scenario is supported by the Elliott wave structure and the upward wave matrix with a pivot at 72.00, considered key for Brent. The market is currently heading towards the upper boundary of the price Envelope at 74.40. A correction to the lower boundary at 72.00 may follow.
Technical indicators in today’s Brent forecast suggest growth towards 74.40.
Forecasts presented in this section only reflect the author’s private opinion and should not be considered as guidance for trading. RoboForex bears no responsibility for trading results based on trading recommendations described in these analytical reviews.