Daily technical analysis and forecast for 29 May 2025
Here is a detailed daily technical analysis and forecast for EURUSD, USDJPY, GBPUSD, AUDUSD, USDCAD, XAUUSD and Brent for 29 May 2025.
EURUSD forecast
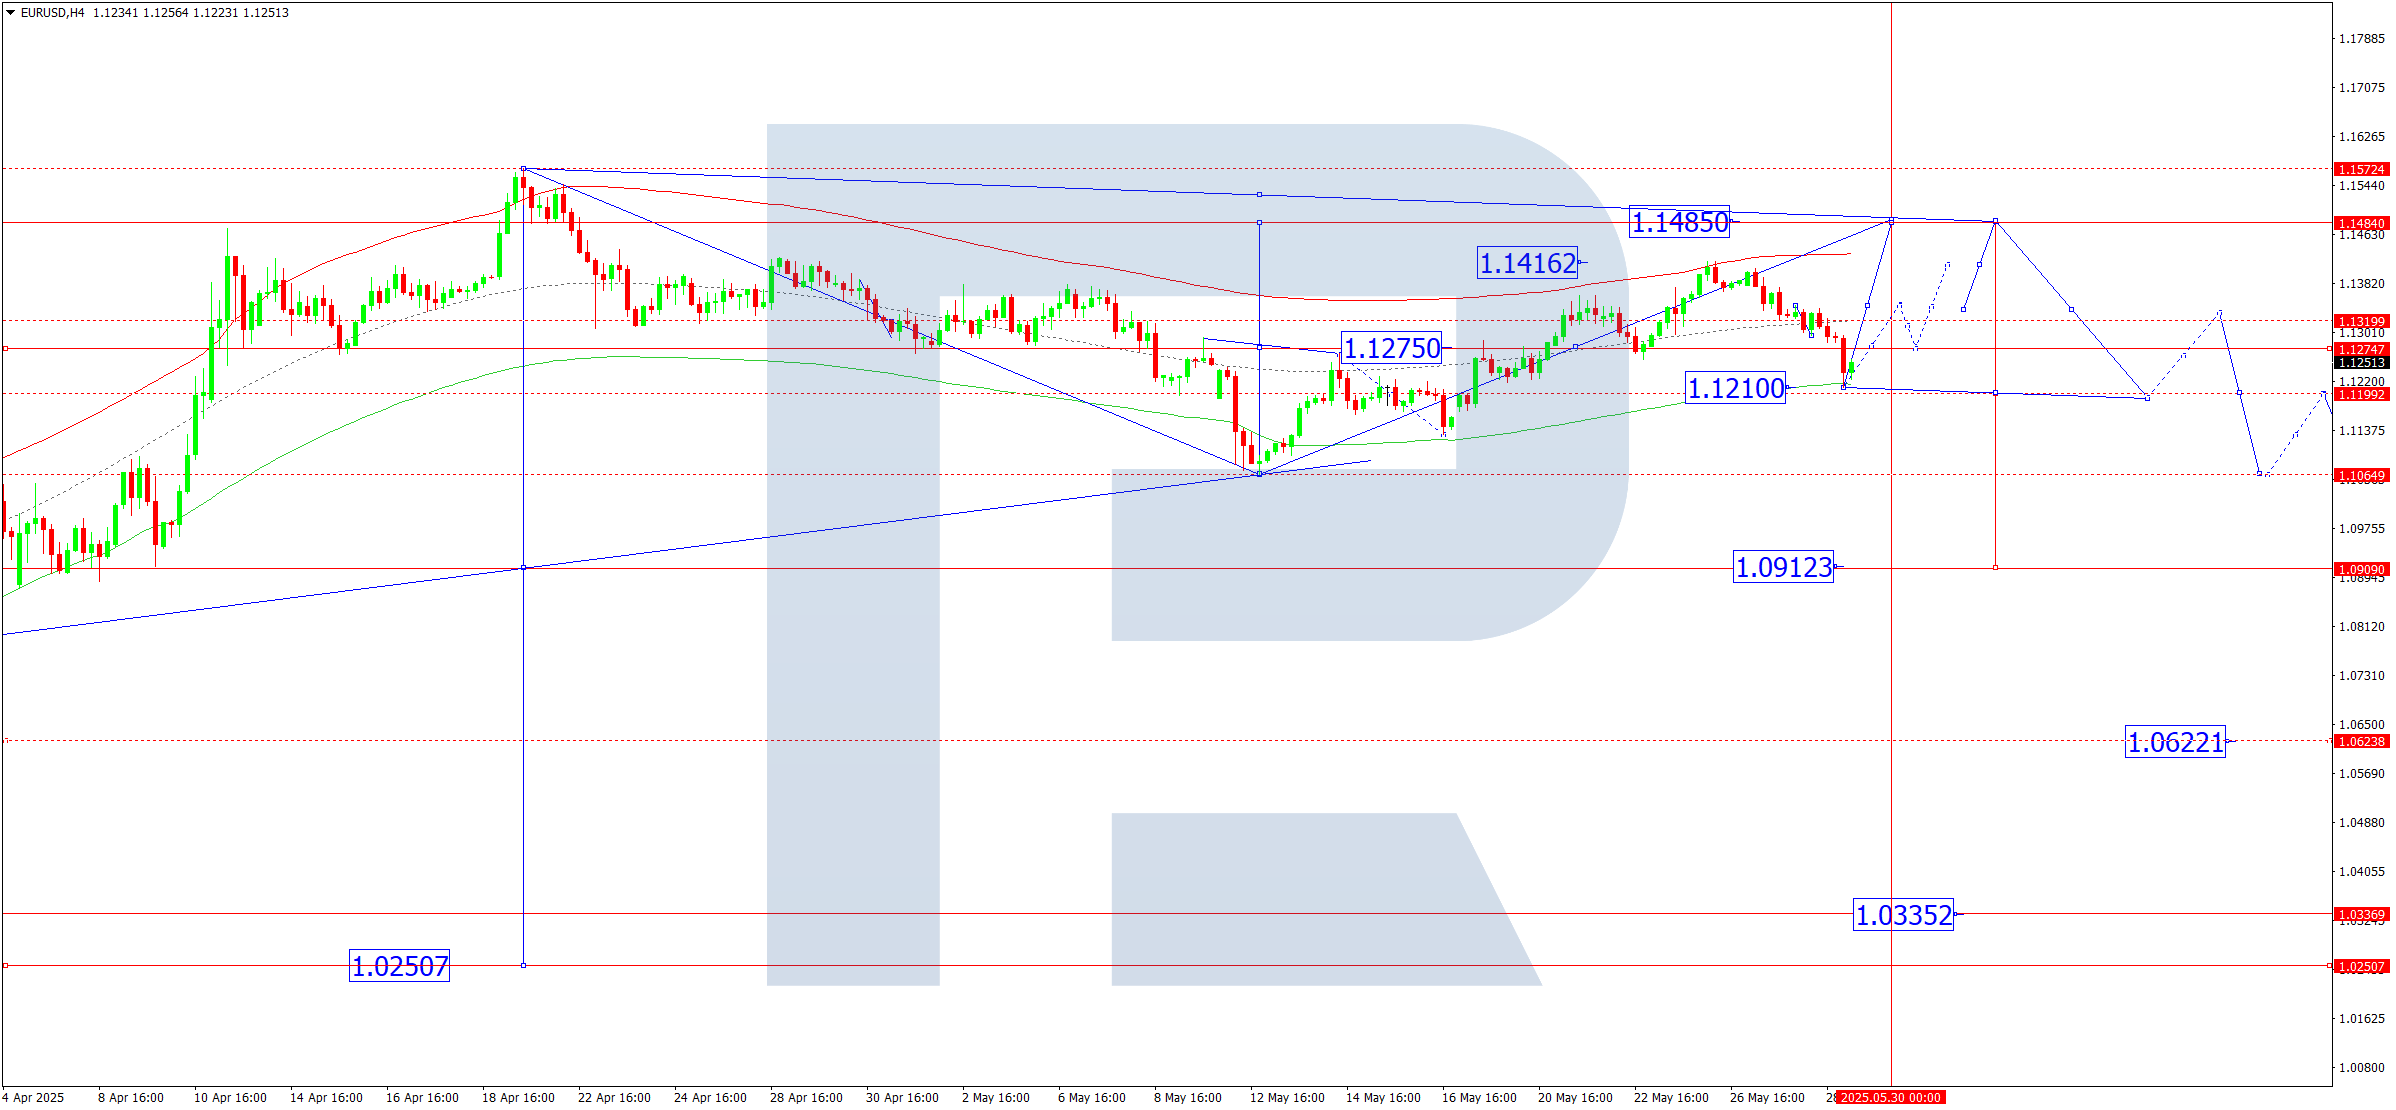
On the H4 chart of EURUSD, the market completed a correction to 1.1210. Today, 29 May 2025, an upward wave is expected to begin, aiming for 1.1313. A breakout above this level could open the path for a continuation of the trend to 1.1485. Afterwards, a decline to 1.1065 is possible.
This scenario is technically supported by the Elliott wave structure and the upward wave matrix with a pivot at 1.1275, seen as key in the current structure. The correction to the lower boundary of the price Envelope at 1.1210 has been completed. Today, the price could rise to the upper boundary at 1.1485.
Technical indicators for today’s EURUSD forecast suggest a rise to 1.1313.
USDJPY forecast
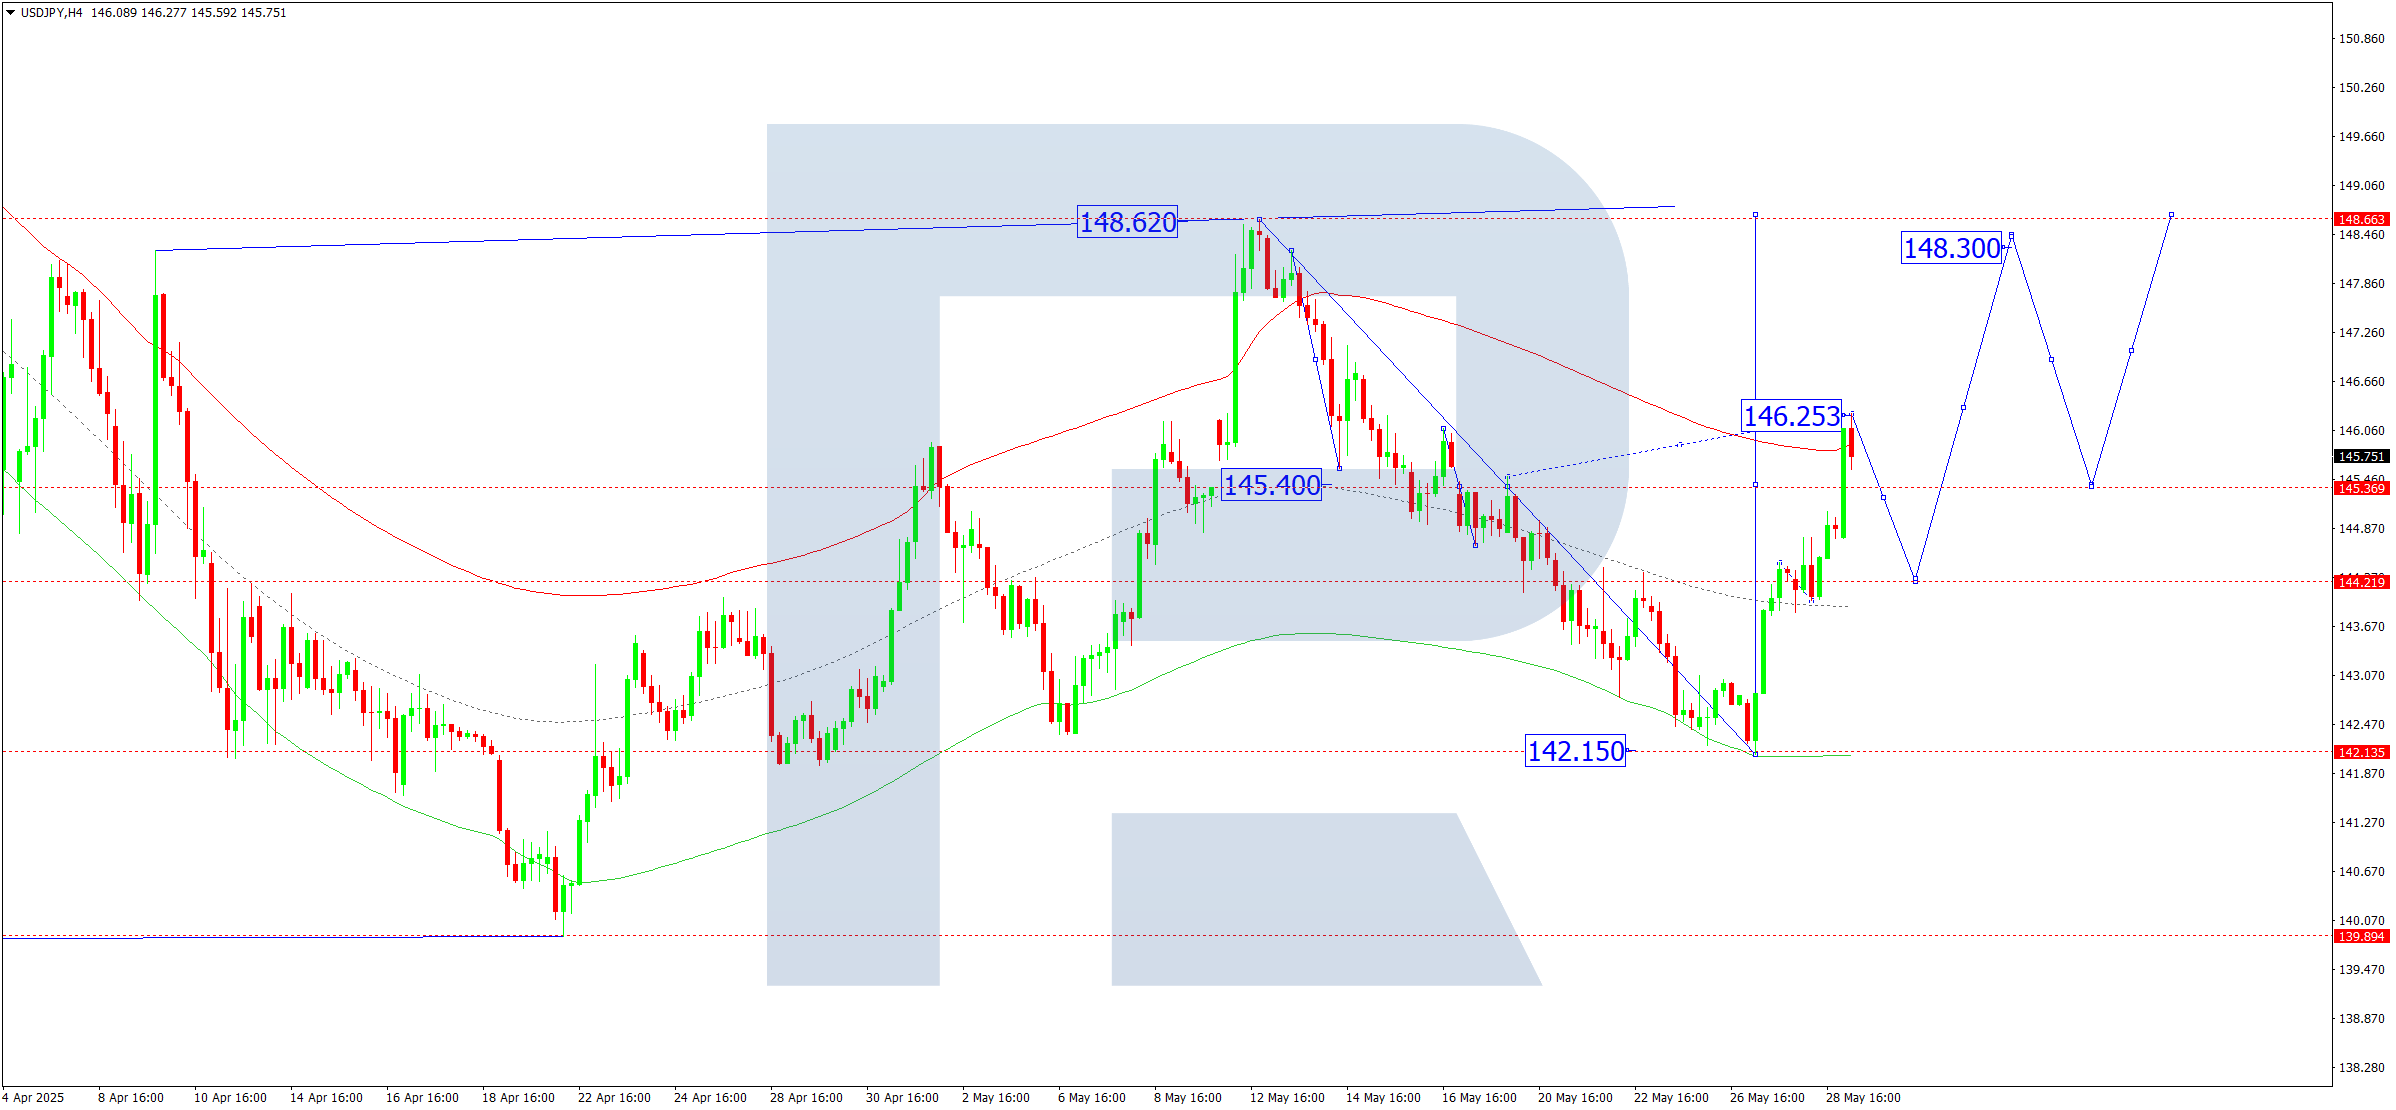
On the H4 chart of USDJPY, the market formed a consolidation range around 144.20 and broke upwards to 146.25. Today, 29 May 2025, a pullback to 144.20 (testing from above) is likely. This move may establish the boundaries of a broad consolidation range. A breakout upwards could continue the trend to 148.60, while a downward breakout may lead to a new wave to 139.90.
This scenario is confirmed by the Elliott wave structure and the downward wave matrix with a pivot at 145.40, viewed as key in this structure. The market broke out of the consolidation around the central line of the price Envelope towards its upper boundary at 146.25. Today, a correction to the central line at 144.22 is possible.
Technical indicators for today’s USDJPY forecast suggest a move down to 144.22.
GBPUSD forecast
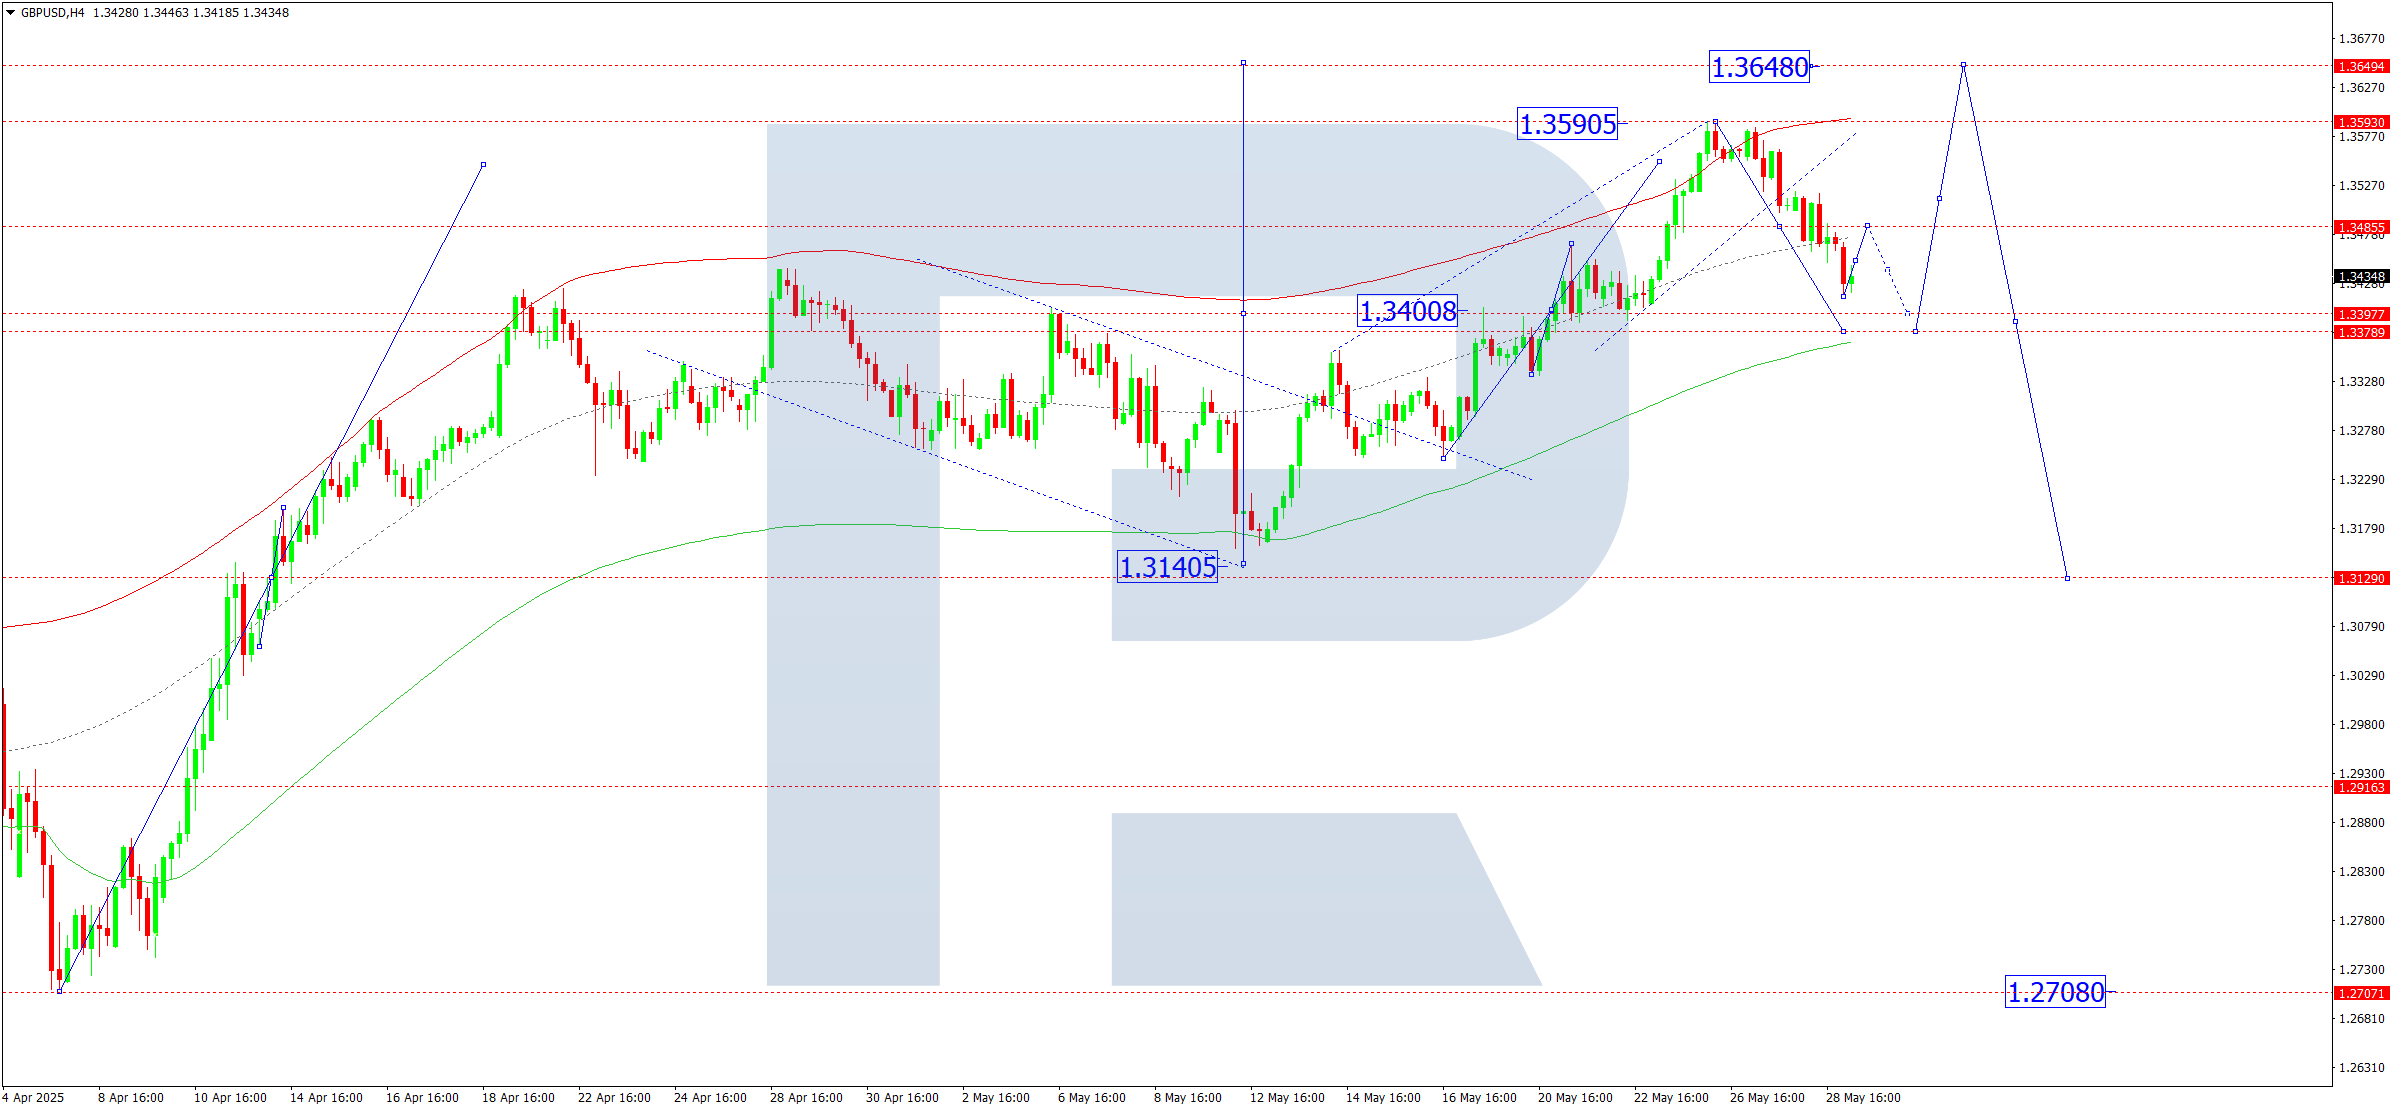
On the H4 chart of GBPUSD, the market completed a downward wave to 1.3415. Today, 29 May 2025, the pair is expected to start its upward move towards 1.3485. Afterwards, a decline to 1.3380 is possible, followed by a potential upward wave to 1.3648.
This scenario is supported by the Elliott wave structure and the upward wave matrix with a pivot at 1.3400, considered key for GBPUSD. The market had previously reached the upper boundary of the price Envelope at 1.3590. Today, a move to the lower boundary at 1.3380 is likely, followed by a rise to the upper boundary at 1.3648.
Technical indicators for today’s GBPUSD forecast suggest a correction to 1.3400.
AUDUSD forecast
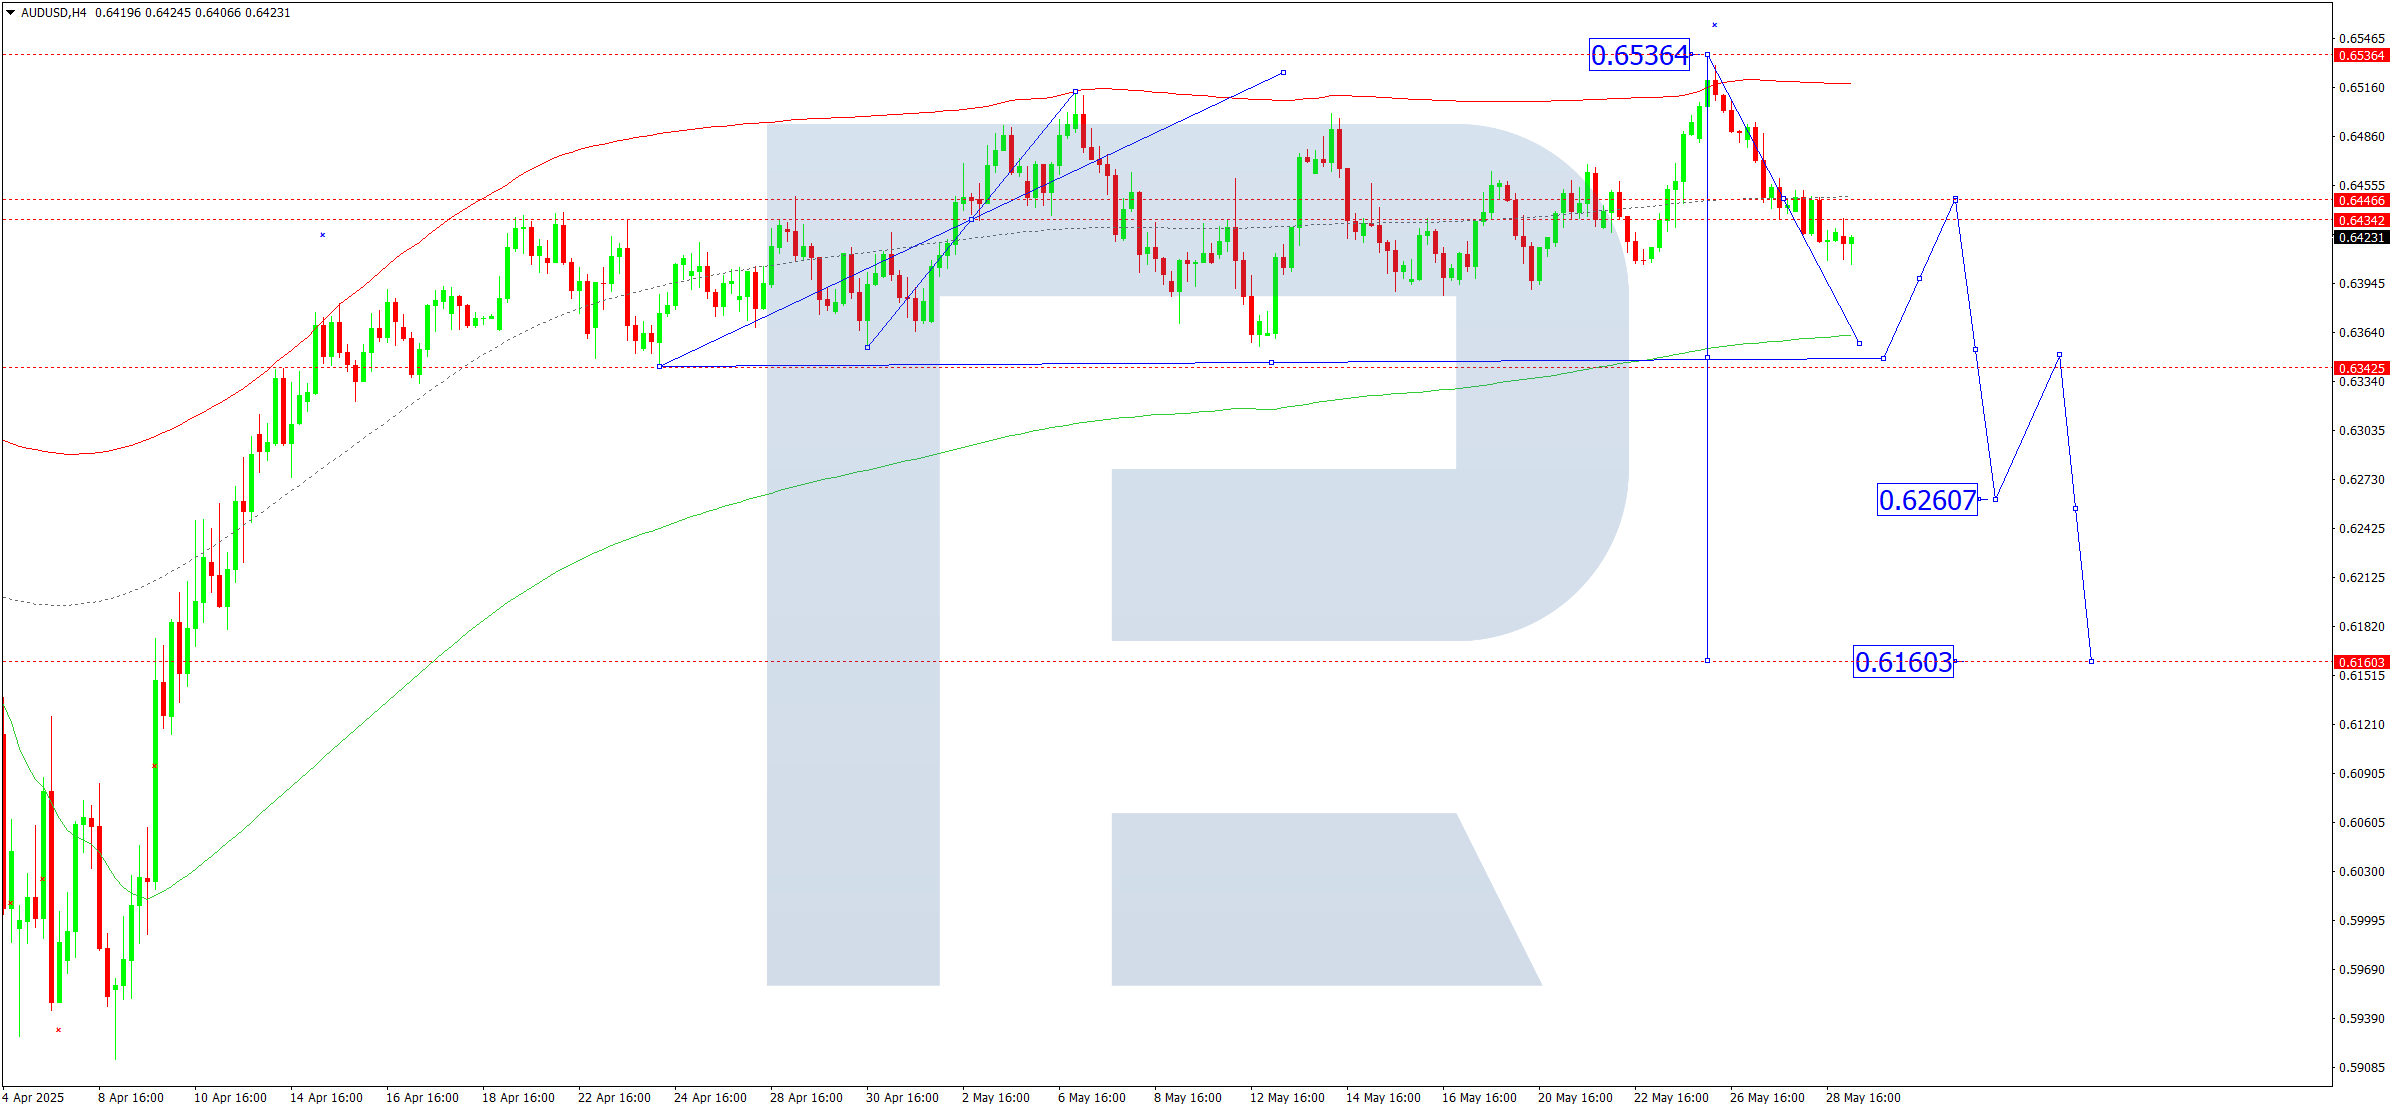
On the H4 chart of AUDUSD, the market formed a consolidation range around 0.6446 and broke downwards. Today, 29 May 2025, the downward wave could continue to 0.6340, the initial target. Then, a rebound to 0.6446 (testing from below) is possible. The market continues moving within a broad consolidation range.
This scenario is confirmed by the Elliott wave structure and the upward wave matrix with a pivot at 0.6430, seen as key in this wave. The market previously completed an upward wave to the upper boundary of the price Envelope at 0.6536 and is now declining towards its lower boundary at 0.6343.
Technical indicators for today’s AUDUSD forecast suggest a continued decline to 0.6343.
USDCAD forecast
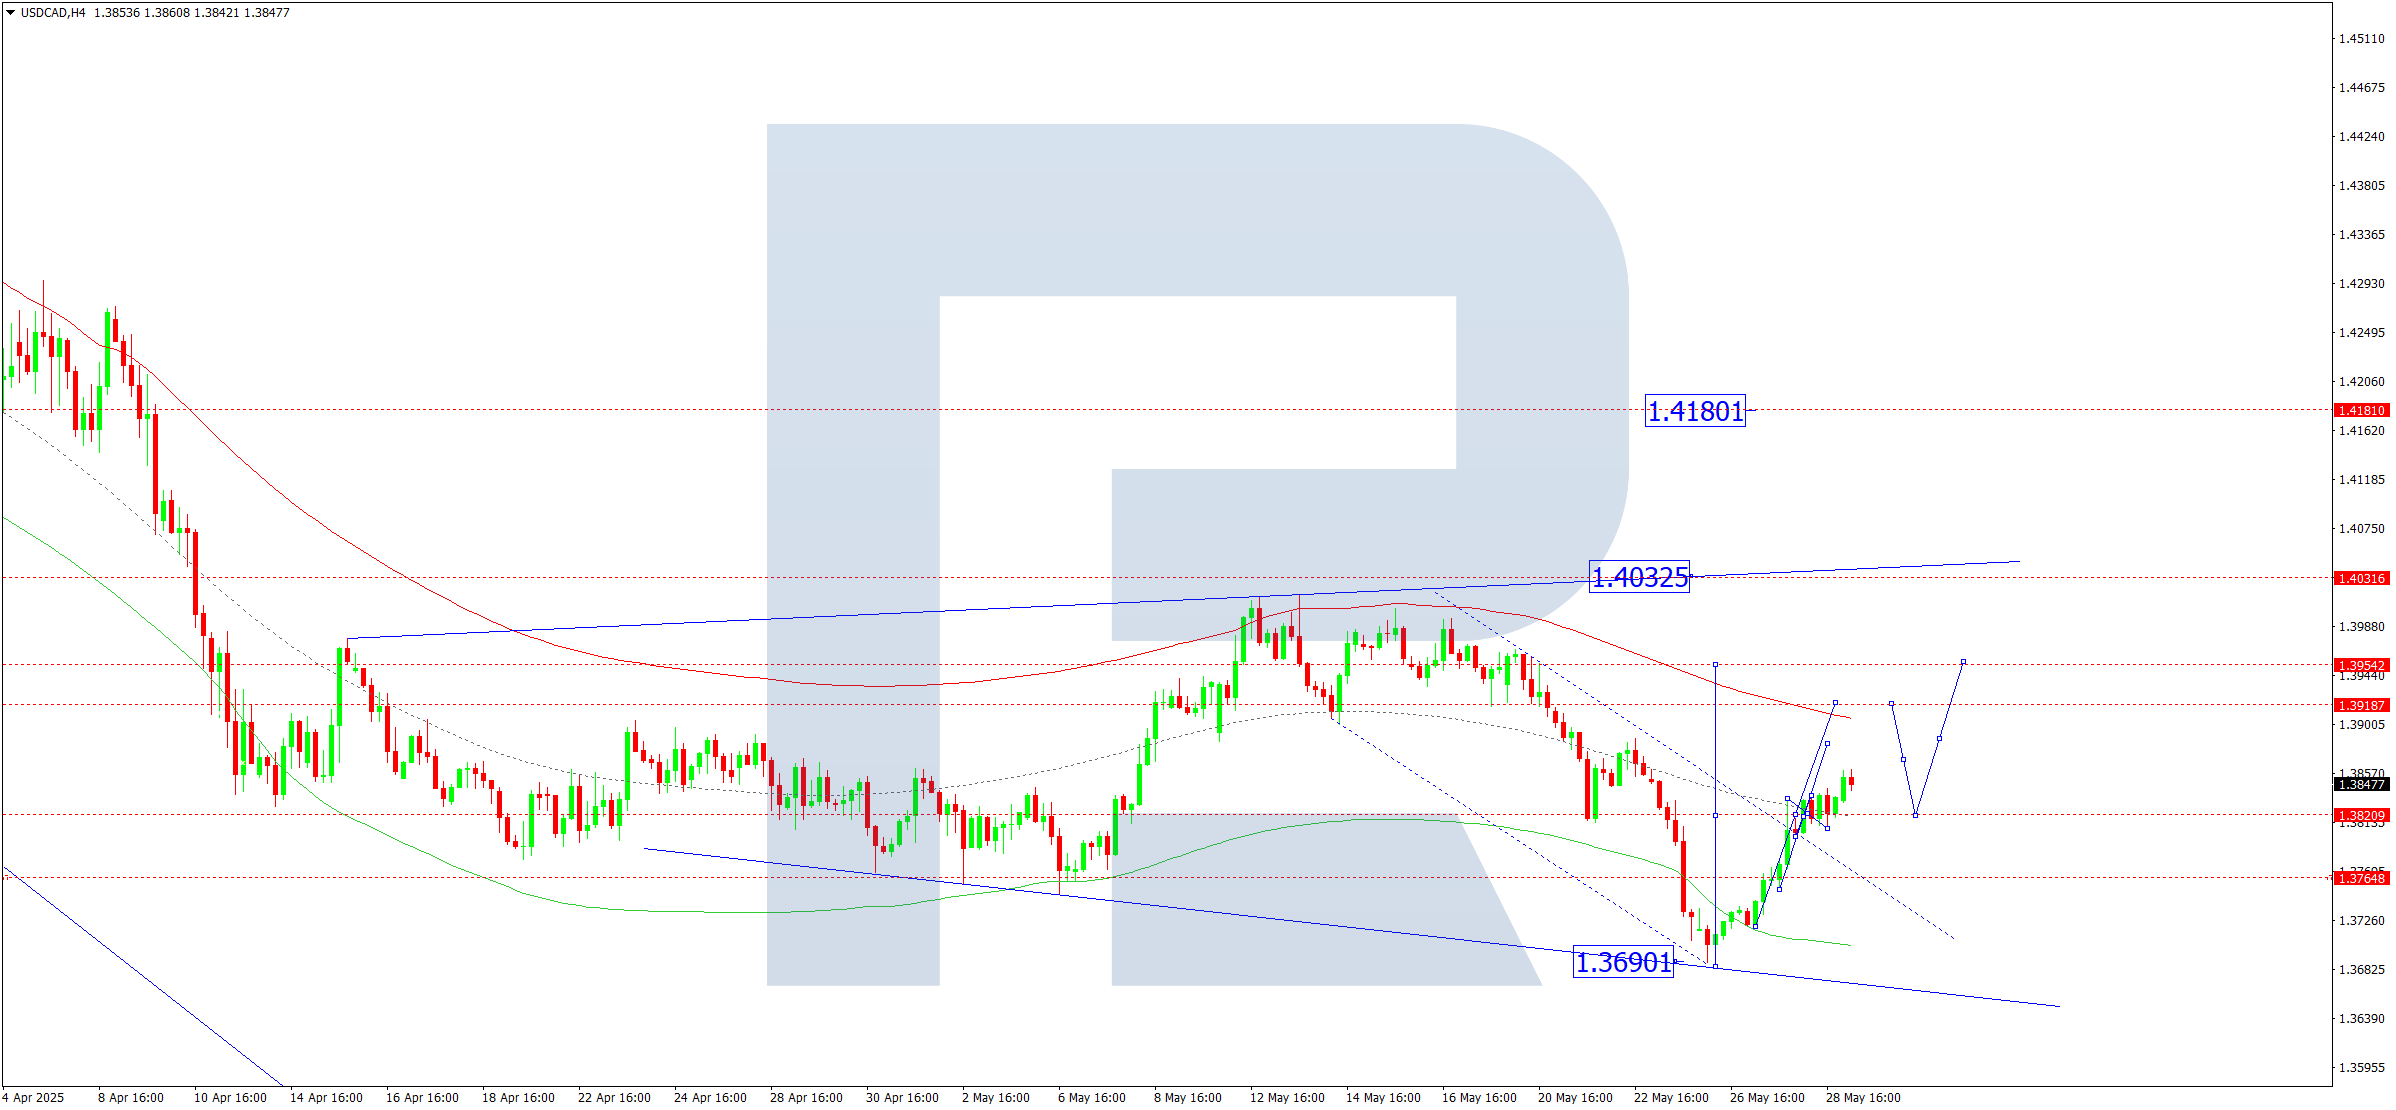
On the H4 chart of USDCAD, the market formed a consolidation range around 1.3820 and broke upwards. The breakout opened potential for a wave to 1.3950. Today, 29 May 2025, the price is expected to reach 1.3880. A pullback to 1.3820 may follow, then another rise to 1.3950.
This scenario is supported by the Elliott wave structure and the upward wave matrix with a pivot at 1.3820, considered key for USDCAD. The market is currently forming an upward wave to the upper boundary of the price Envelope at 1.3950. After reaching this level, a correction to the central line at 1.3820 is likely.
Technical indicators for today’s USDCAD forecast suggest a rise to 1.3880.
XAUUSD forecast
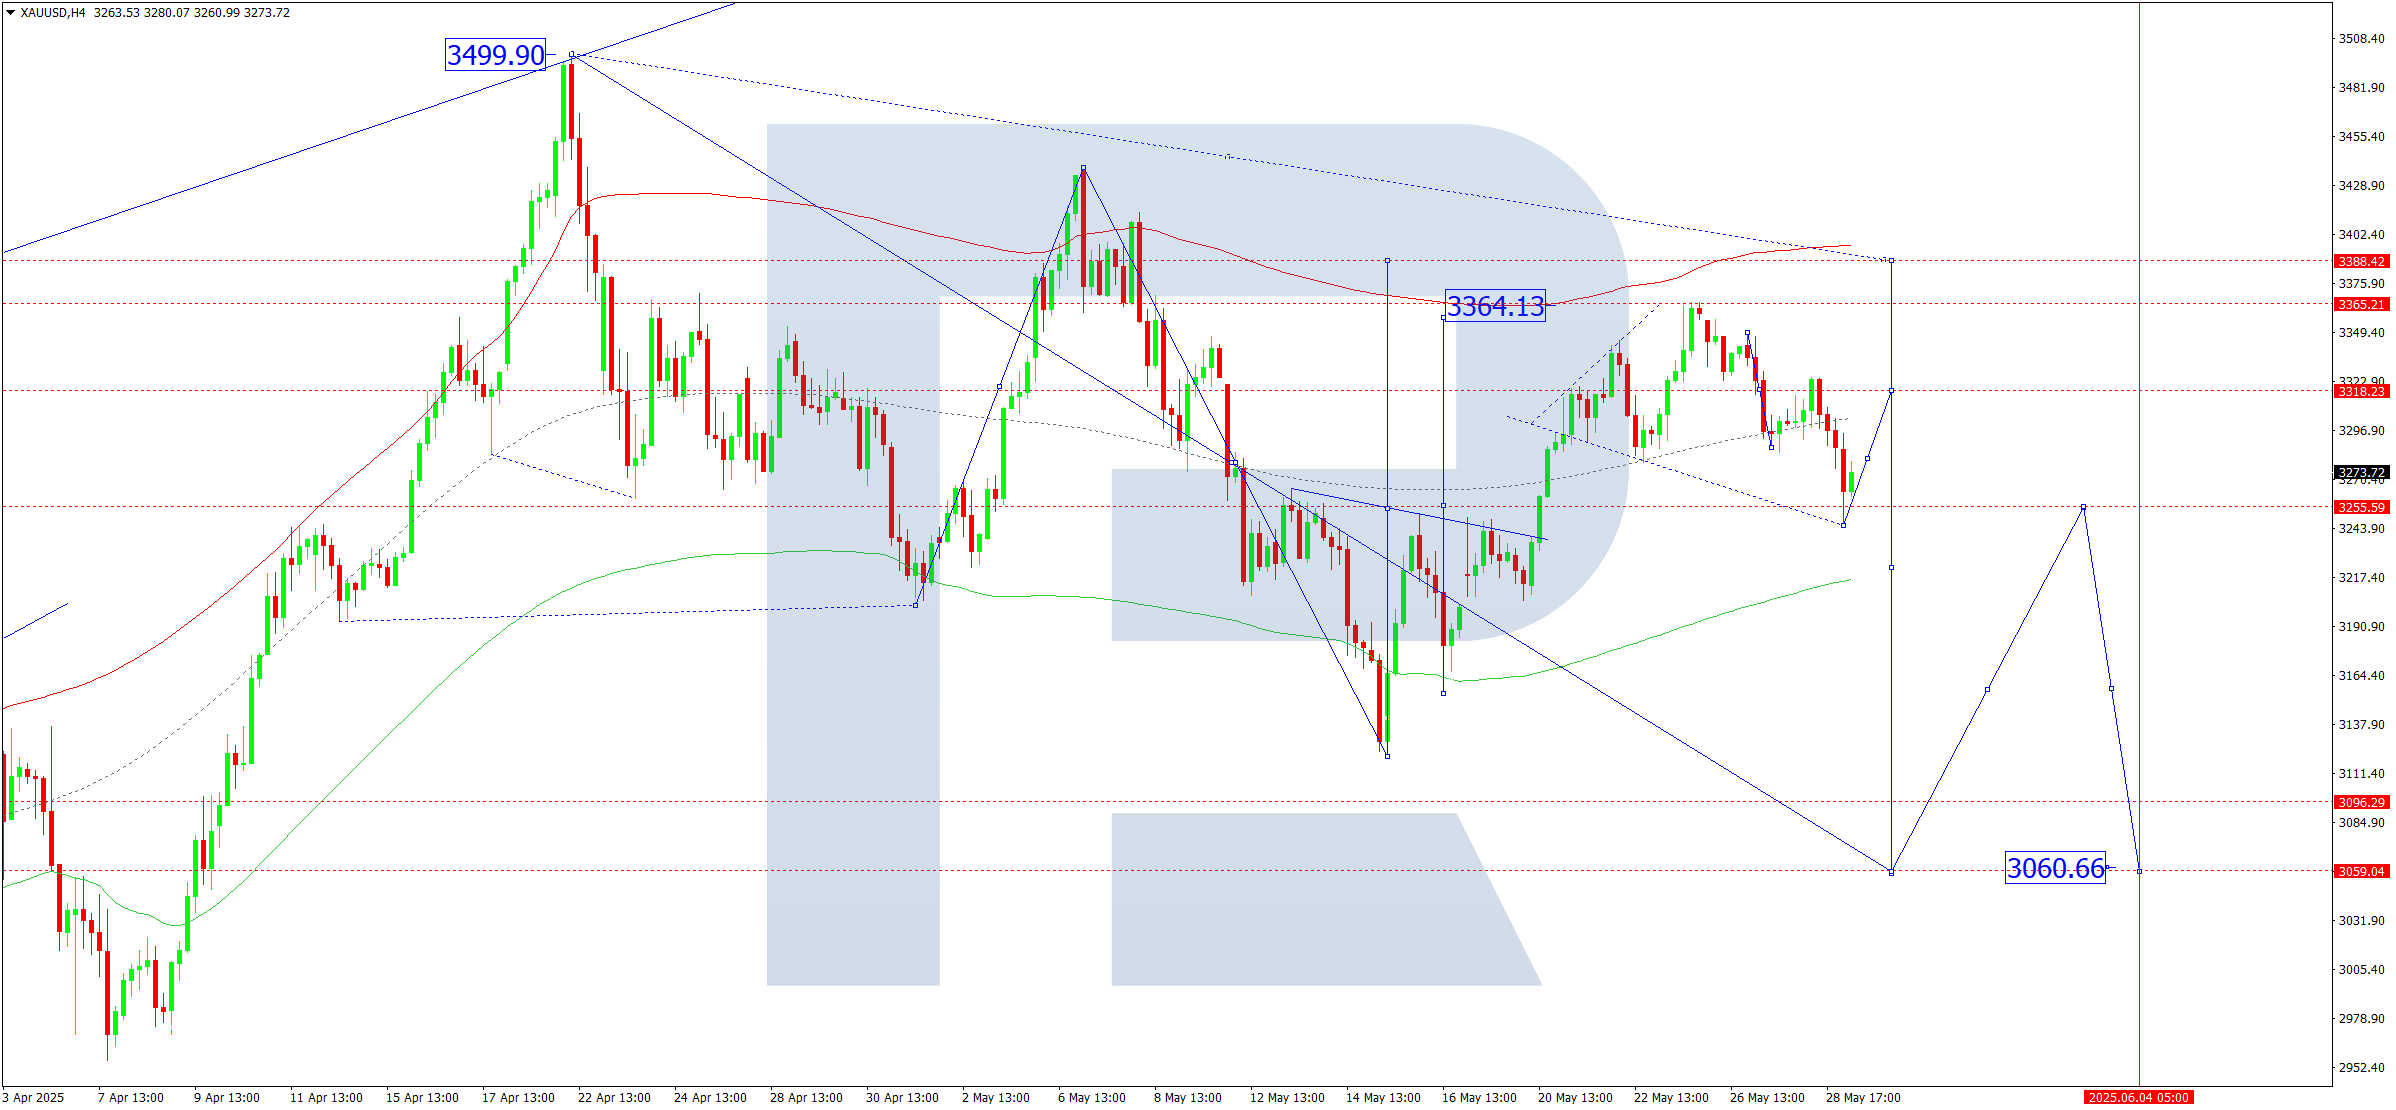
On the H4 chart of XAUUSD, the market completed a correction wave to 3,246. Today, 29 May 2025, a rise to 3,320 is possible. This may define the boundaries of a broad consolidation range. A breakout upwards could extend the growth to 3,388. A breakout downwards could open potential for a continuation of the trend to 3,060, the initial target.
This scenario is confirmed by the Elliott wave structure and the downward wave matrix with a pivot at 3,255, viewed as key for XAUUSD. The market completed a correction to the central line of the price Envelope at 3,246. Today, a move towards the upper boundary at 3,388 is relevant.
Technical indicators for today’s XAUUSD forecast point to a rise to 3,388.
Brent forecast
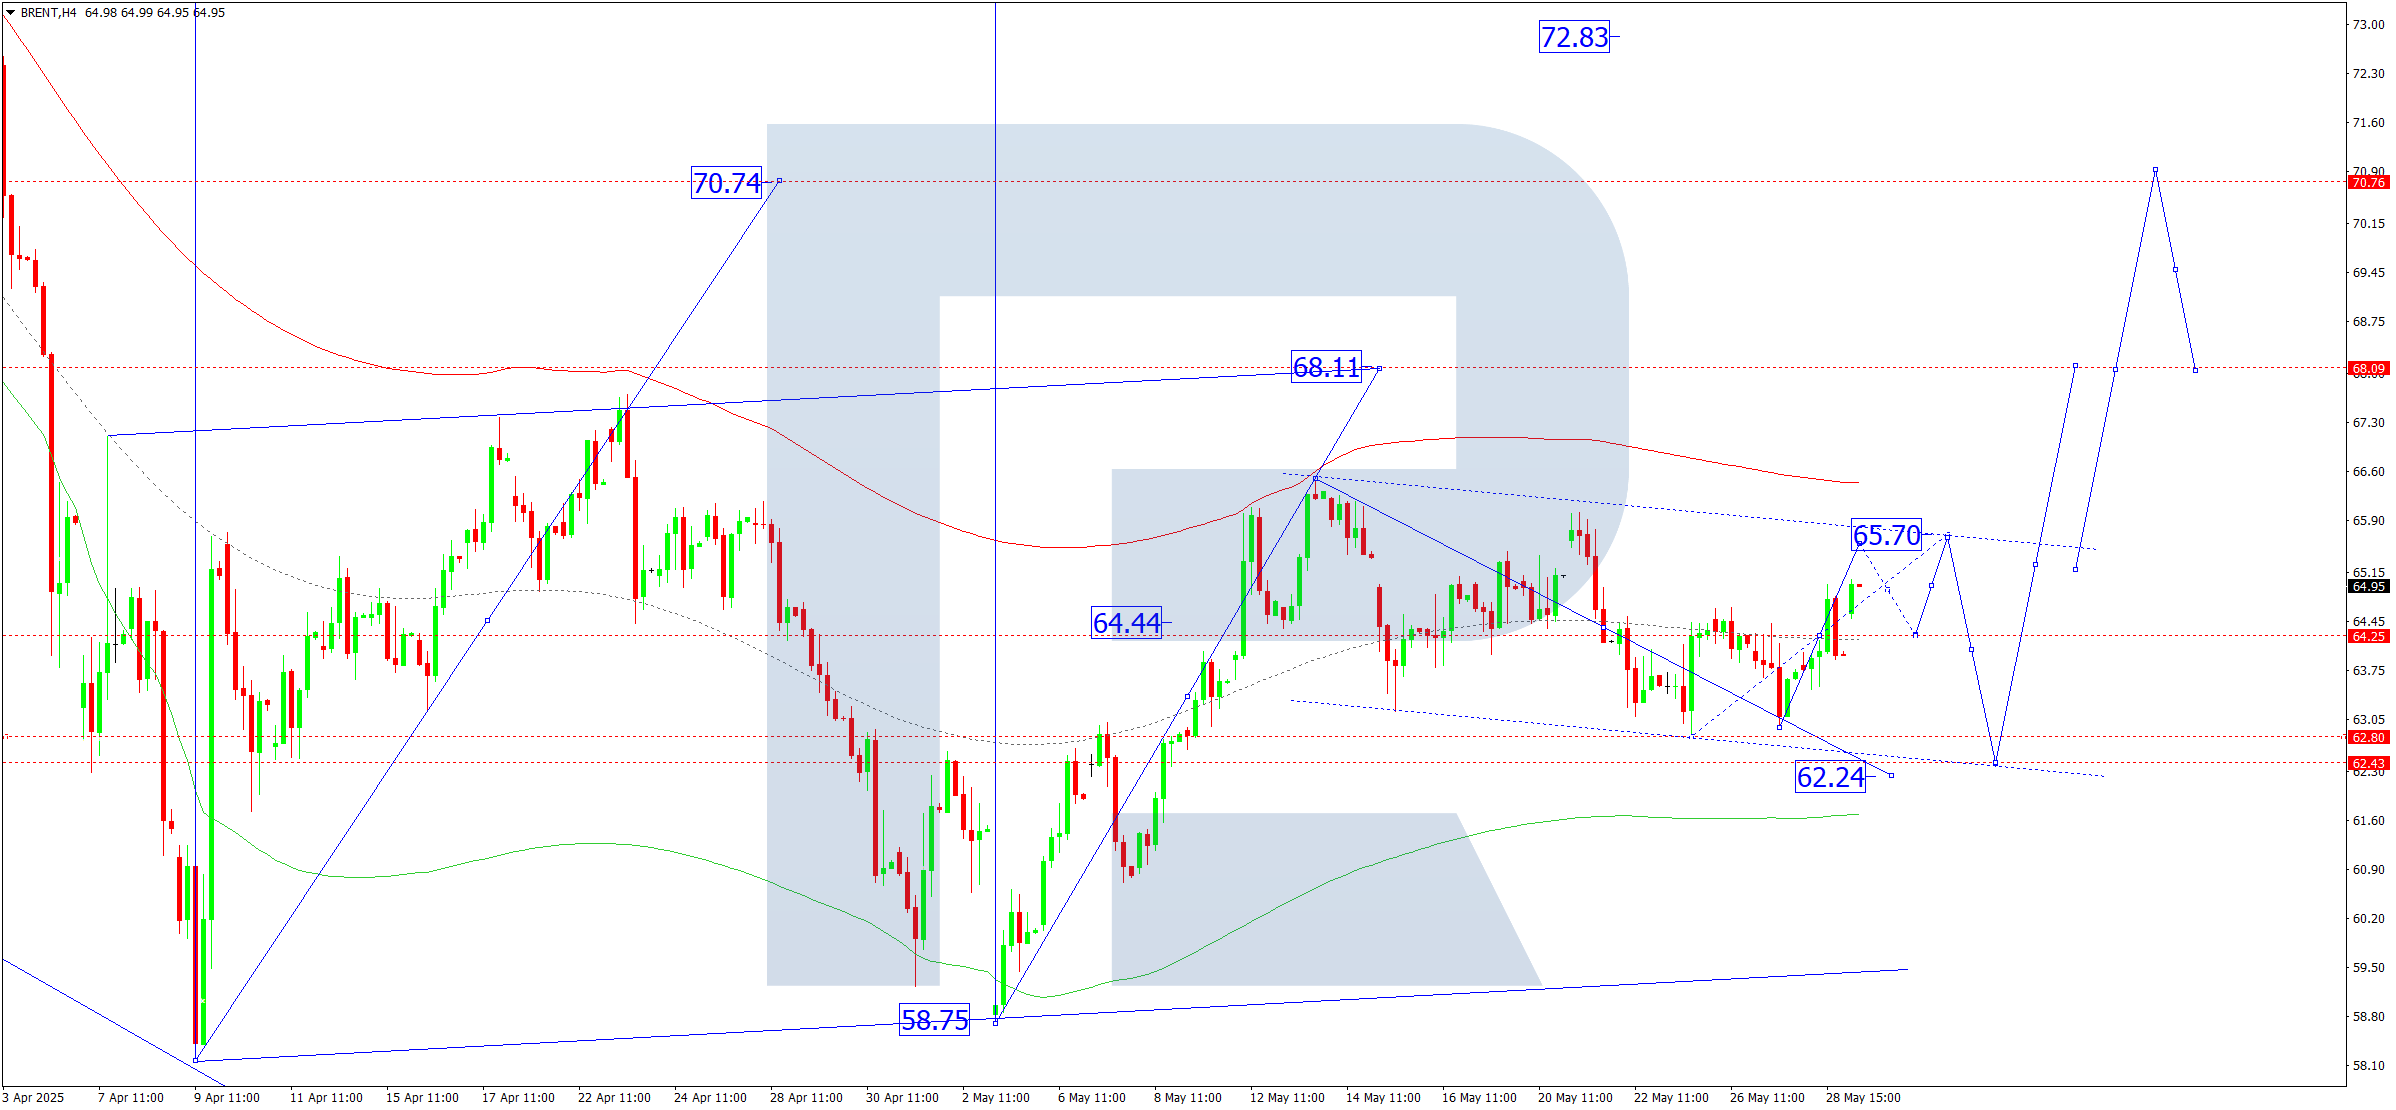
On the H4 chart of Brent crude, the market formed a consolidation range around 64.25 and broke upwards. Today, 29 May 2025, the range could expand towards 65.55, with potential continuation of the wave to 65.70. Afterwards, a decline to 62.22 may follow.
This scenario is supported by the Elliott wave structure and the upward wave matrix with a pivot at 64.44, seen as key for Brent. The market is currently developing a consolidation around the central line of the Price Envelope at 64.25. A move to the upper boundary at 65.70 is possible, followed by a decline to the lower boundary at 62.22.
Technical indicators for today’s Brent forecast suggest a rise to 65.70.
Forecasts presented in this section only reflect the author’s private opinion and should not be considered as guidance for trading. RoboForex bears no responsibility for trading results based on trading recommendations described in these analytical reviews.