Daily technical analysis and forecast for 23 October 2025
Here is a detailed daily technical analysis and forecast for EURUSD, USDJPY, GBPUSD, AUDUSD, USDCAD, XAUUSD and Brent for 23 October 2025.
EURUSD forecast
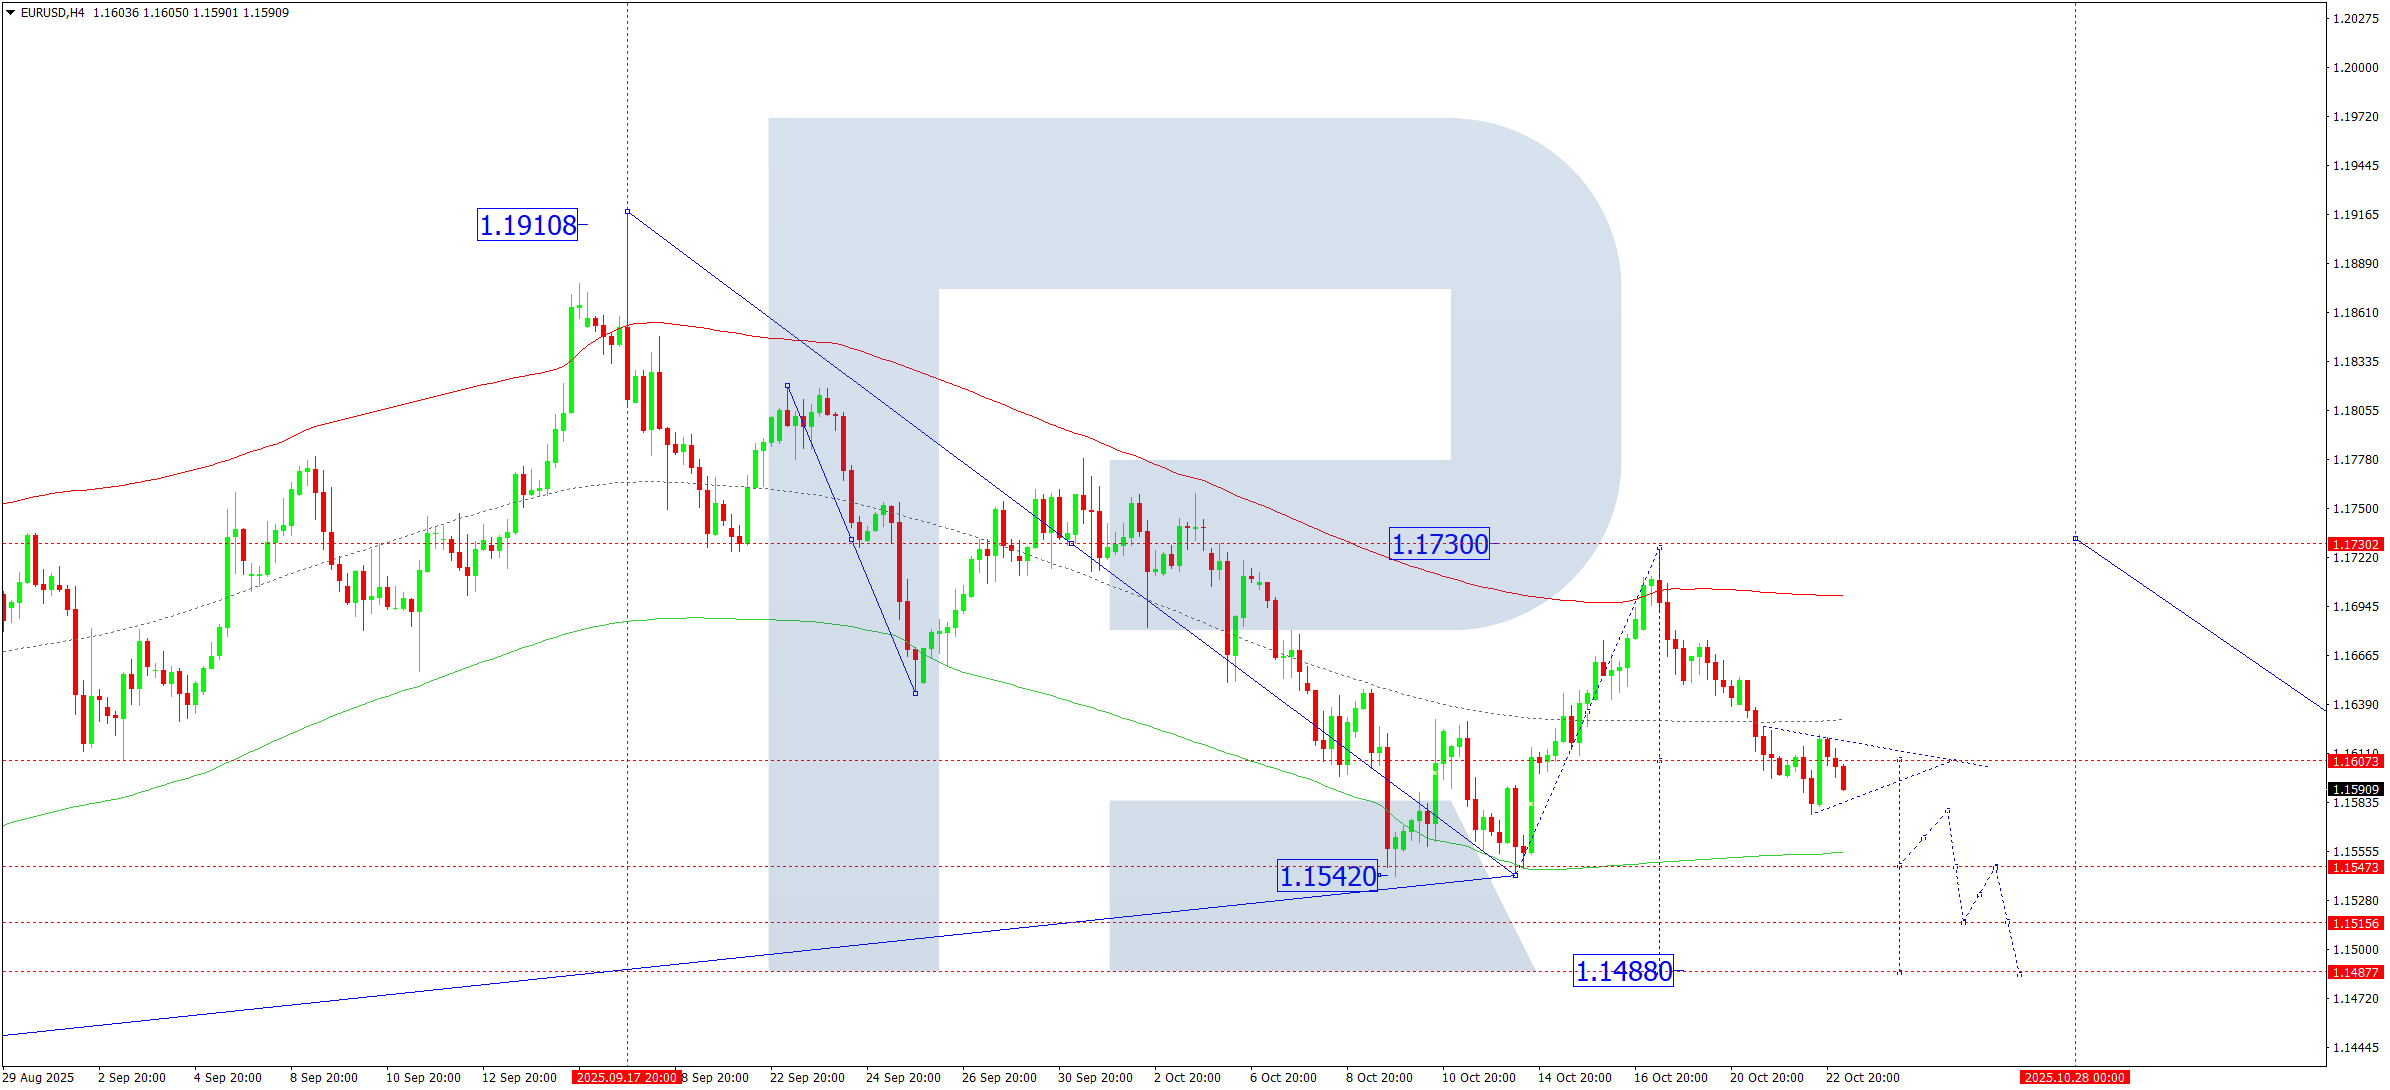
On the H4 chart of EURUSD, the market completed a downward wave towards 1.1577. Currently, a consolidation range is forming around 1.1606. On 23 October 2025, if the range breaks upwards, a corrective move towards 1.1666 is possible. A downside breakout would open potential for continuation towards 1.1540, with prospects of extending the trend to 1.1488. This represents only half of the third downward wave within the main downtrend.
Technically, this scenario is confirmed by the Elliott Wave structure and the bearish wave matrix with a pivot point at 1.1730, considered key in EURUSD’s wave structure. A decline towards the lower boundary of the Price Envelope at 1.1540 is expected, followed by a rise to its central line at 1.1606.
Technical indicators for today’s EURUSD forecast suggest a decline towards 1.1540.
USDJPY forecast
On the H4 chart of USDJPY, the market formed a consolidation range around 151.77 and broke it upwards. On 23 October 2025, the pair is expected to extend its growth towards 153.25, and a breakout above this level would open potential for a continued move towards 154.30 as a local target.
Technically, this scenario is supported by the Elliott Wave structure and the bullish wave matrix with a pivot point at 149.75, the key level for this wave. The market has consolidated around the central line of the Price Envelope at 151.77, and expansion towards 153.25 is expected, with prospects of continuing the upward wave to its upper boundary at 154.30.
Technical indicators for today’s USDJPY forecast suggest potential growth towards 154.30.

GBPUSD forecast
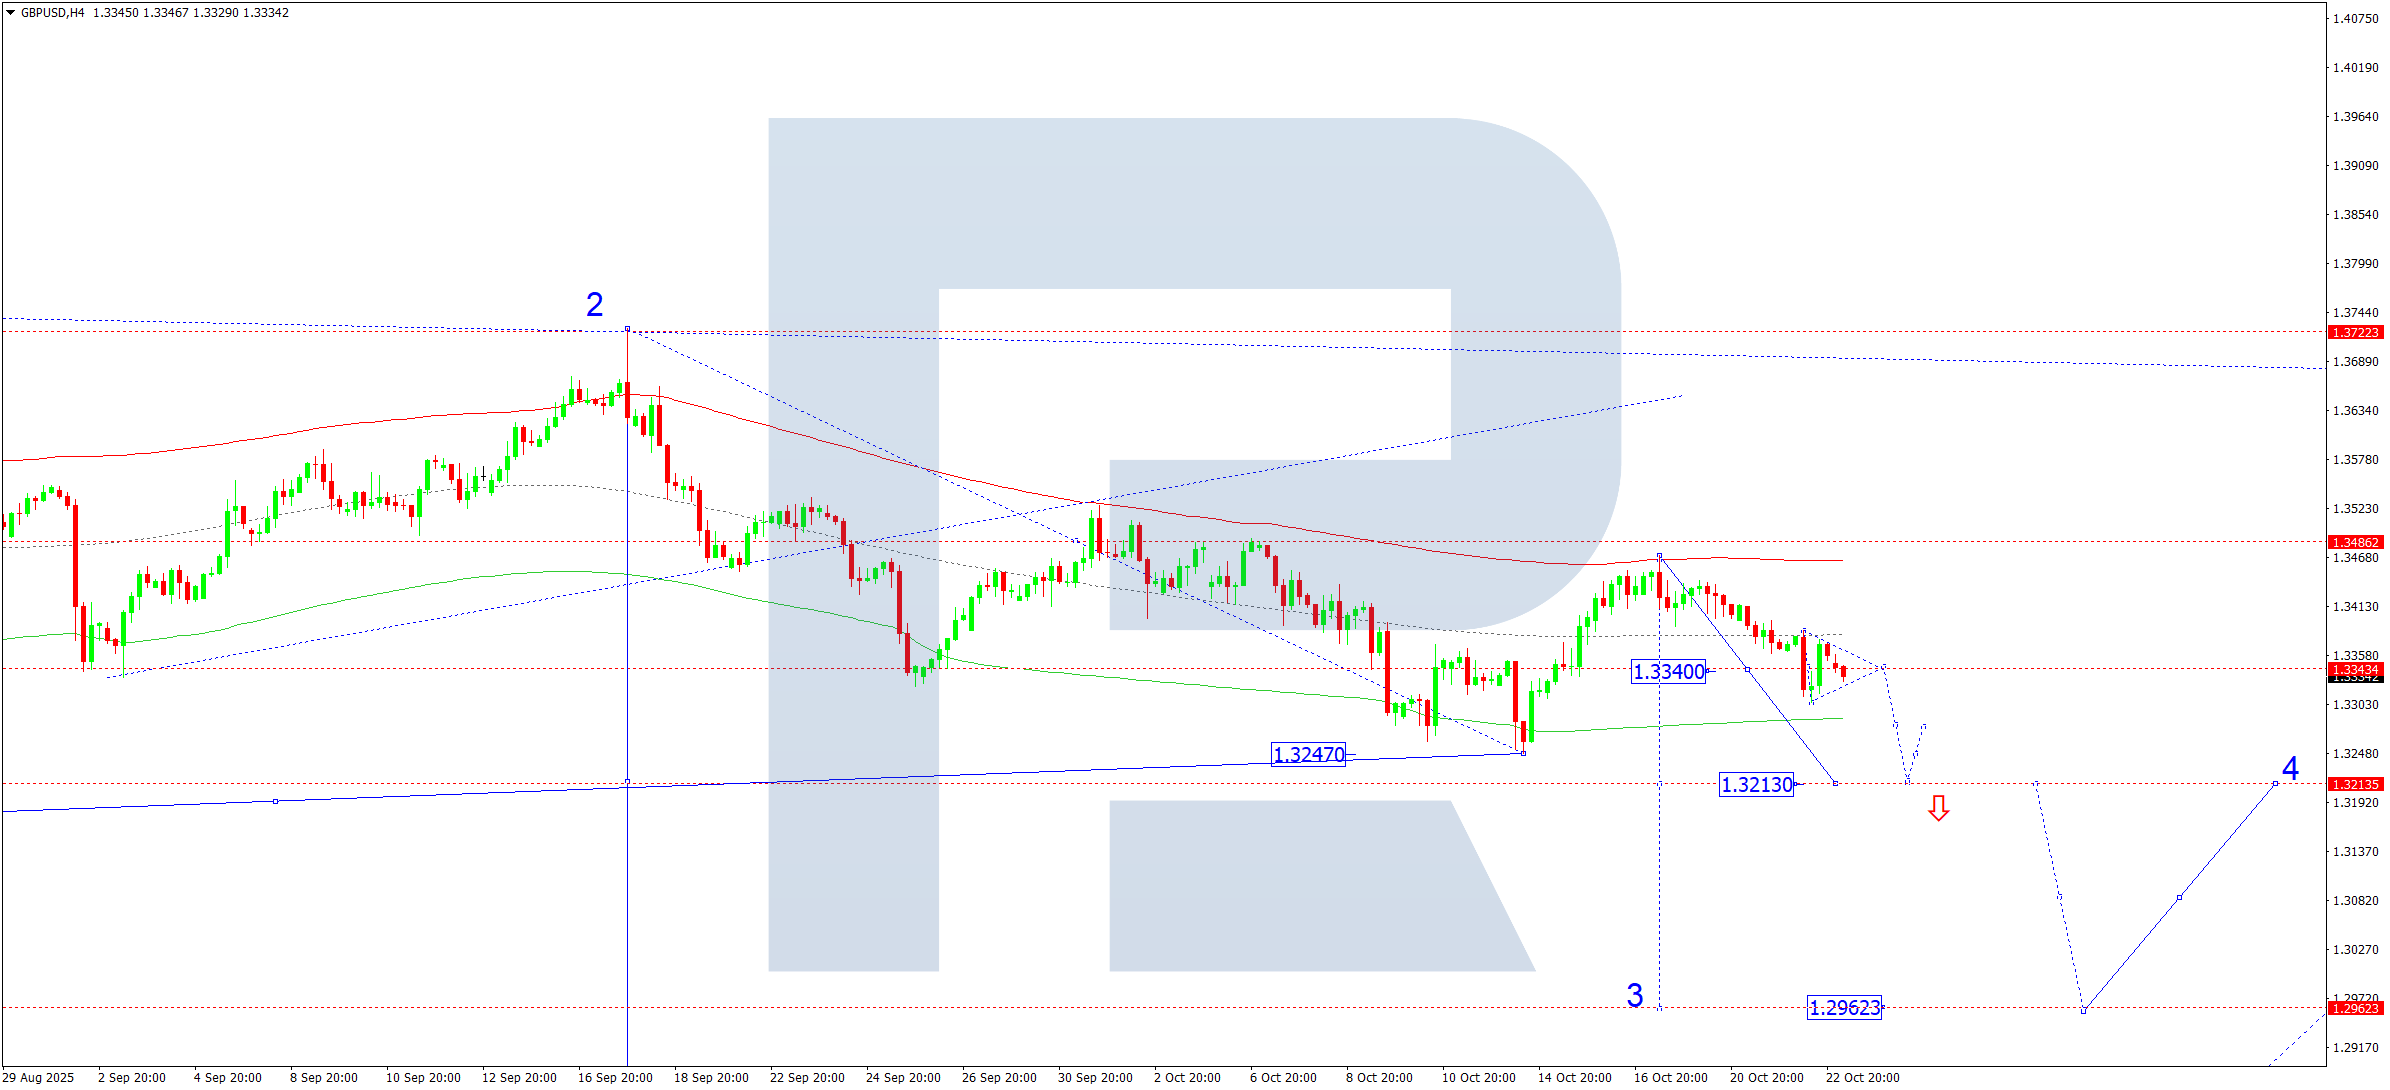
On the H4 chart of GBPUSD, the market formed a consolidation range around 1.3340. On 23 October 2025, an upward breakout could trigger a corrective move towards 1.3400, while a downward breakout would continue the third wave of decline along the downtrend, with the next target at 1.3213 – only halfway through the current downward wave.
Technically, this scenario is confirmed by the Elliott Wave structure and the bearish wave matrix with a pivot point at 1.3490, viewed as key in this wave. The market is consolidating around the central line of the Price Envelope at 1.3340. A downside breakout is expected towards the lower boundary at 1.3213.
Technical indicators for today’s GBPUSD forecast suggest a decline towards 1.3213.
AUDUSD forecast
On the H4 chart of AUDUSD, the market continues to form a compact consolidation range around 0.6484 without a clear direction. On 23 October 2025, if the range breaks upwards, expansion towards 0.6525 is possible. A downside breakout would open potential for a decline towards 0.6415.
Technically, this scenario is supported by the Elliott Wave structure and the bearish wave matrix with a pivot point at 0.6525, which is key for this wave. The market completed a downward wave to the lower boundary of the Price Envelope at 0.6440 and a correction to the central line at 0.6524. A short-term rise to the upper boundary at 0.6530 is possible before a downward move towards 0.6415 resumes.
Technical indicators for today’s AUDUSD forecast suggest a possible rise towards 0.6530, followed by a decline to 0.6415.

USDCAD forecast
On the H4 chart of USDCAD, the market completed a correction towards 1.3975. On 23 October 2025, the pair is expected to start an upward move towards 1.4070. A breakout above this level would open potential for continuation towards 1.4160 as a local target.
Technically, this scenario is confirmed by the Elliott Wave structure and the bullish wave matrix with a pivot point at 1.3940, the key level for this wave. The market completed a corrective structure towards the lower boundary of the Price Envelope at 1.3975. A rise towards 1.4070 is anticipated, and a breakout above it would extend the trend towards the upper boundary at 1.4160. Later, a corrective move towards the central line at 1.3940 (testing from above) may follow.
Technical indicators for today’s USDCAD forecast suggest potential continuation of the upward wave towards 1.4070 and 1.4160.

XAUUSD forecast
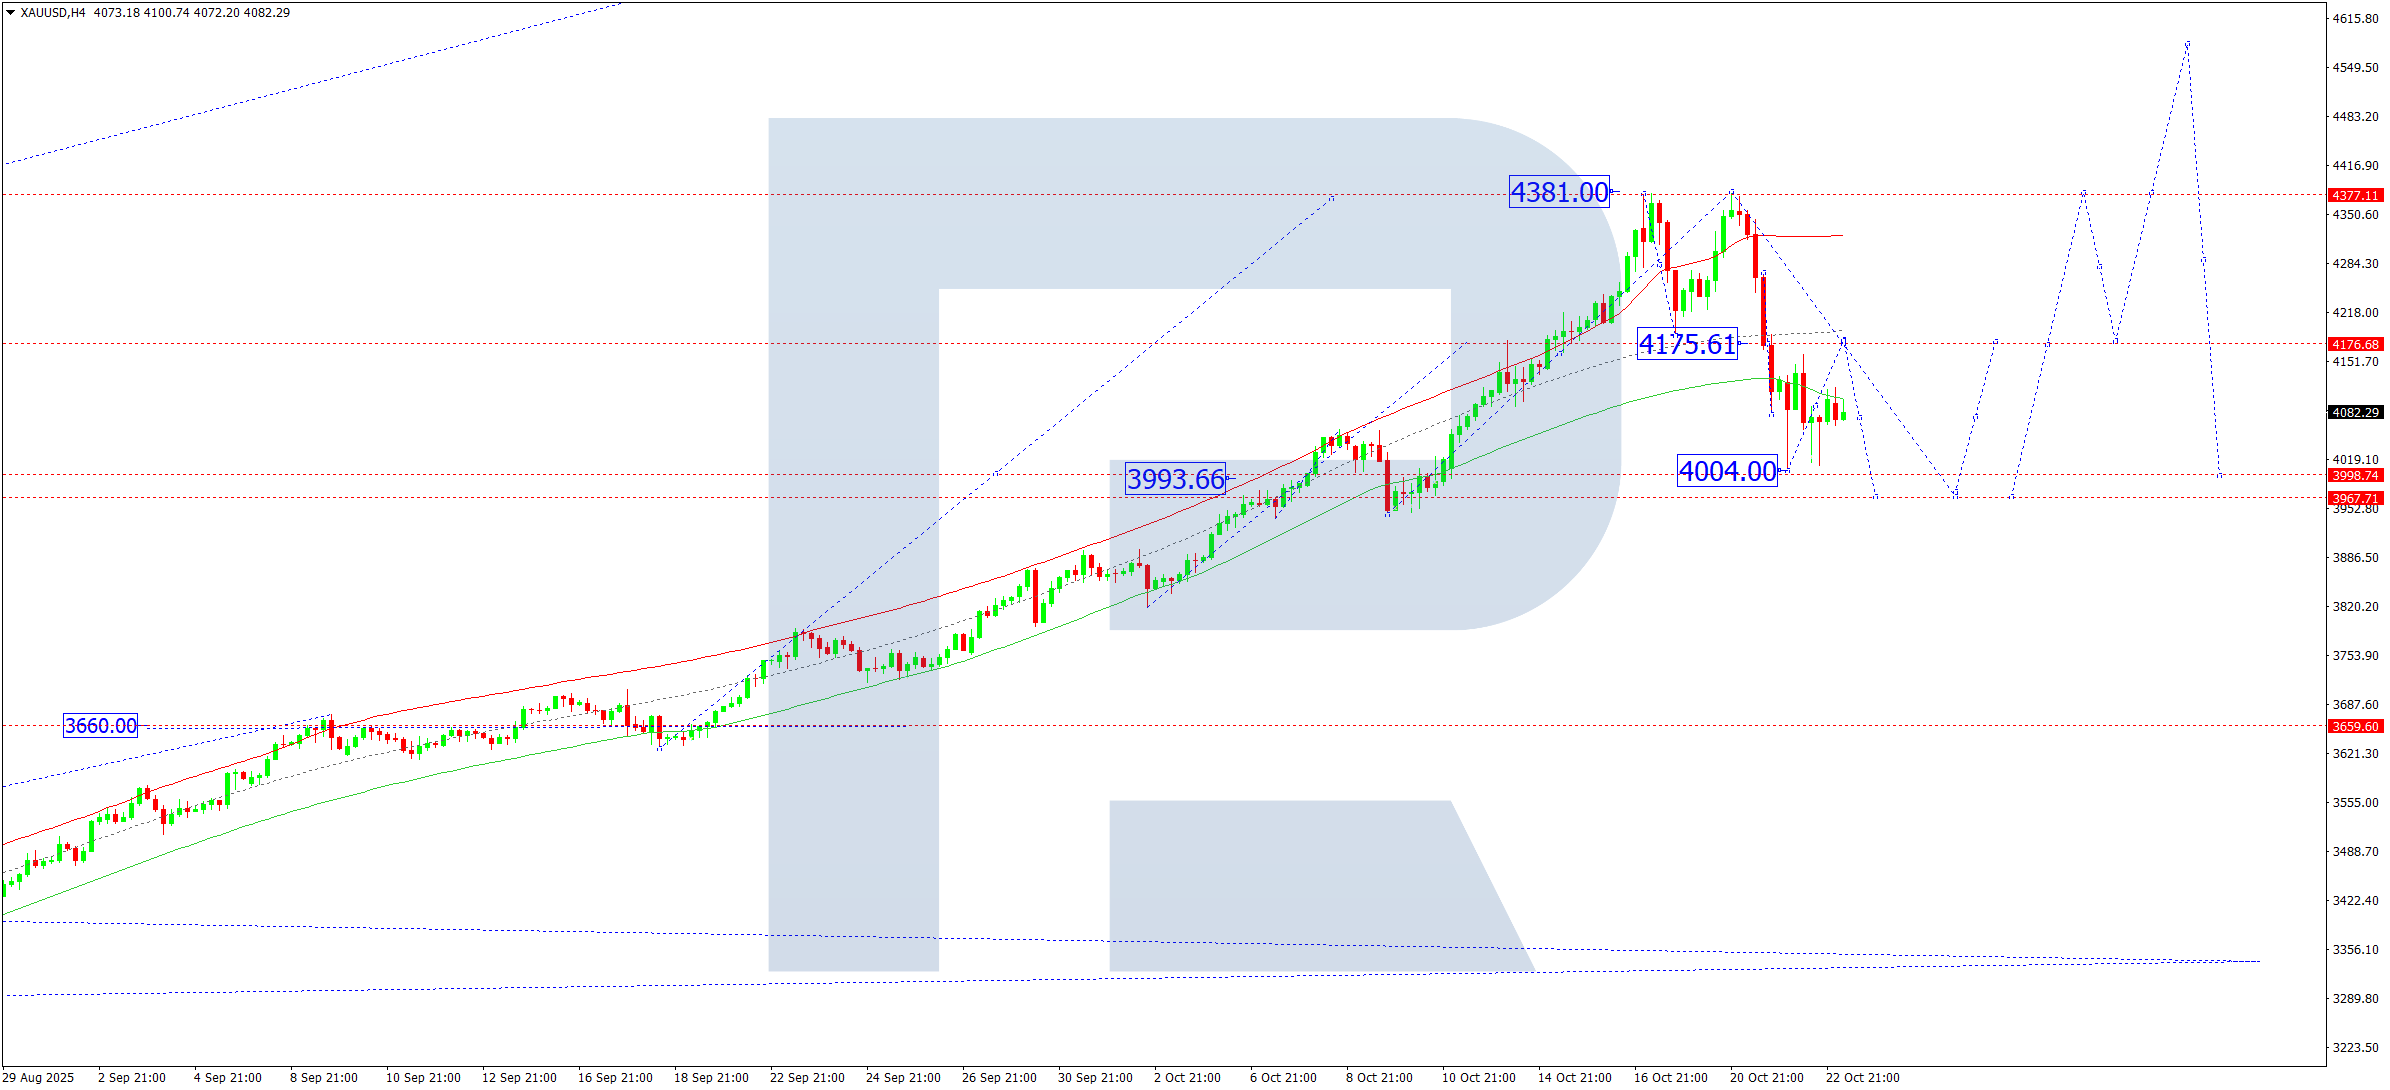
On the H4 chart of XAUUSD, the market continues to consolidate around 4,090. On 23 October 2025, expansion of the range upwards to 4,175 and downwards to 3,970 is possible. A downside breakout would open the door for a continued correction towards 3,666, while an upside breakout would open potential for the trend to extend towards 4,400.
Technically, this scenario is supported by the Elliott Wave structure and the bullish wave matrix with a pivot point at 3,660, the key level for this wave. The market is forming a corrective structure towards the lower boundary of the Price Envelope at 3,970, followed by a rise towards the upper boundary at 4,400.
Technical indicators for today’s XAUUSD forecast indicate potential continuation of the correction towards 3,970.
Brent forecast
On the H4 chart of Brent crude, the market broke above 62.17 and continues the upward wave towards 64.40. On 23 October 2025, the price is expected to reach this target. Afterwards, a correction towards 62.20 is possible, followed by growth towards 65.00 with prospects of extending the trend to 67.67.
Technically, this scenario is confirmed by the Elliott Wave structure and the bullish wave matrix with a pivot point at 62.20, the key level for this Brent wave. The market previously reached the lower boundary of the Price Envelope at 60.00. The outlook remains for growth towards the upper boundary at 65.00.
Technical indicators for today’s Brent forecast suggest potential growth towards 65.00 and 67.67.

Forecasts presented in this section only reflect the author’s private opinion and should not be considered as guidance for trading. RoboForex bears no responsibility for trading results based on trading recommendations described in these analytical reviews.