Daily technical analysis and forecast for 24 October 2025
Here is a detailed daily technical analysis and forecast for EURUSD, USDJPY, GBPUSD, AUDUSD, USDCAD, XAUUSD and Brent for 24 October 2025.
EURUSD forecast
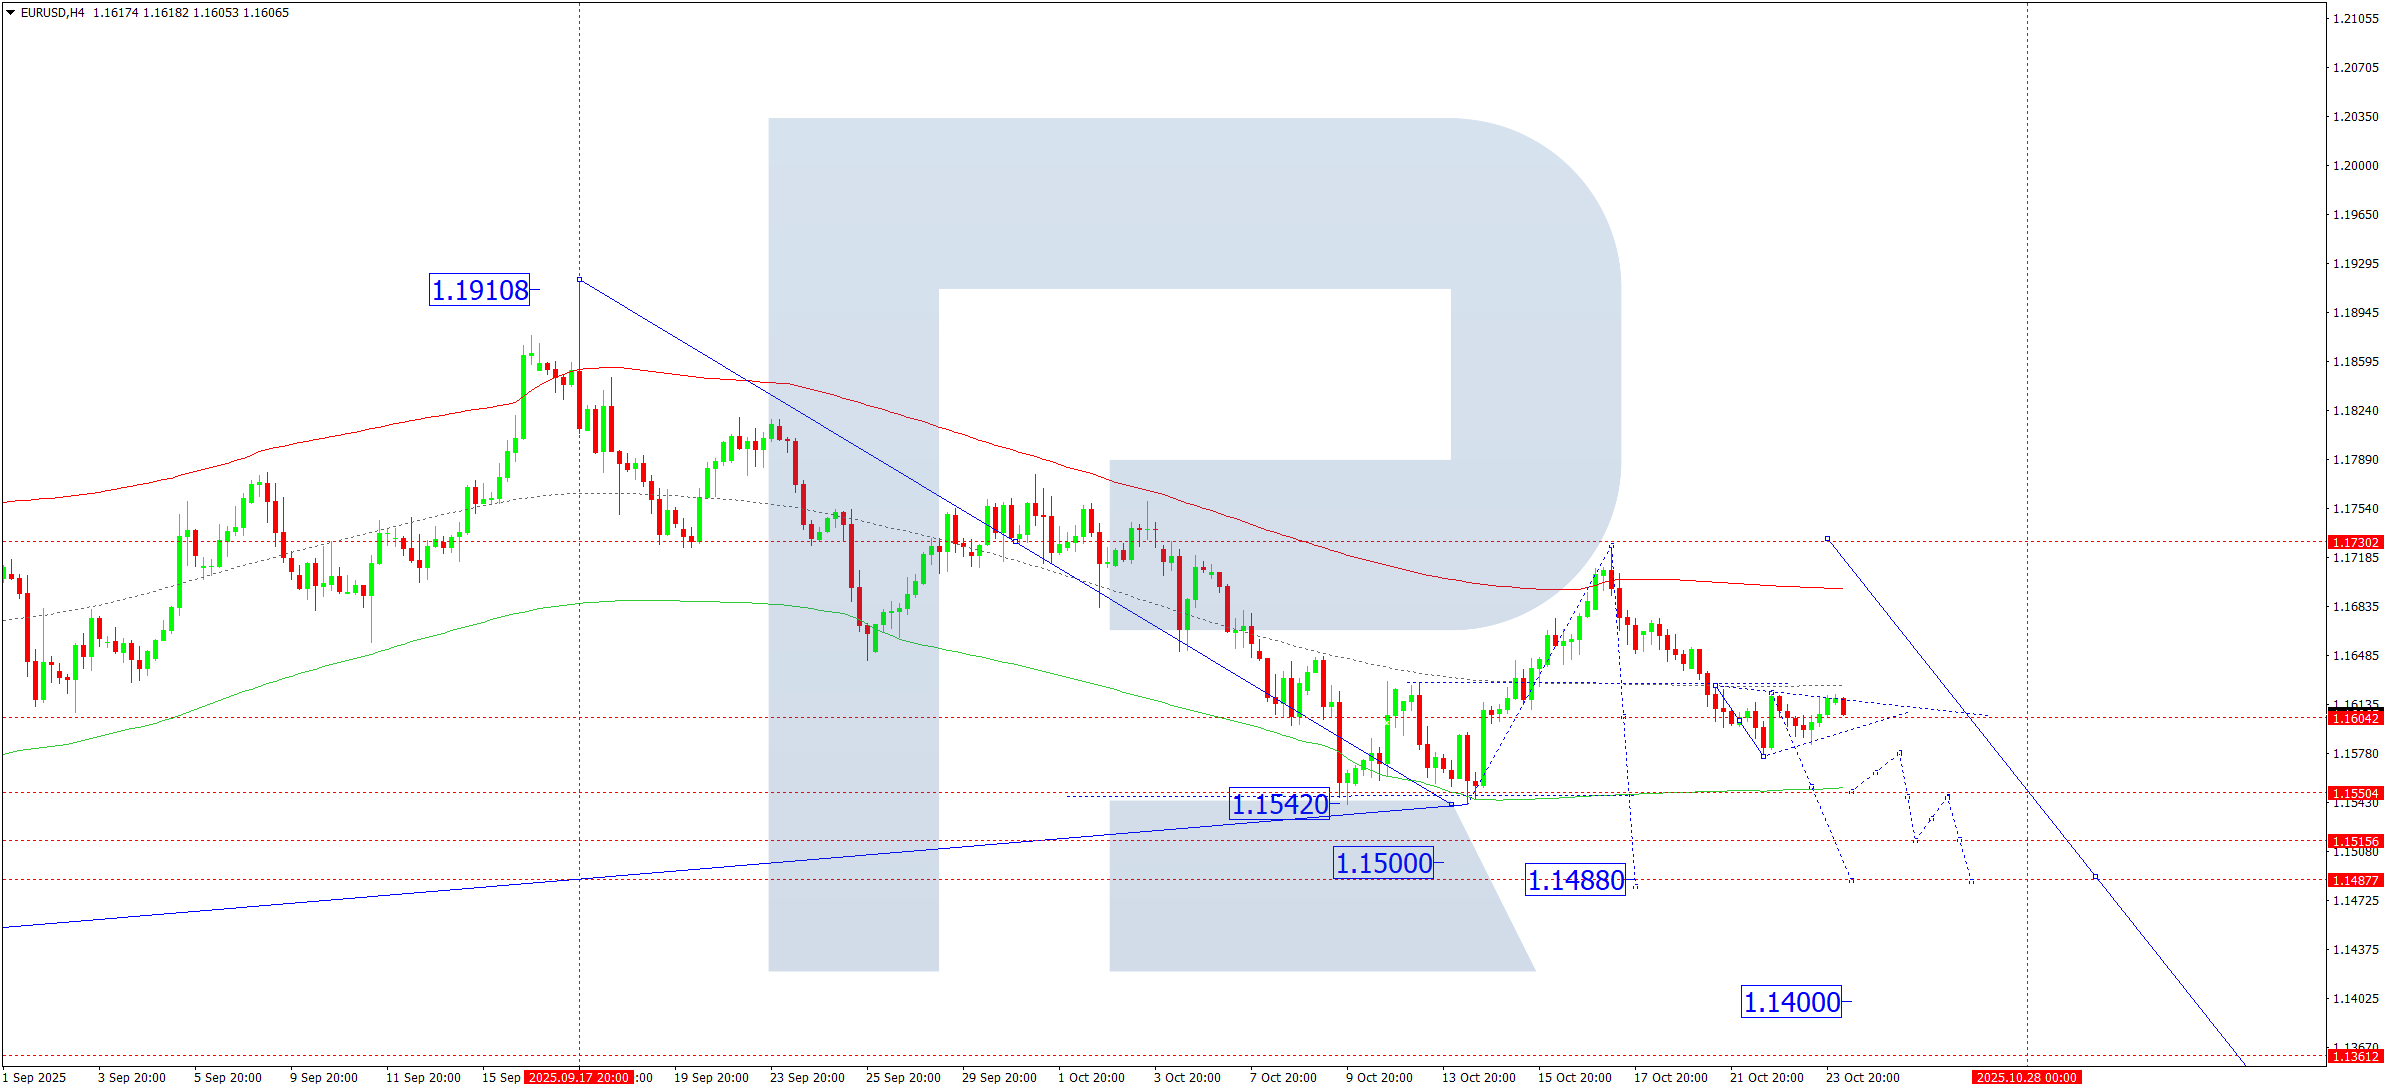
On the H4 chart of EURUSD, the market continues to form a compact consolidation range around 1.1604. On 24 October 2025, if the range breaks upwards, a corrective move towards 1.1650 is possible. A downward breakout would open potential for continued decline to 1.1550, with prospects of extending the trend to 1.1488. This represents only half of the third downward wave in the current downtrend, with the main third-wave target at 1.1240.
Technically, this scenario is confirmed by the Elliott Wave structure and the bearish wave matrix with a pivot point at 1.1730, which is viewed as key in the EURUSD wave structure. A move towards the lower boundary of the Price Envelope at 1.1550 is expected, followed by a rebound to its central line at 1.1606.
Technical indicators for today’s EURUSD forecast suggest a decline towards 1.1550.
USDJPY forecast
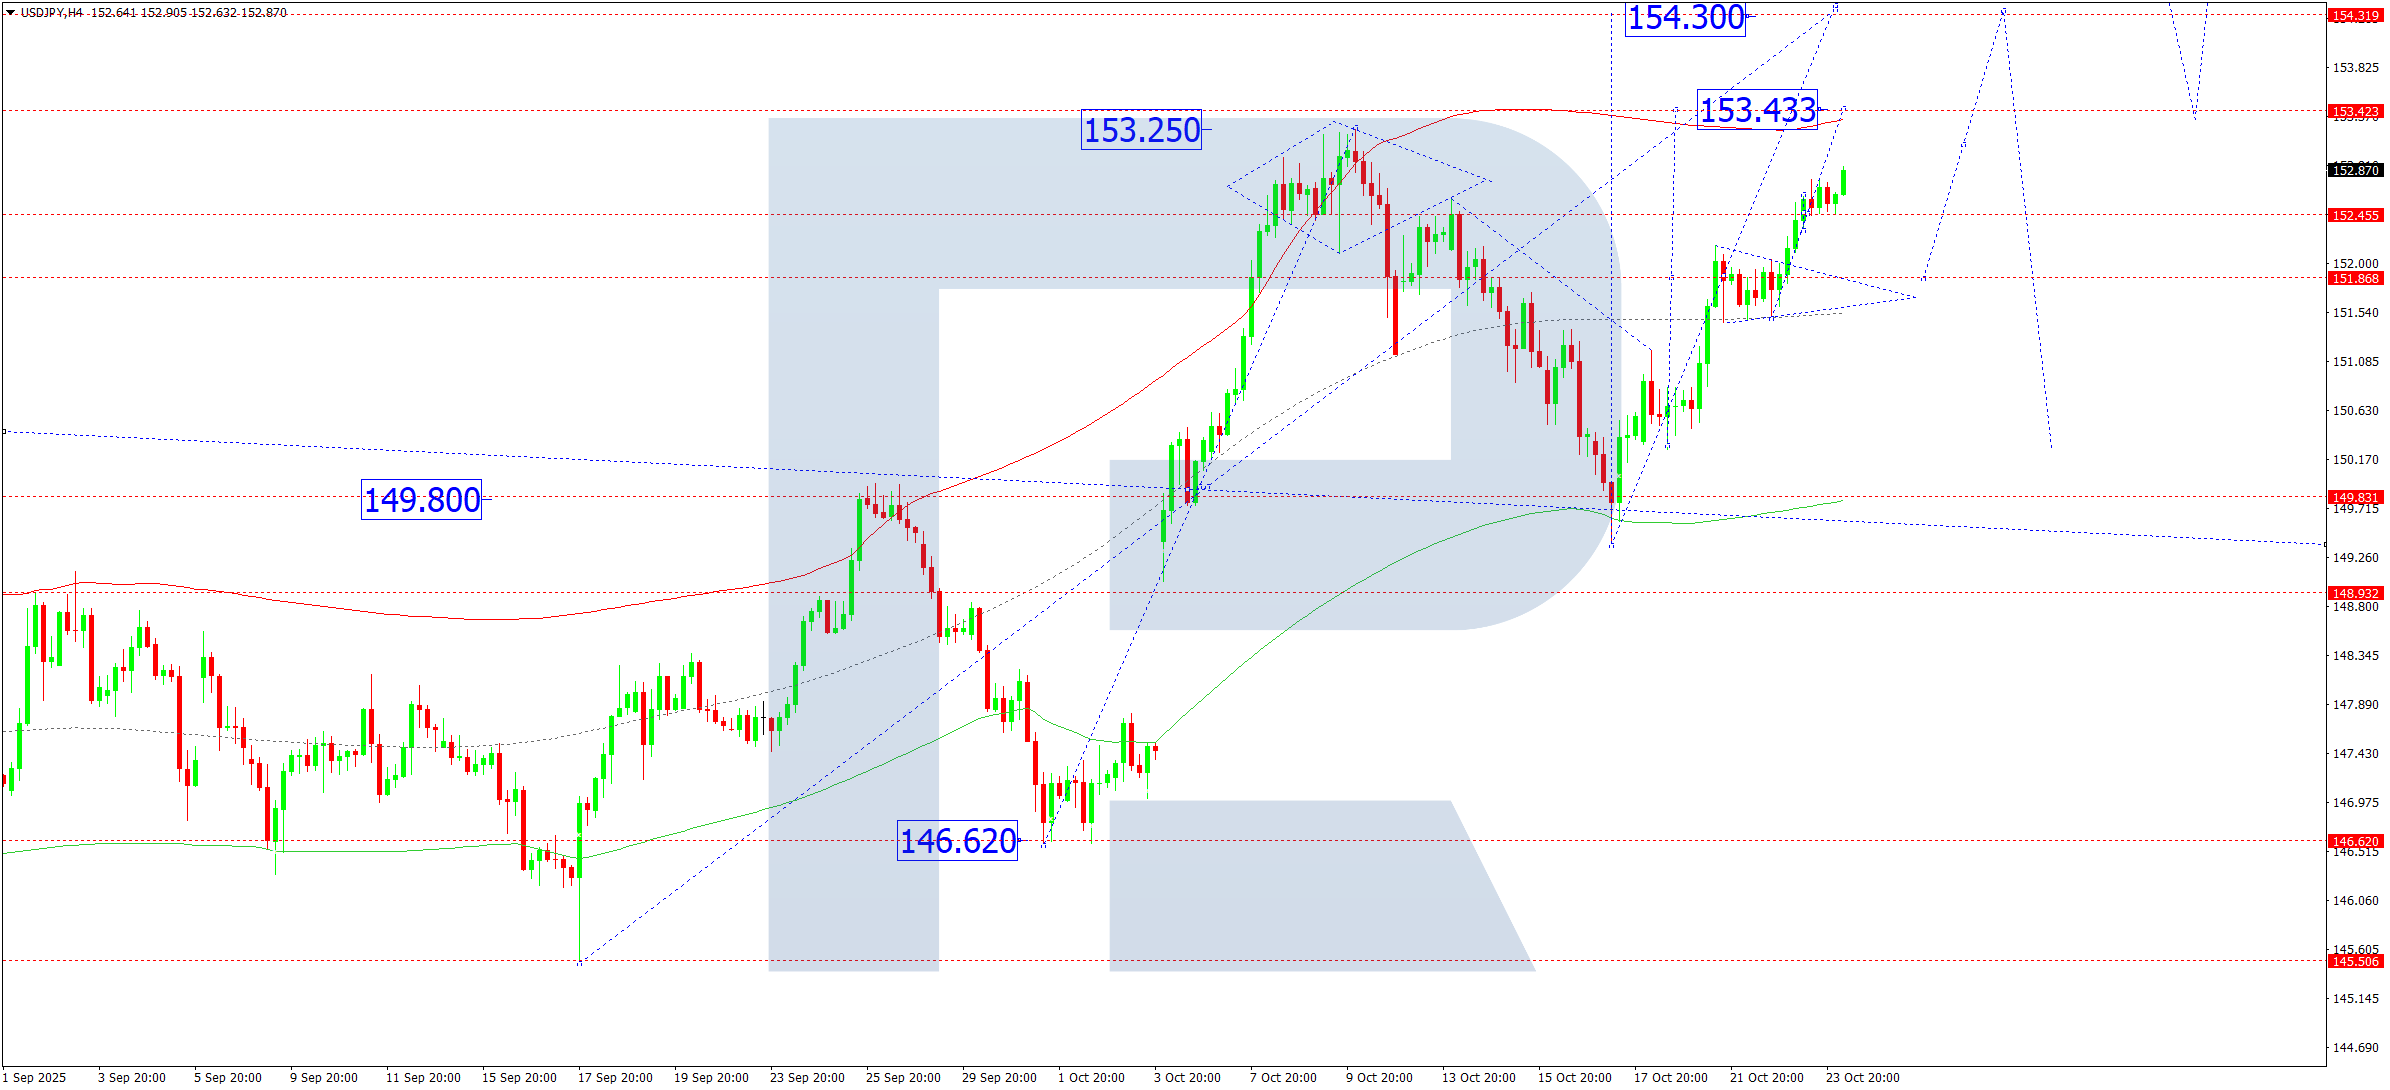
On the H4 chart of USDJPY, the market formed a compact consolidation range around 152.45 and broke it upwards. On 24 October 2025, an upward move towards 153.43 is expected. A breakout above this level would open potential for a further move towards 154.30, which is the local calculated target.
Technically, this scenario is supported by the Elliott Wave structure and the bullish wave matrix with a pivot point at 149.80, the key level in this wave. The market consolidated around the central line of the Price Envelope at 151.88 and is now expanding towards 153.43, with prospects of further growth to the upper boundary at 154.30. Technical indicators for today’s USDJPY forecast suggest the probability of a rise towards 154.30.
GBPUSD forecast
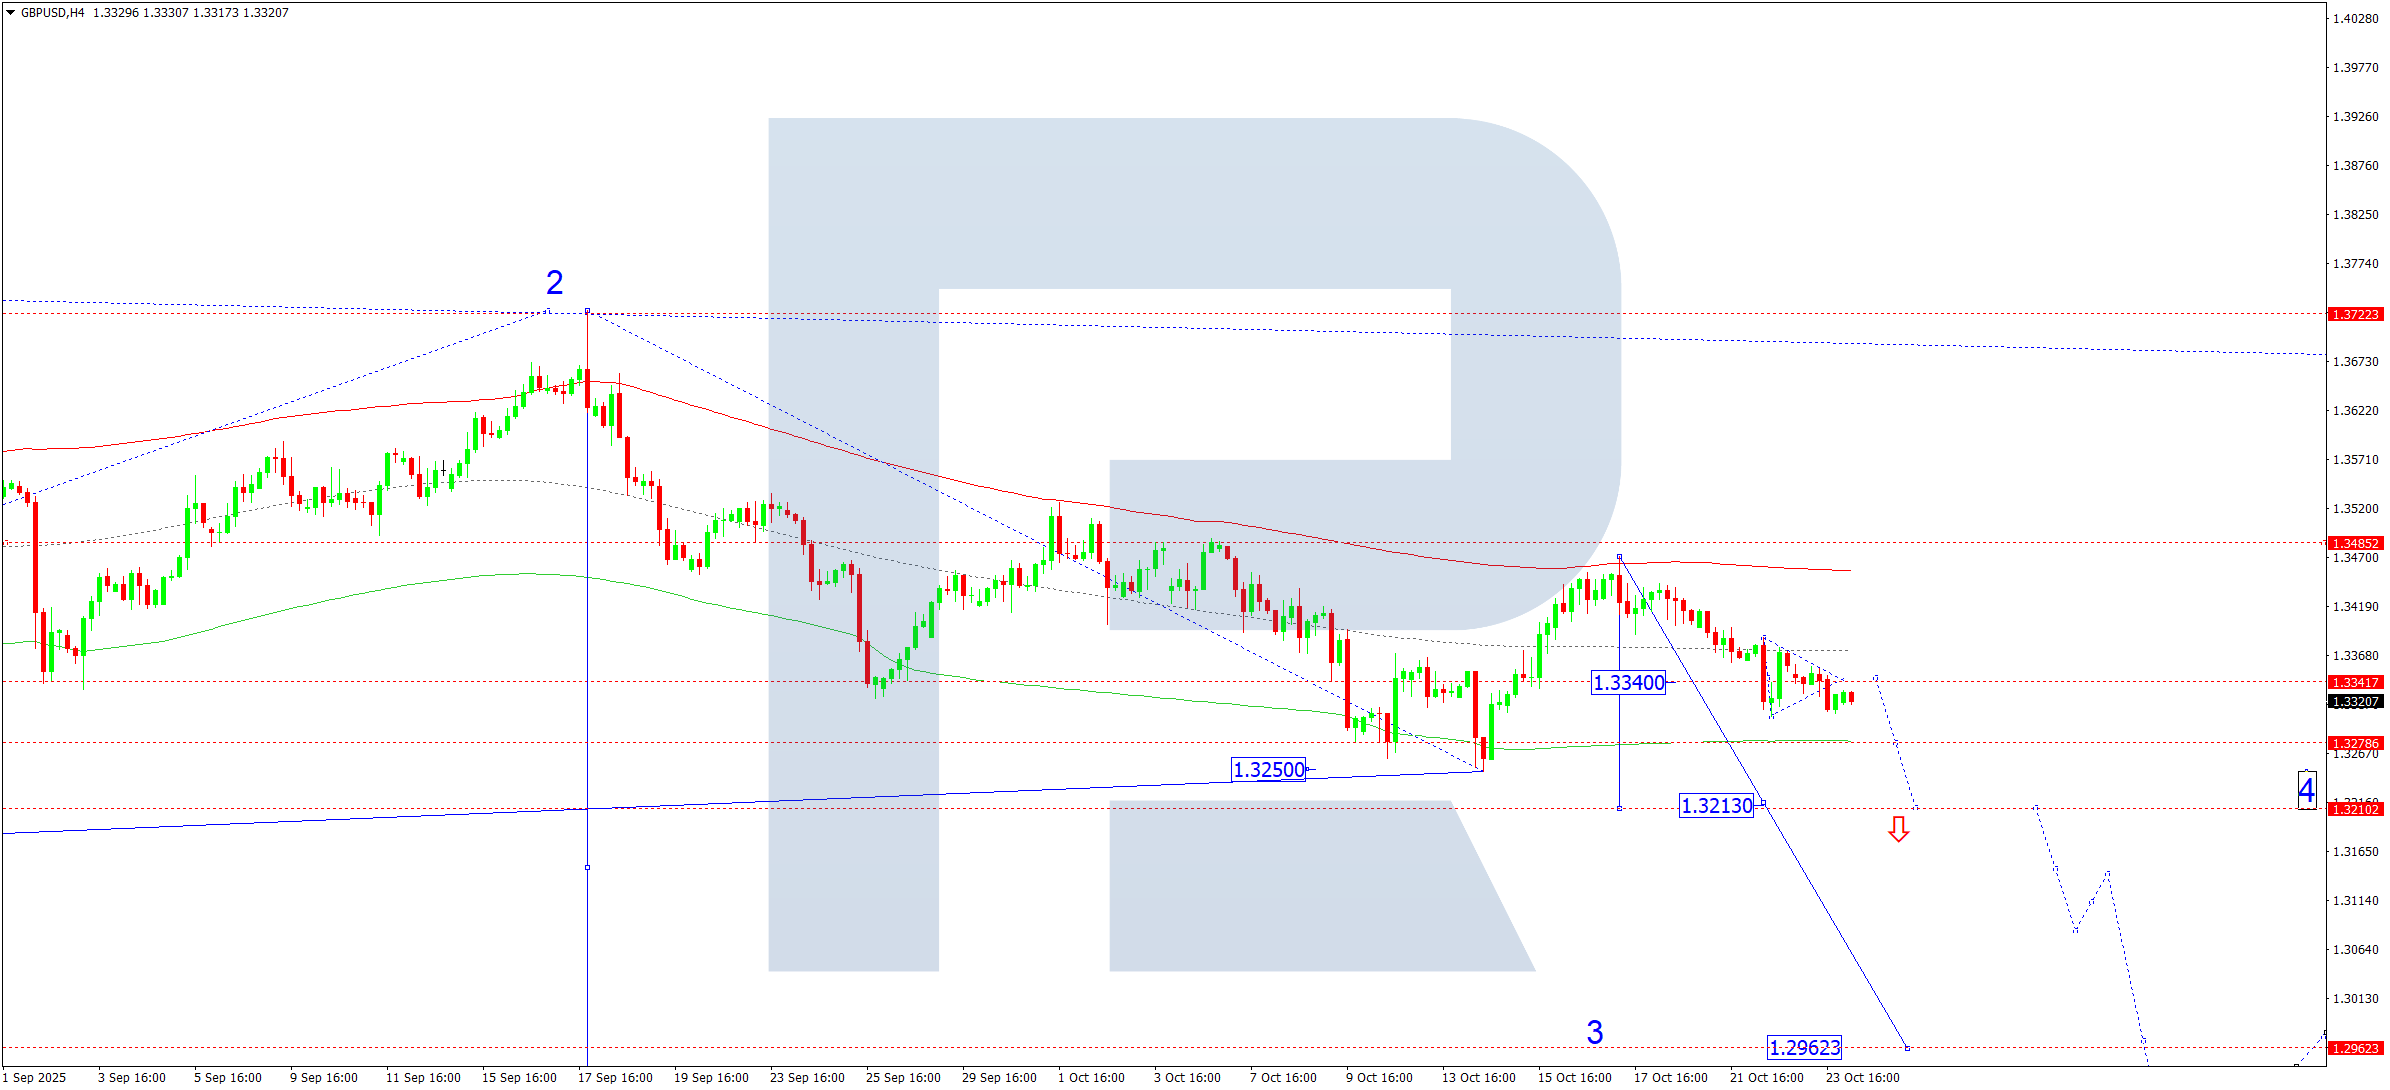
On the H4 chart of GBPUSD, the market formed a compact consolidation range around 1.3340. On 24 October 2025, if the range breaks upwards, a corrective wave towards 1.3400 is possible. A downward breakout would indicate continuation of the third wave of decline within the downtrend, with the next target at 1.3213. This represents only half of the downward wave, with the main target for the third wave located at 1.2962.
Technically, this scenario is confirmed by the Elliott Wave structure and the bearish wave matrix with a pivot point at 1.3490, considered key in this wave. The market is consolidating around the central line of the Price Envelope at 1.3340. A downward breakout would likely lead to a move towards the lower boundary at 1.3213.
Technical indicators for today’s GBPUSD forecast suggest a decline towards 1.3213.
AUDUSD forecast
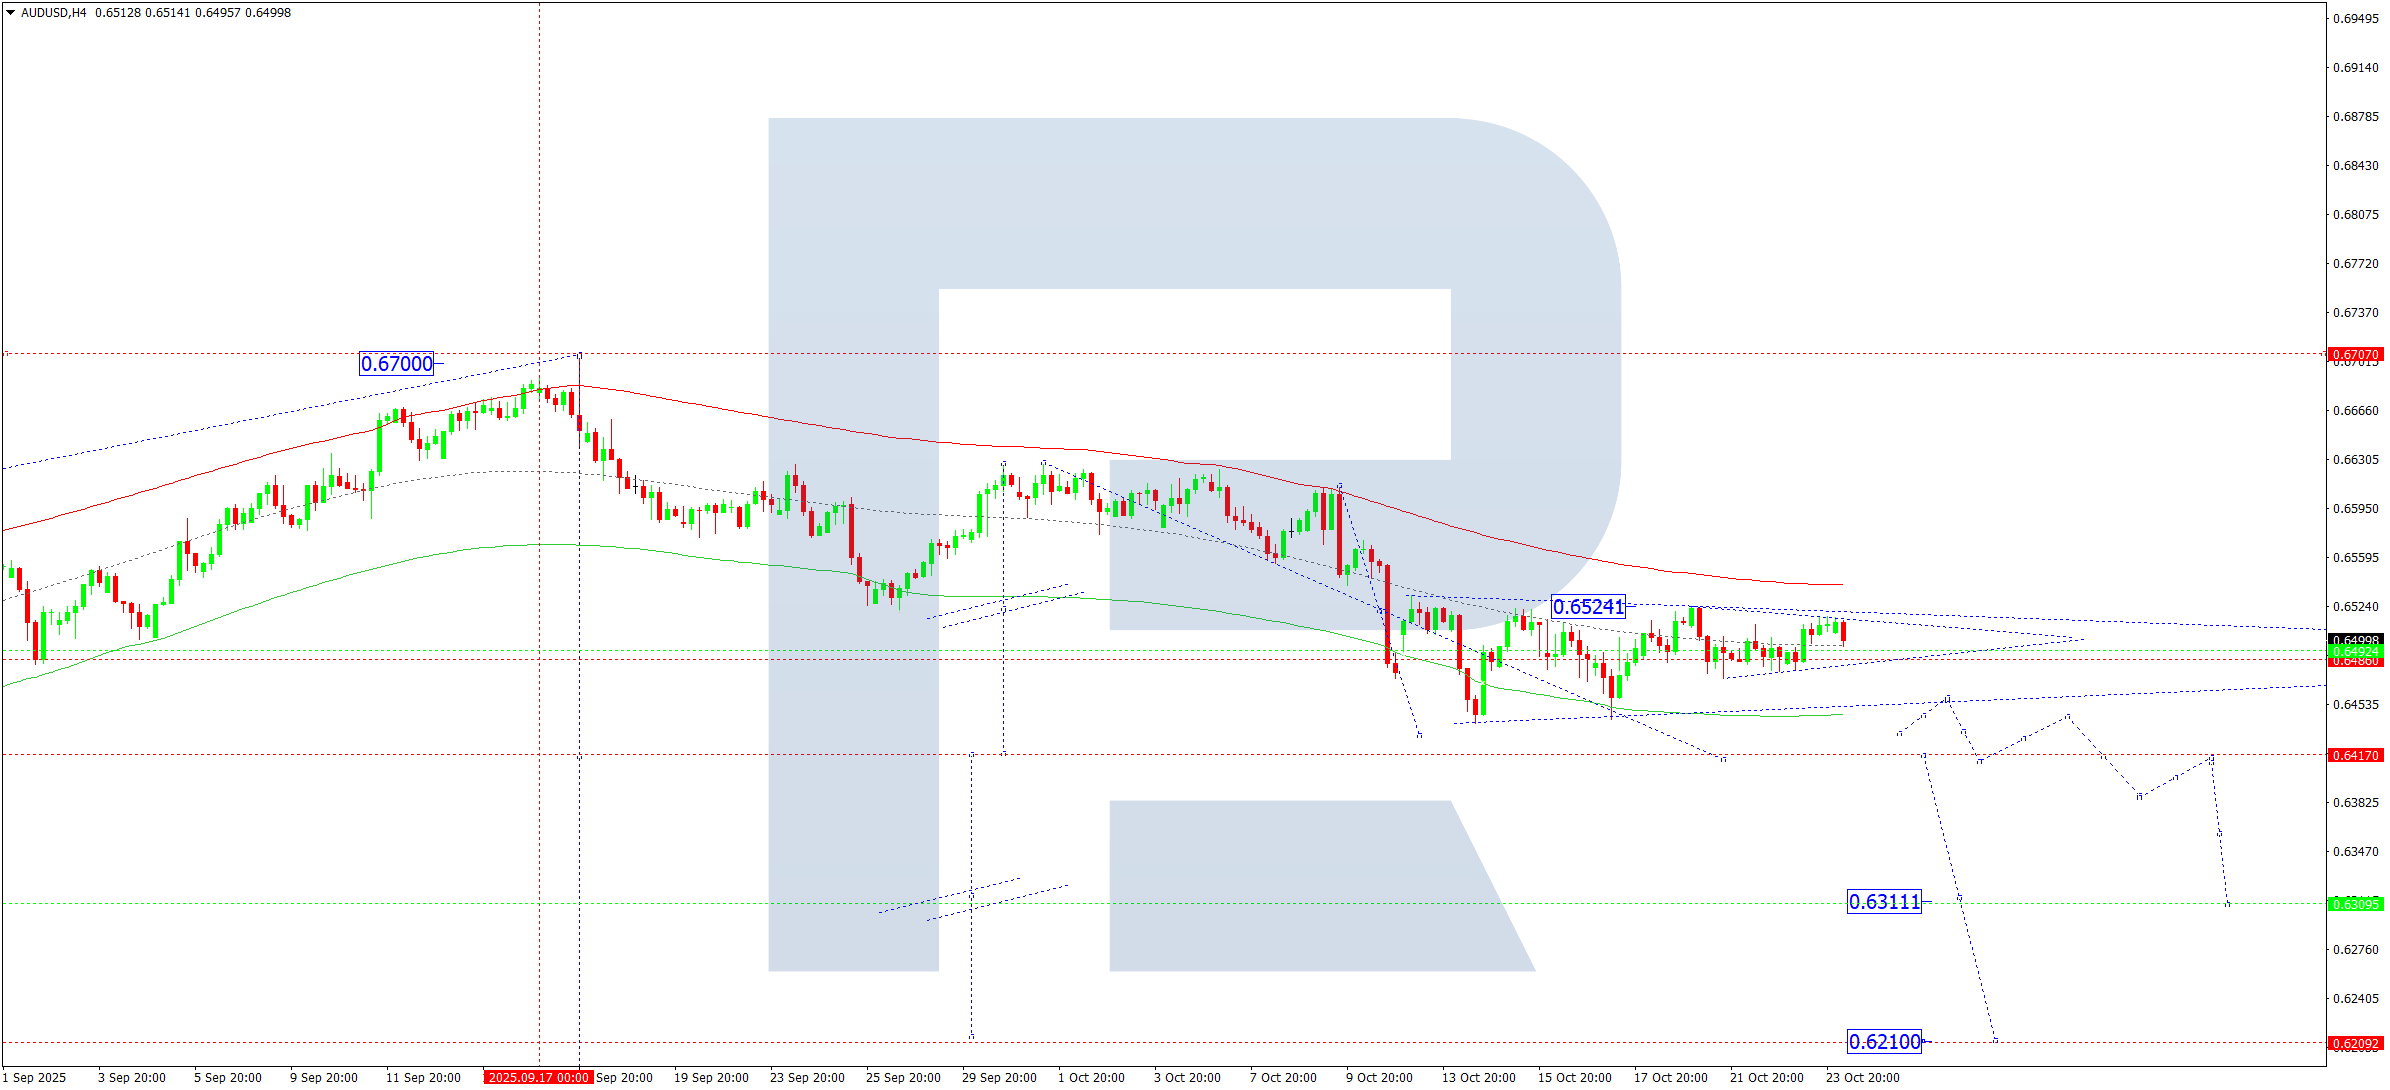
On the H4 chart of AUDUSD, the market continues to develop a compact consolidation range around 0.6484 without a clear direction. On 24 October 2025, if the range breaks upwards, expansion towards 0.6525 is possible. A downward breakout could extend the range to 0.6415.
Technically, this scenario is supported by the Elliott Wave structure and the bearish wave matrix with a pivot point at 0.6525, which is key for this wave. The market completed a downward wave to the lower boundary of the Price Envelope at 0.6440 and a correction towards its central line at 0.6524. A rise towards the upper boundary at 0.6530 may occur, followed by a decline to the lower boundary at 0.6415.
Technical indicators for today’s AUDUSD forecast suggest considering a possible rise towards 0.6530 and the beginning of a downward wave to 0.6415.
USDCAD forecast
On the H4 chart of USDCAD, the market completed a correction towards 1.3973. On 24 October 2025, an upward move towards 1.4070 is expected. A breakout above this level would open potential for continuation of the growth wave towards 1.4160, which is a local estimated target.
Technically, this scenario is confirmed by the Elliott Wave structure and the bullish wave matrix with a pivot point at 1.3940, the key level in this wave. The market completed a corrective structure to the lower boundary of the Price Envelope at 1.3973. A rise towards 1.4070 is expected, and a breakout above it would extend the trend towards the upper boundary at 1.4160. Later, a corrective move towards the central line at 1.3940 (testing from above) is possible.
Technical indicators for today’s USDCAD forecast suggest the growth wave could continue towards 1.4070 and 1.4160.

XAUUSD forecast
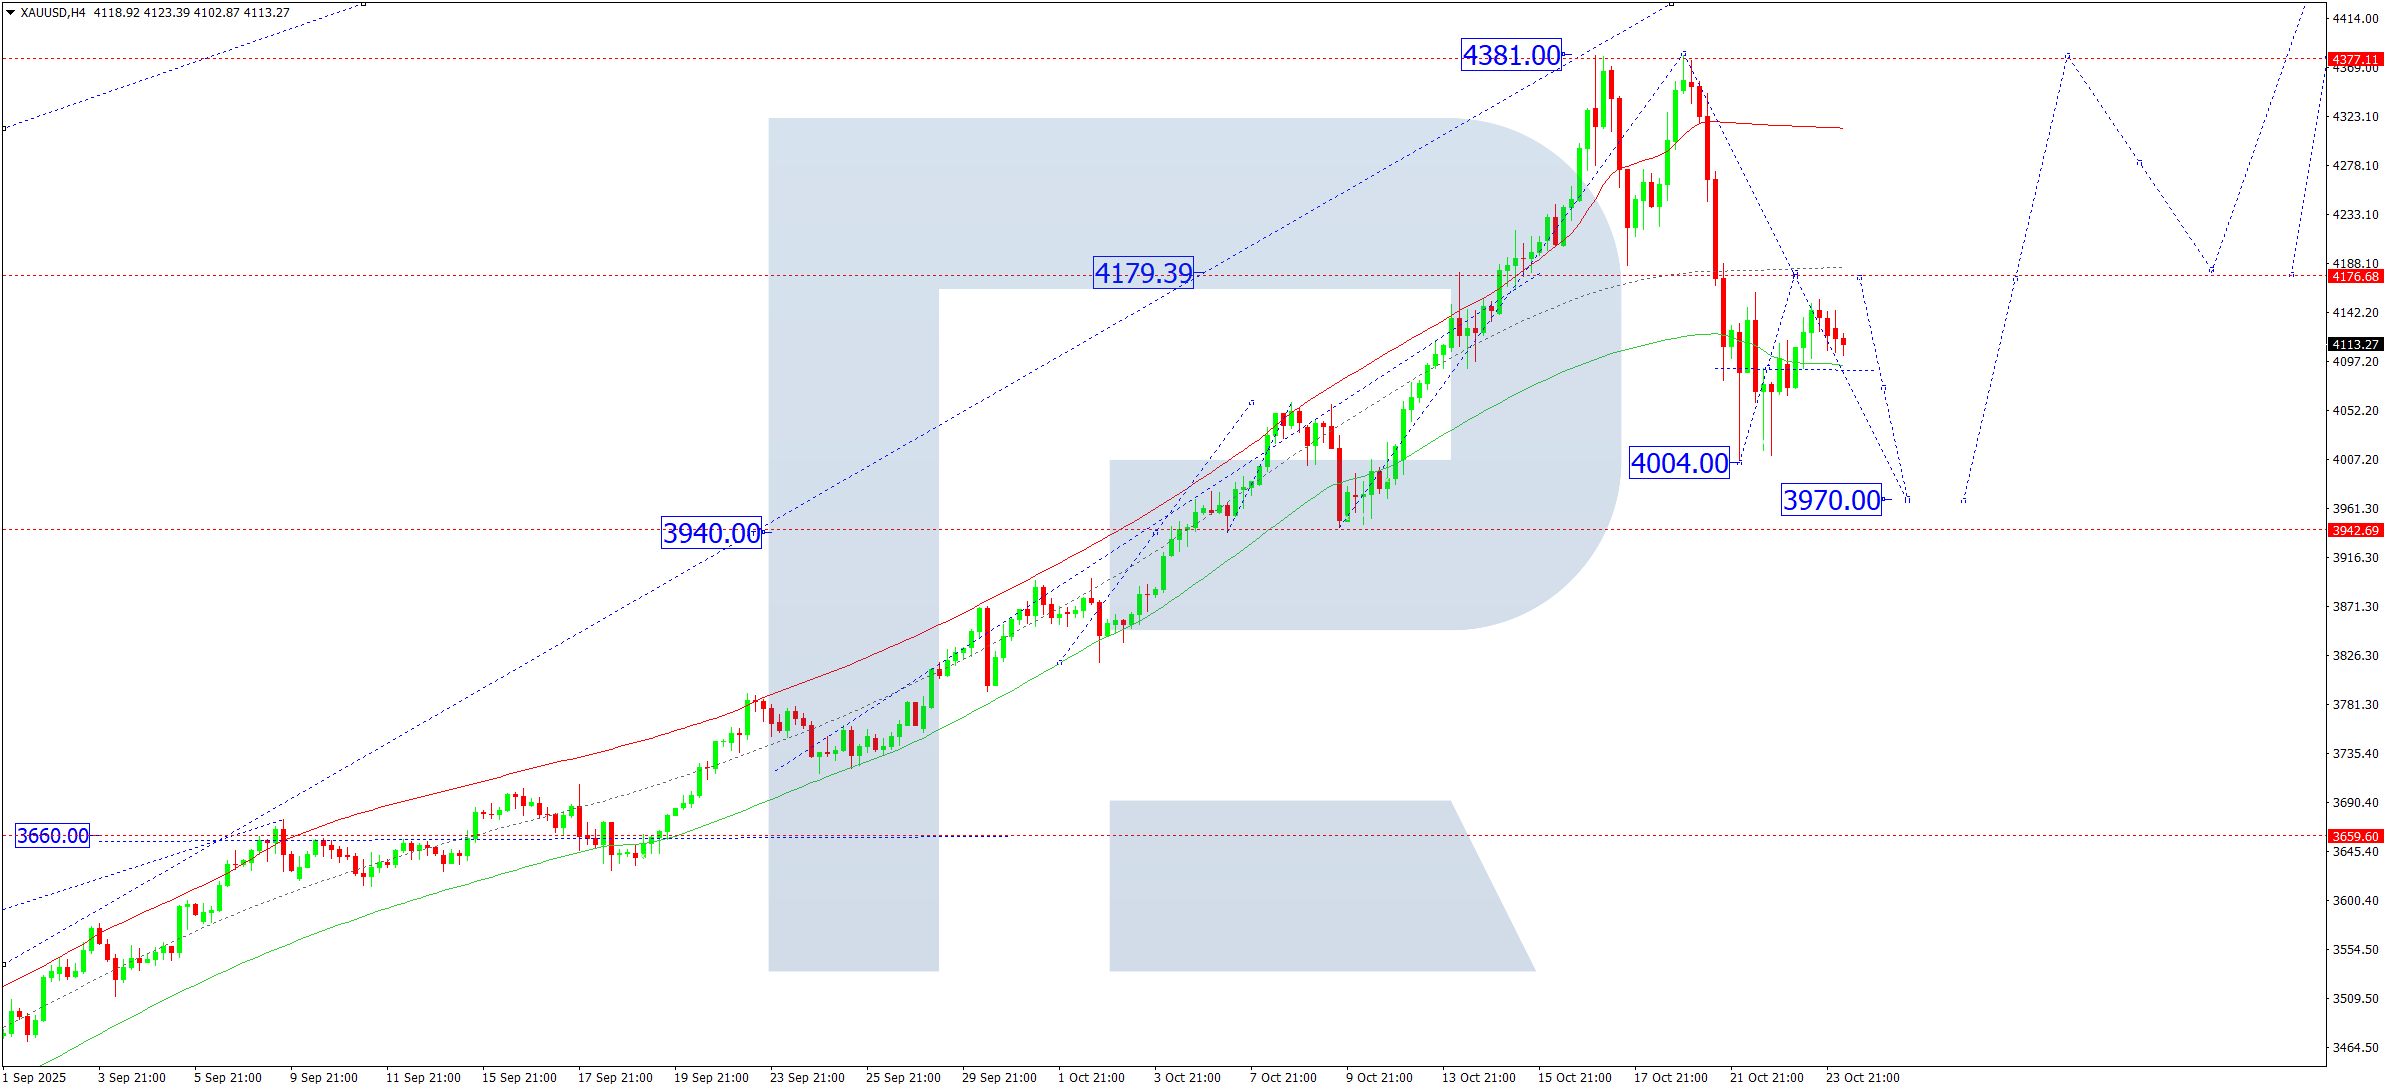
On the H4 chart of XAUUSD, the market continues consolidating around 4,090. On 24 October 2025, expansion of the range upwards to 4,180 and downwards to 3,970 is possible. A downside breakout would open potential for continuation of the correction towards 3,666, while an upward breakout could lead to continuation of the uptrend towards 4,400.
Technically, this scenario is supported by the Elliott Wave structure and the bullish wave matrix with a pivot point at 3,660, which is key for this wave. The market is forming a corrective structure towards the lower boundary of the Price Envelope at 3,970, followed by a rise towards its upper boundary at 4,400.
Technical indicators for today’s XAUUSD forecast suggest continued correction towards 3,970.
Brent forecast
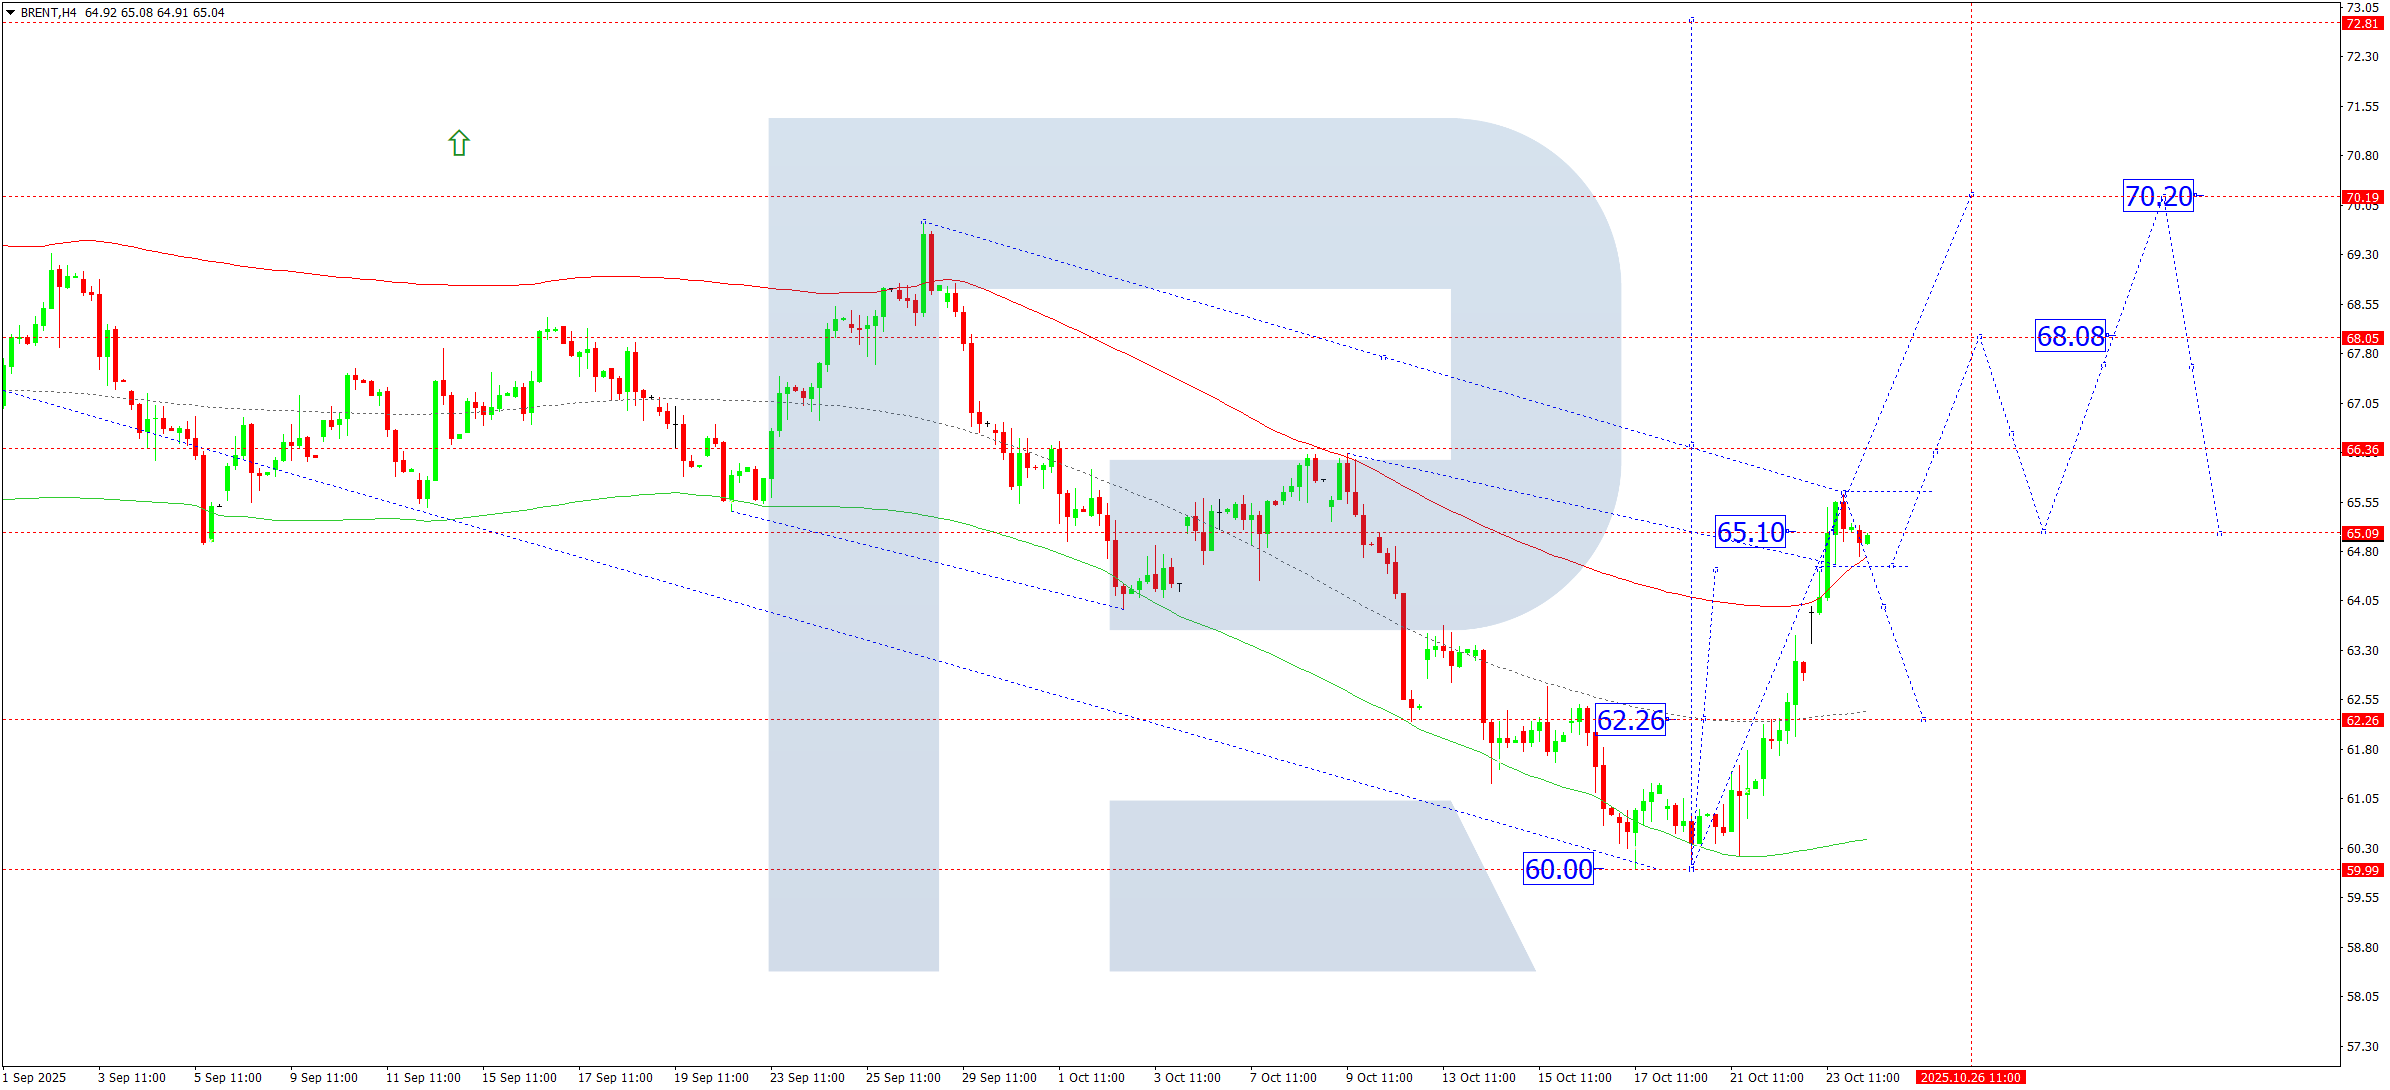
On the H4 chart of Brent crude, the market broke above 62.26 and continued its upward wave towards 65.65. On 24 October 2025, a compact consolidation range is forming below this level. A downside breakout could trigger a correction towards 62.26, while an upside breakout would signal the continuation of the growth impulse towards 70.20, the first target within the uptrend.
Technically, this scenario is confirmed by the Elliott Wave structure and the bullish wave matrix with a pivot point at 65.10, which is key for Brent in this wave. The market earlier reached the lower boundary of the Price Envelope at 60.00, and considering current geopolitical risks, it is forming a growth impulse towards the upper boundary at 70.20.
Technical indicators for today’s Brent forecast suggest potential growth towards 68.00 and 70.20.
Forecasts presented in this section only reflect the author’s private opinion and should not be considered as guidance for trading. RoboForex bears no responsibility for trading results based on trading recommendations described in these analytical reviews.