Daily technical analysis and forecast for 29 October 2025
Here is a detailed daily technical analysis and forecast for EURUSD, USDJPY, GBPUSD, AUDUSD, USDCAD, XAUUSD and Brent for 29 October 2025.
EURUSD forecast
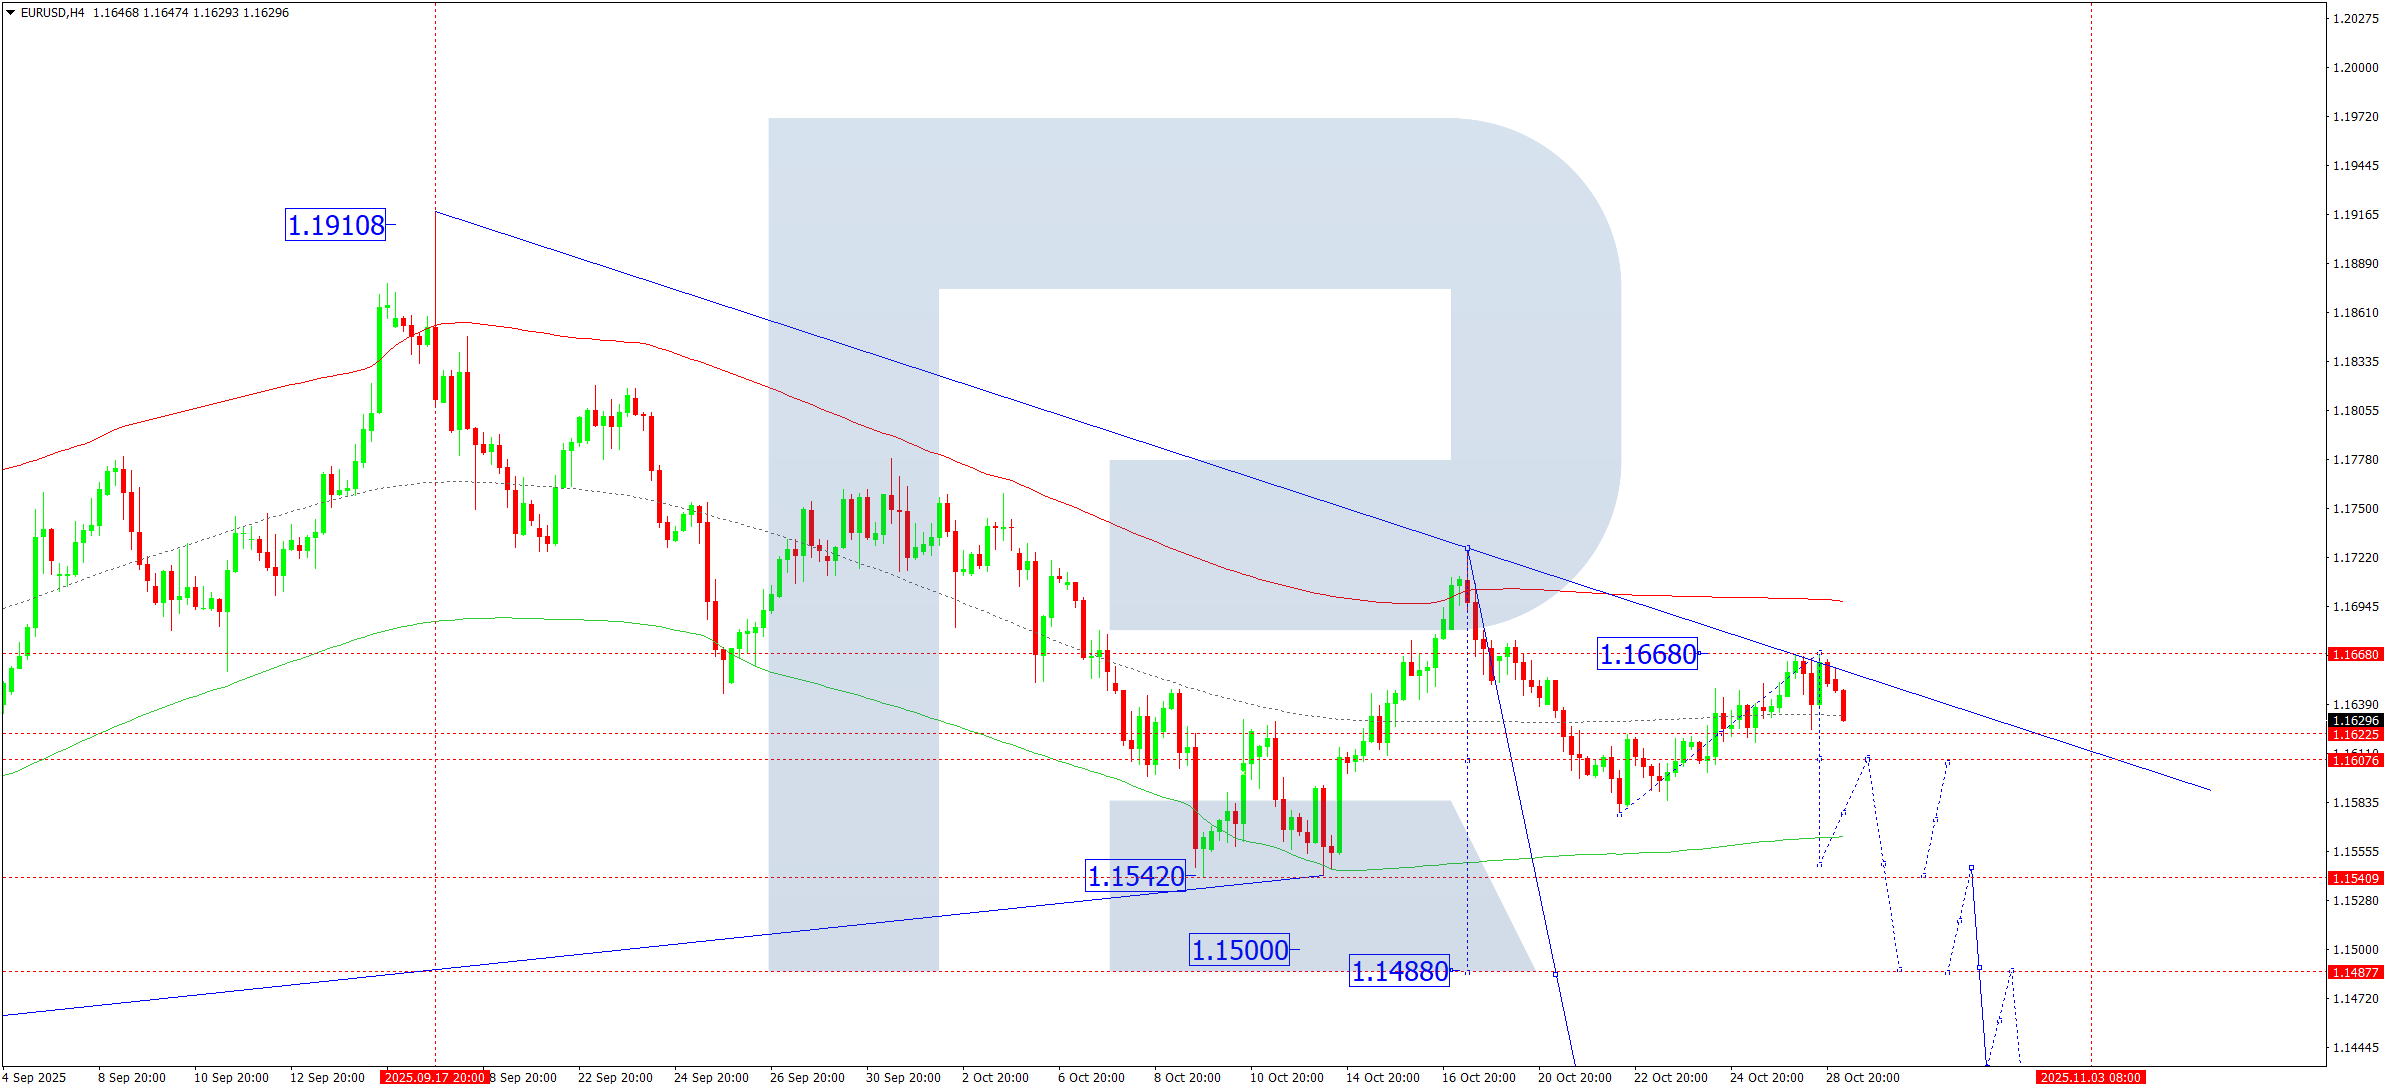
On the H4 chart, EURUSD completed a corrective wave towards 1.1668. On 29 October 2025, the pair is expected to decline towards 1.1606. A breakout below this level would open potential for continued downward movement towards 1.1550, with prospects of extending the trend to 1.1488. This represents only half of the third wave of the ongoing downtrend, with the main target at 1.1240.
Technically, this scenario is confirmed by the Elliott Wave structure and the bearish wave matrix with a pivot point at 1.1730, viewed as key in the EURUSD wave structure. Today, a move towards the lower boundary of the Price Envelope near 1.1550 is expected, followed by a potential rise towards its central line at 1.1606.
Technical indicators for today’s EURUSD forecast suggest a decline towards 1.1606 and 1.1488.
USDJPY forecast
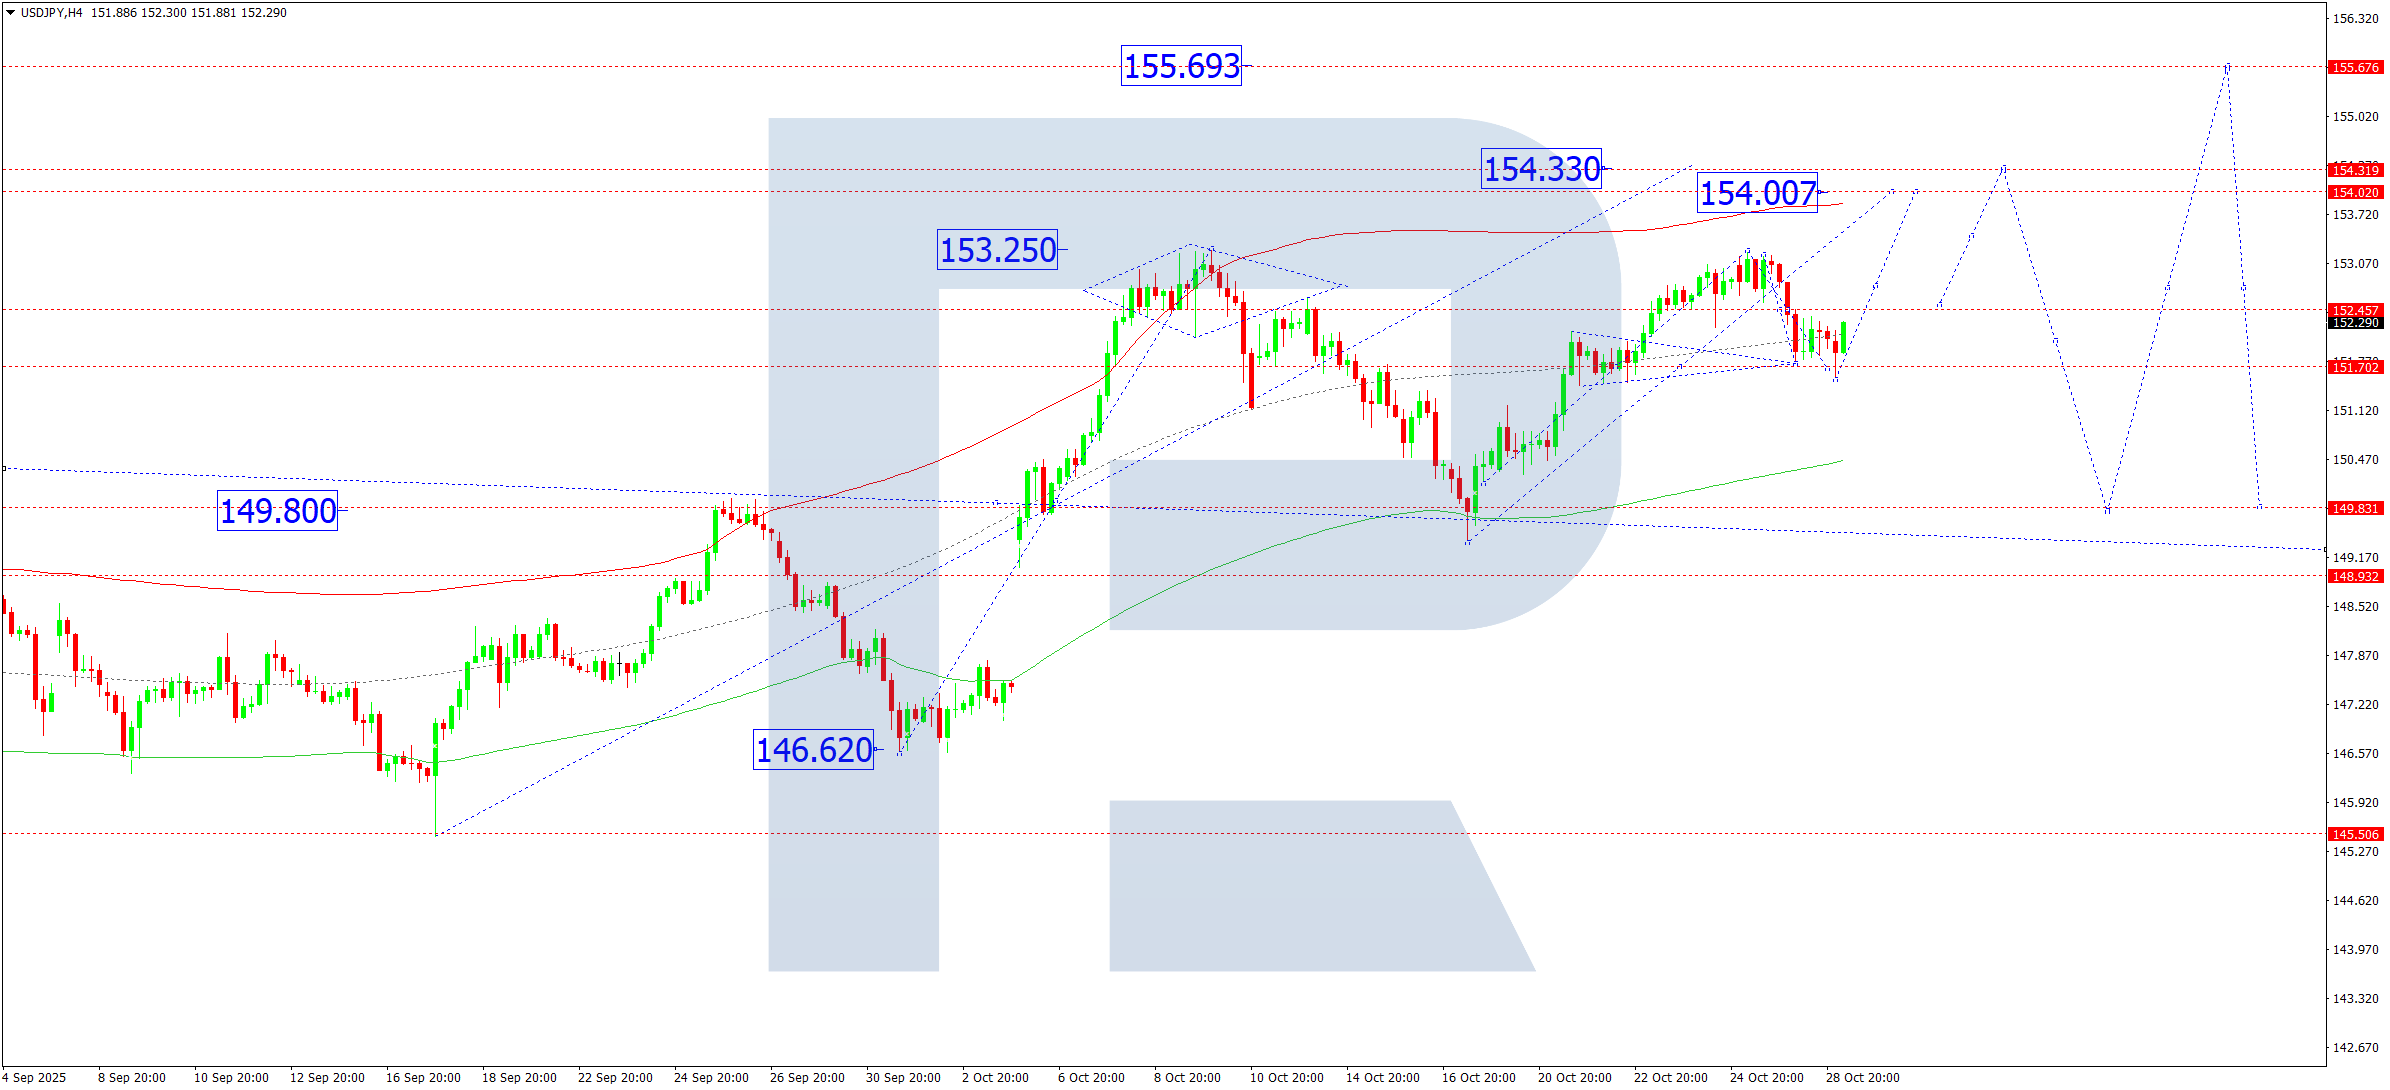
On the H4 chart, USDJPY completed a corrective move to 151.54. On 29 October 2025, the pair is expected to rise towards 152.77. After that, a compact consolidation range may form before another upward move to 154.00, with potential extension to 154.33 as the local estimated target.
Technically, this scenario is supported by the Elliott Wave structure and the bullish wave matrix with a pivot point at 149.80, which serves as the key level for this wave. Currently, the market has formed a consolidation range around the central line of the Price Envelope at 151.70. Further continuation towards its upper boundary at 154.33 is anticipated.
Technical indicators for today’s USDJPY forecast suggest a rise towards 154.00 and 154.33.
GBPUSD forecast
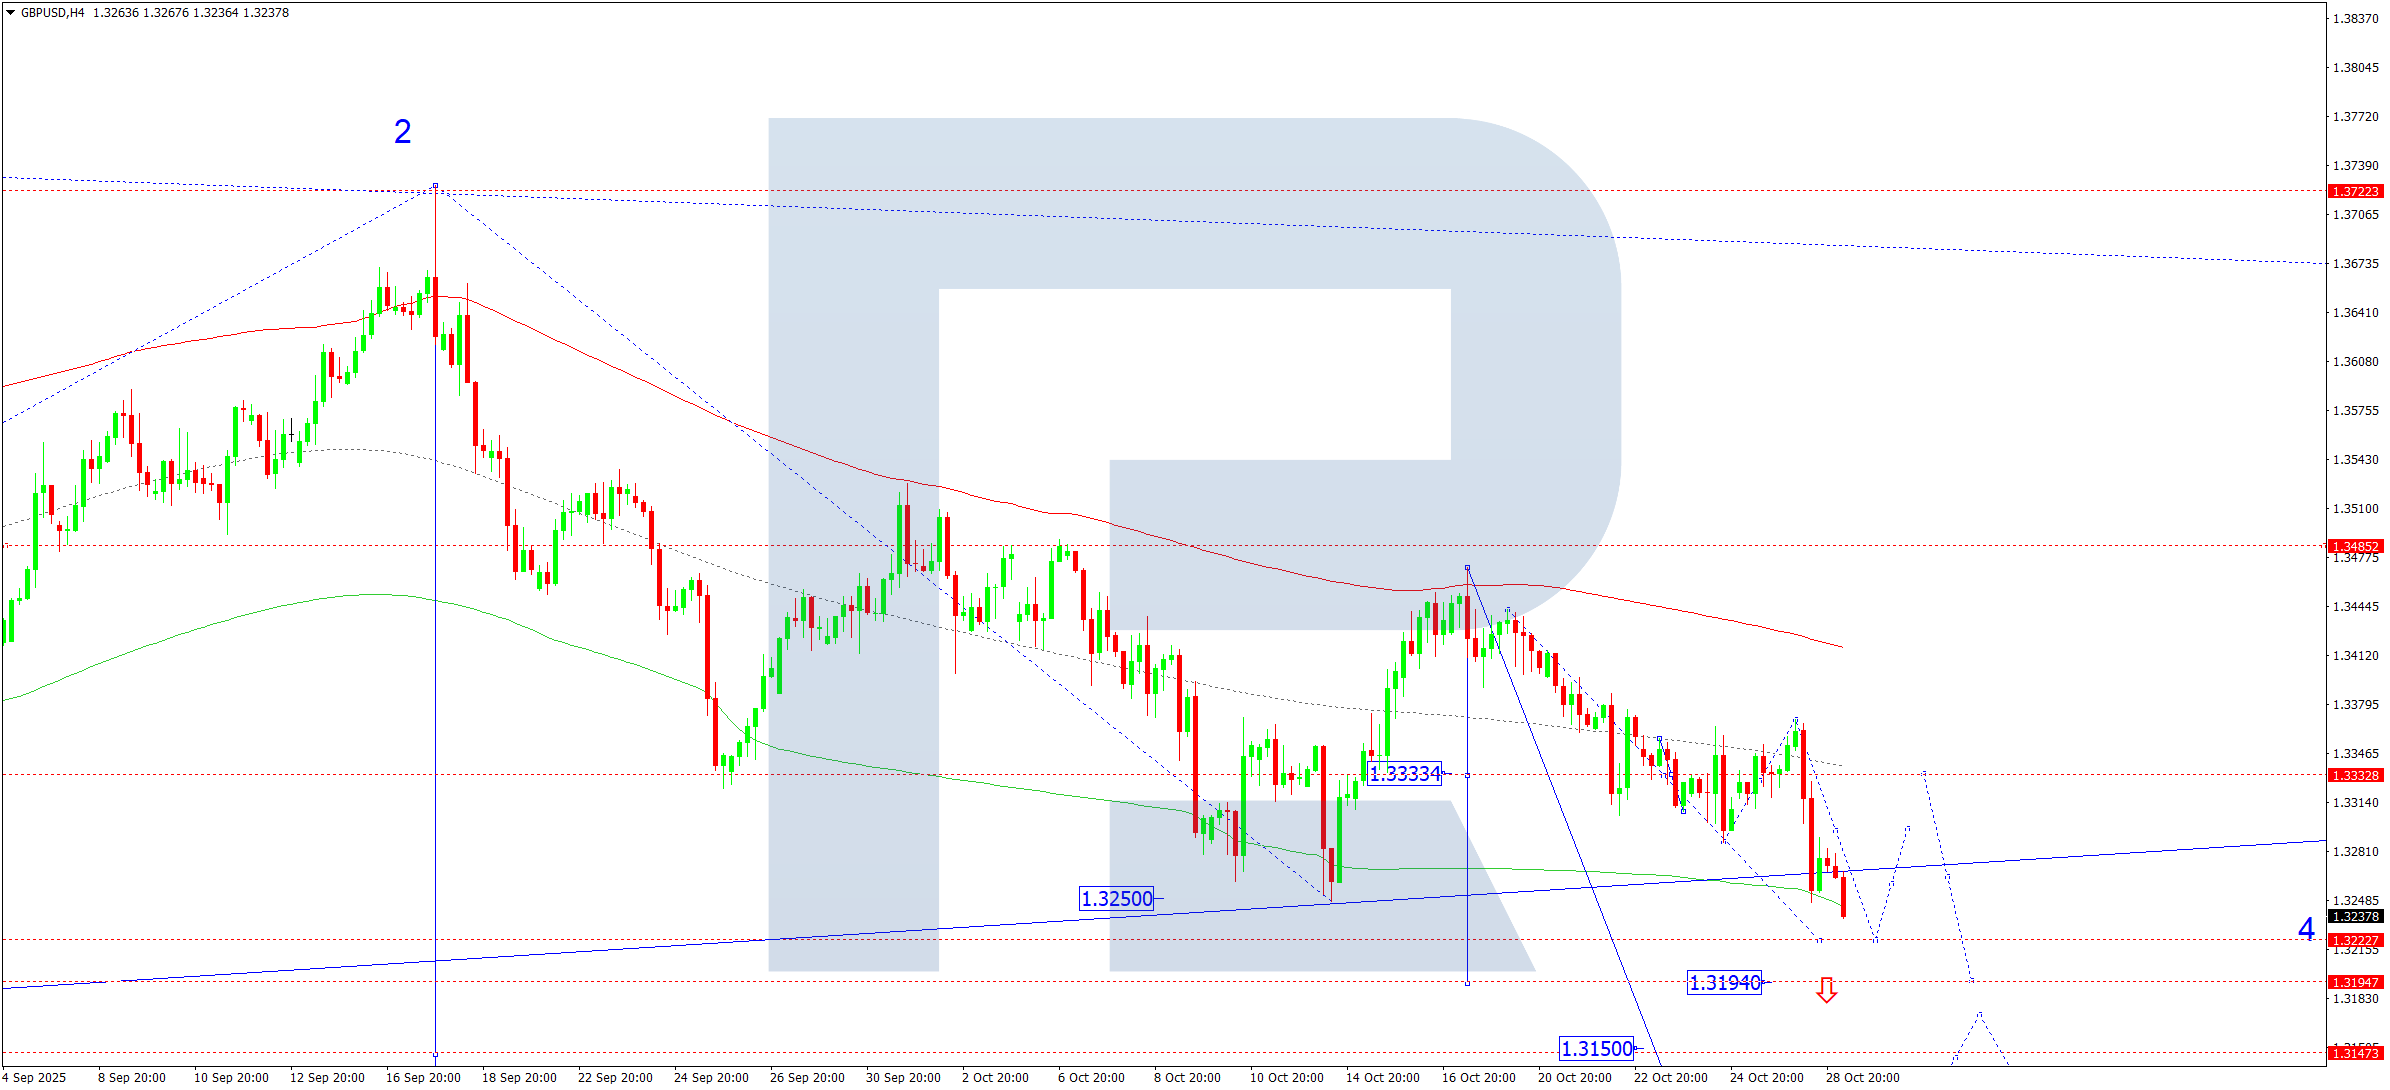
On the H4 chart, GBPUSD formed a consolidation range around 1.3333 and broke downwards. On 29 October 2025, the third downward wave is expected to continue within the prevailing downtrend. The next target lies at 1.3222, with potential extension towards 1.3194. This represents only half of the downward wave, while the main third-wave target is at 1.2962.
Technically, this scenario is confirmed by the Elliott Wave structure and the bearish wave matrix with a pivot point at 1.3490, which is key in this wave. The market continues to form a consolidation pattern around the central line of the Price Envelope at 1.3333, and a further move towards its lower boundary near 1.3213 is expected.
Technical indicators for today’s GBPUSD forecast suggest a decline towards 1.3194.
AUDUSD forecast
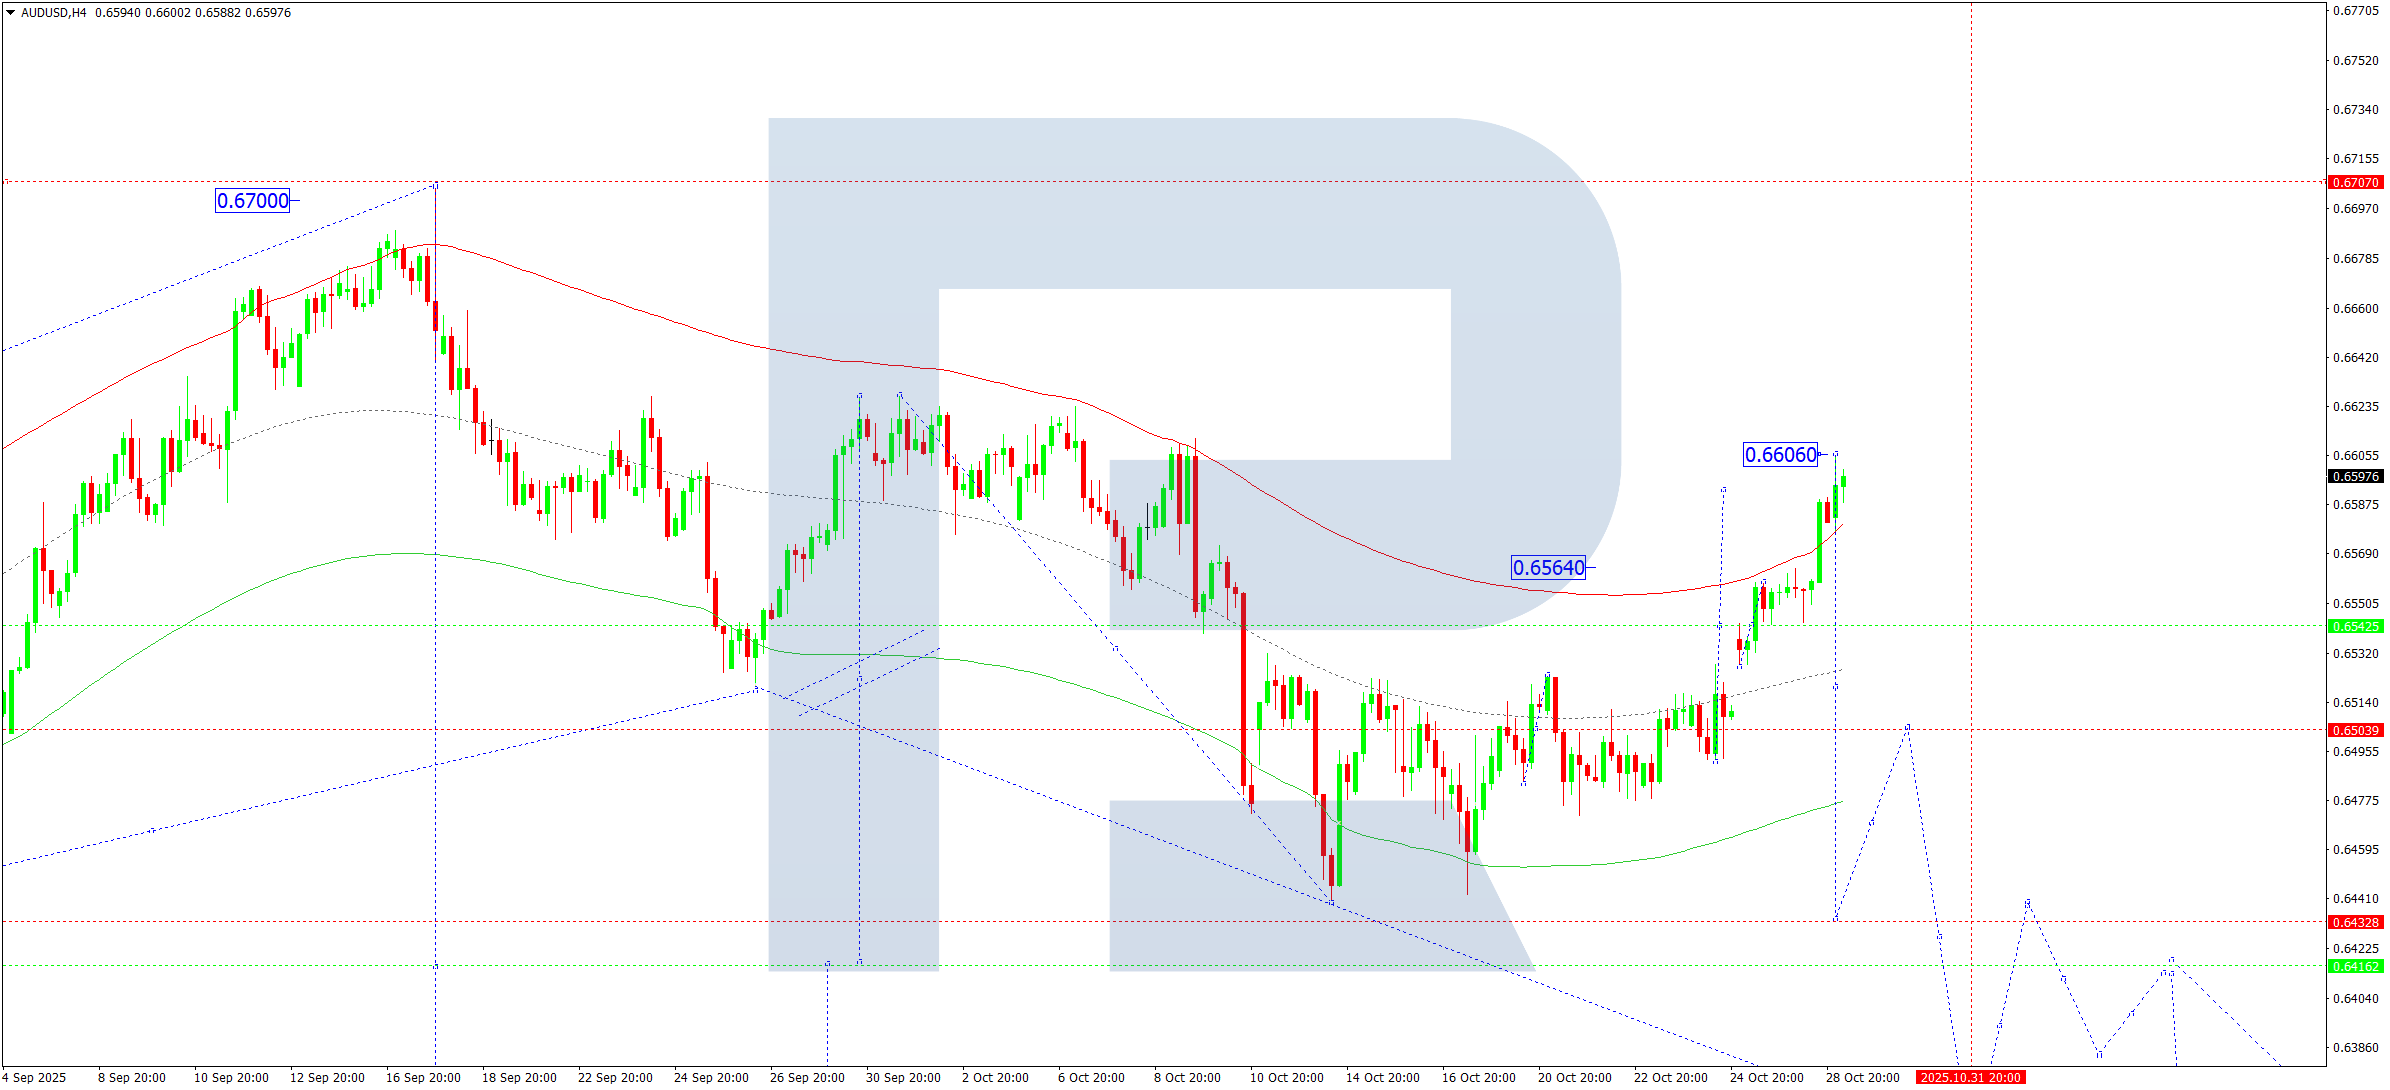
On the H4 chart, AUDUSD expanded its consolidation range towards 0.6606. On 29 October 2025, the pair is expected to decline towards 0.6500. A breakout below this level would open potential for continued downward movement towards 0.6432, with prospects of extending the trend to 0.6350.
Technically, this scenario is supported by the Elliott Wave structure and the bearish wave matrix with a pivot point at 0.6525, viewed as key in this wave. The market completed a correction towards the upper boundary of the Price Envelope at 0.6606. A decline towards the lower boundary near 0.6432 is expected next.
Technical indicators for today’s AUDUSD forecast suggest the beginning of a downward wave towards 0.6432.
USDCAD forecast
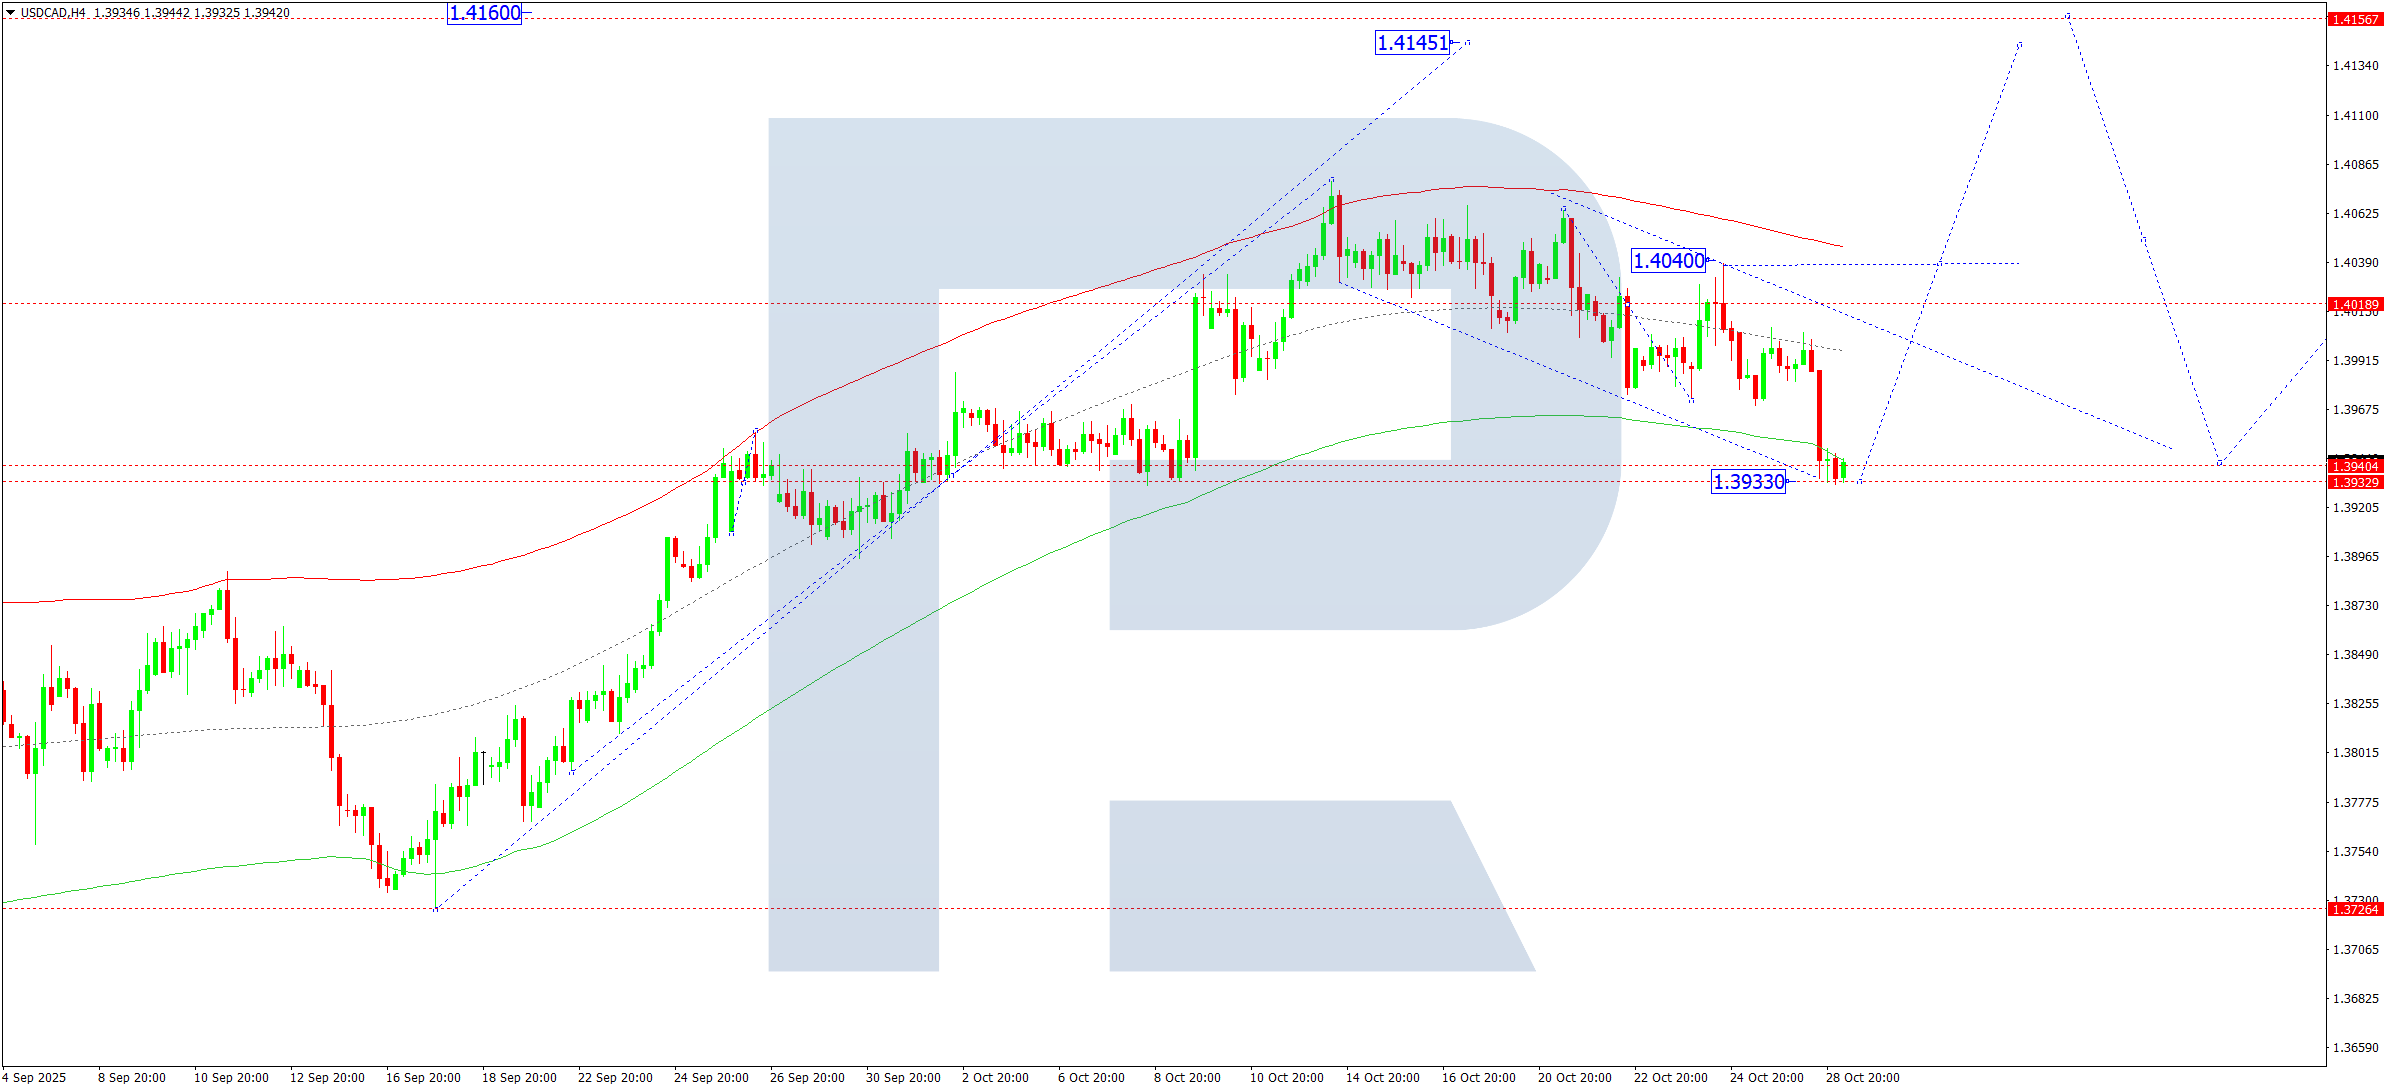
On the H4 chart, USDCAD completed a correction towards 1.3933. On 29 October 2025, the pair is expected to begin a new upward wave towards 1.4040. A breakout above this level would open potential for continuation of the uptrend towards 1.4160 as the local calculated target.
Technically, this scenario is confirmed by the Elliott Wave structure and the bullish wave matrix with a pivot point at 1.3940, which is key in this wave. The market has completed a corrective structure towards the lower boundary of the Price Envelope at 1.3933. A subsequent rise towards 1.4040 is anticipated, and a breakout above this level would signal continuation towards 1.4160. Later, a correction towards the central line at 1.3940 (testing from above) is possible.
Technical indicators for today’s USDCAD forecast suggest the upward wave could continue towards 1.4040 and 1.4160.
XAUUSD forecast
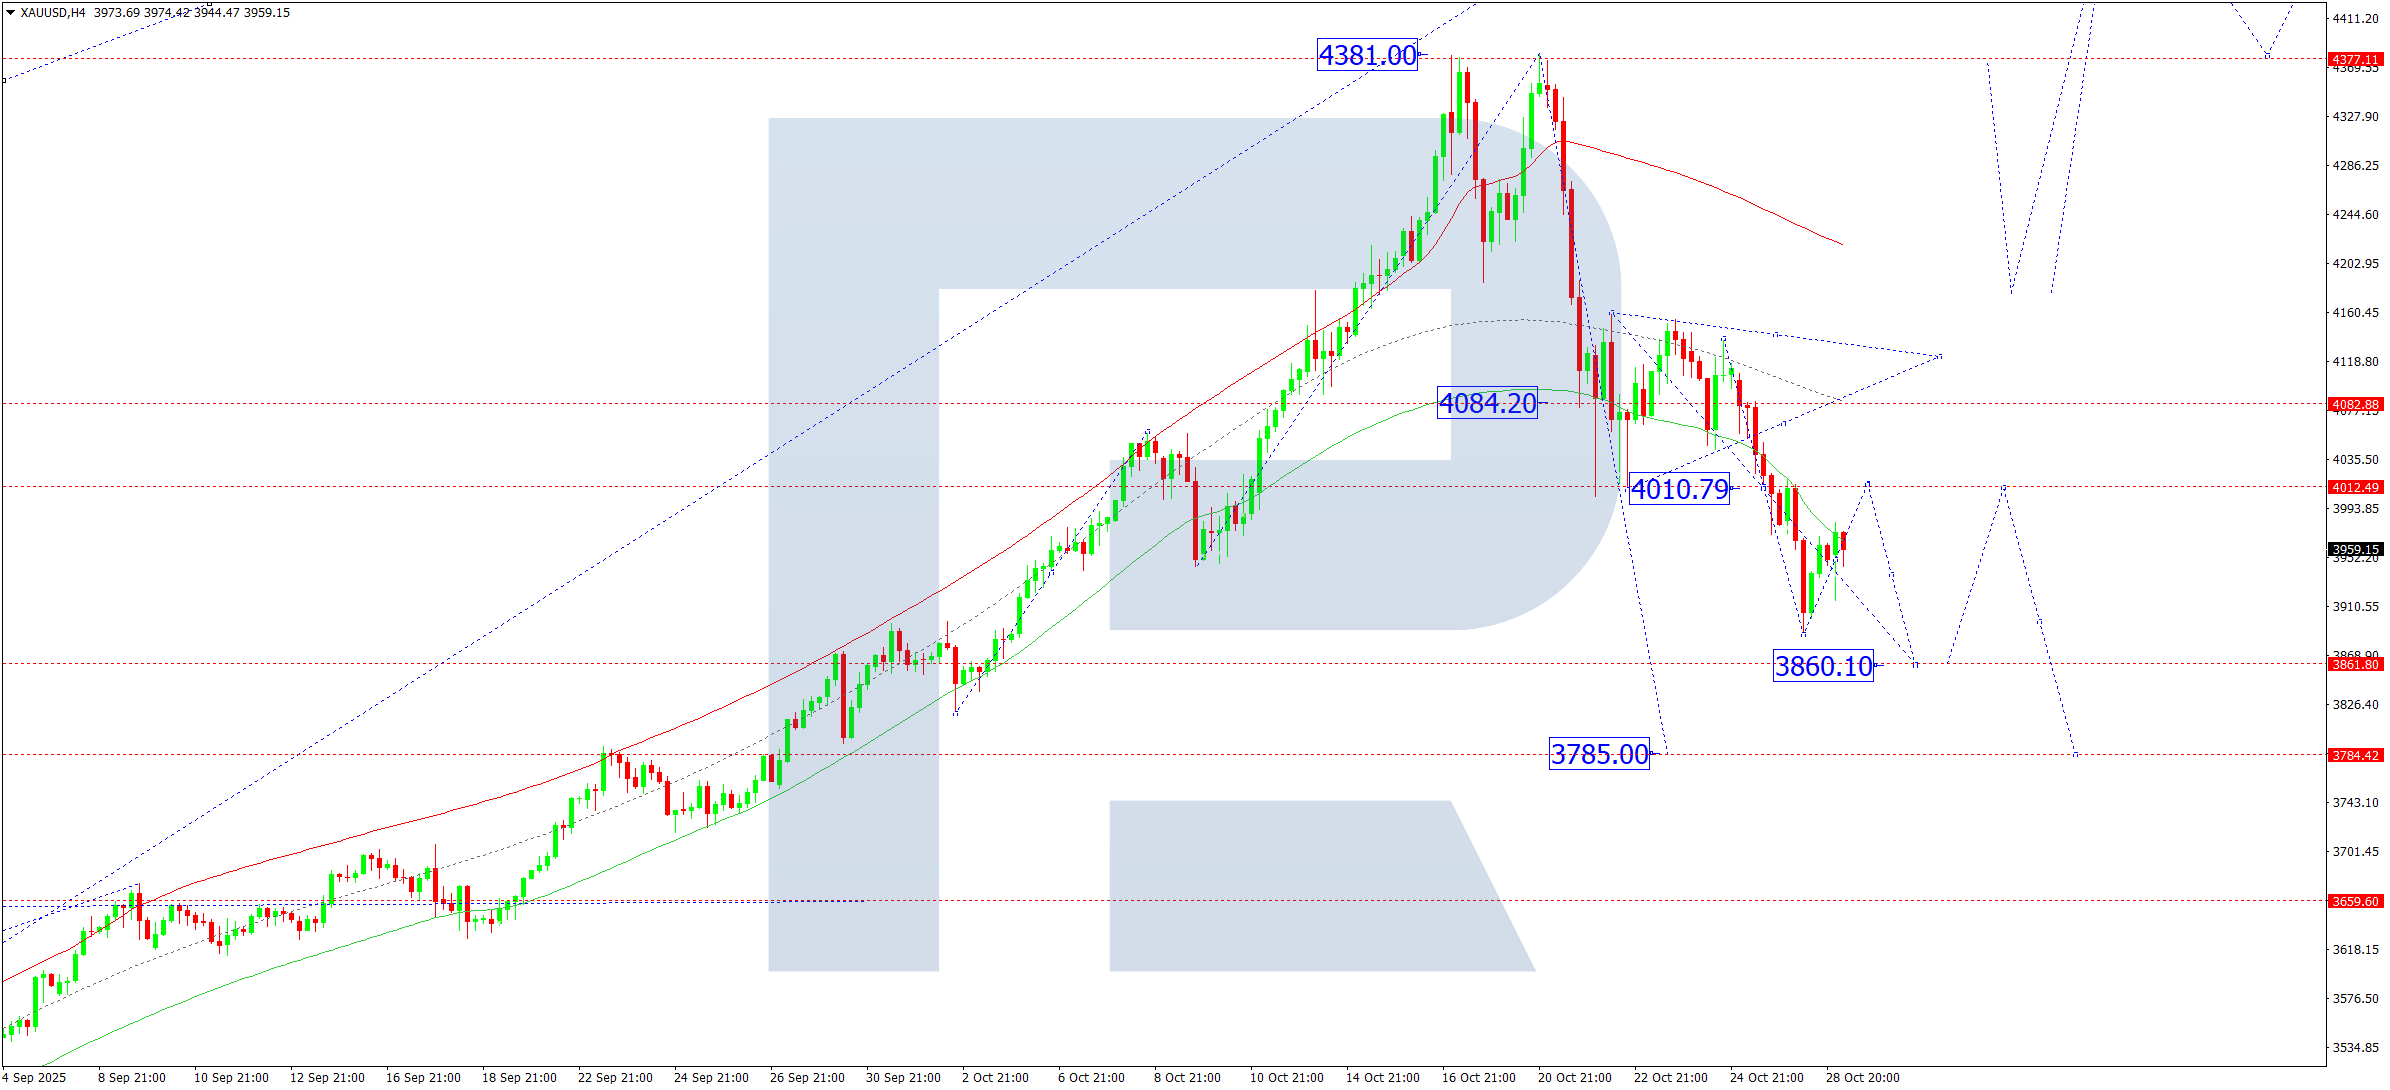
On the H4 chart, XAUUSD completed a correction, reaching 3,890. On 29 October 2025, a rise towards 4,010 is expected, followed by a decline to 3,860, and then another upward move to 4,010. This will form a new consolidation range. A downward breakout would open potential for continuation of the correction towards 3,785 and possibly 3,666, while an upward breakout would signal trend continuation towards 4,400.
Technically, this scenario is supported by the Elliott Wave structure and the bullish wave matrix with a pivot point at 3,660, which is key in this wave. The market is forming a corrective structure towards the lower boundary of the Price Envelope at 3,860, after which growth towards the upper boundary near 4,010 is expected.
Technical indicators for today’s XAUUSD forecast suggest a continued correction towards 3,860.
Brent forecast
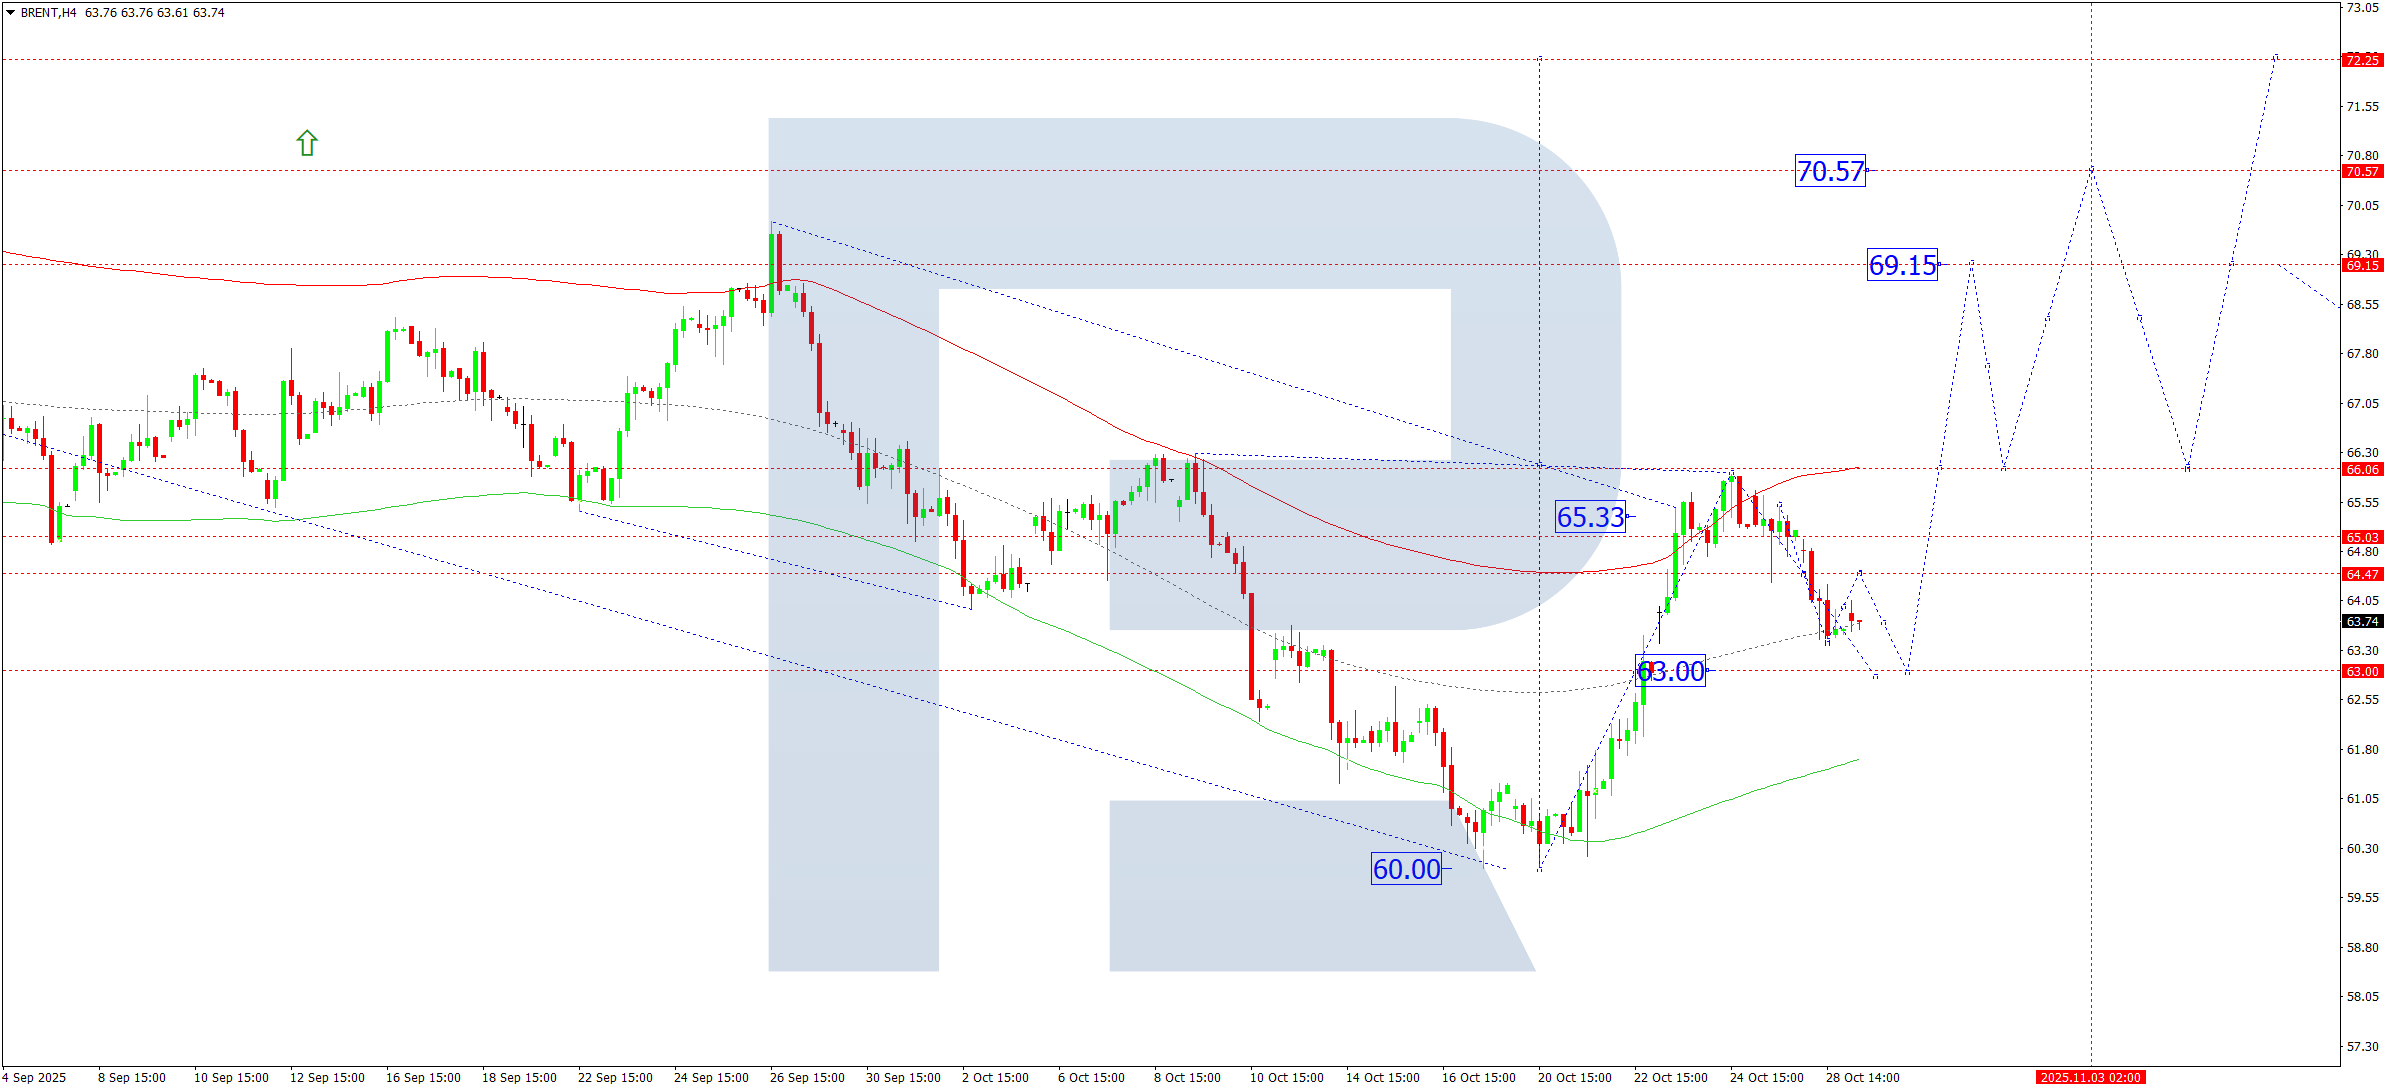
On the H4 chart, Brent crude is forming a corrective structure towards 63.00. On 29 October 2025, this correction is expected to be completed, followed by a rise towards 66.00. A breakout above this level would open potential for continued growth towards 69.15, with prospects of extending the trend to 70.77 and further to 72.22.
Technically, this scenario is confirmed by the Elliott Wave structure and the bullish wave matrix with a pivot point at 66.00, considered key in this wave. The market reached the upper boundary of the Price Envelope at 65.99 and continues a correction towards its central line at 63.00. After the correction is complete, an upward impulse towards 69.15 is expected.
Technical indicators for today’s Brent forecast suggest the completion of the correction and the start of growth towards 66.00 and 69.15.
Forecasts presented in this section only reflect the author’s private opinion and should not be considered as guidance for trading. RoboForex bears no responsibility for trading results based on trading recommendations described in these analytical reviews.