Daily technical analysis and forecast for 14 November 2025
Here is a detailed daily technical analysis and forecast for EURUSD, USDJPY, GBPUSD, AUDUSD, USDCAD, XAUUSD and Brent for 14 November 2025.
EURUSD forecast
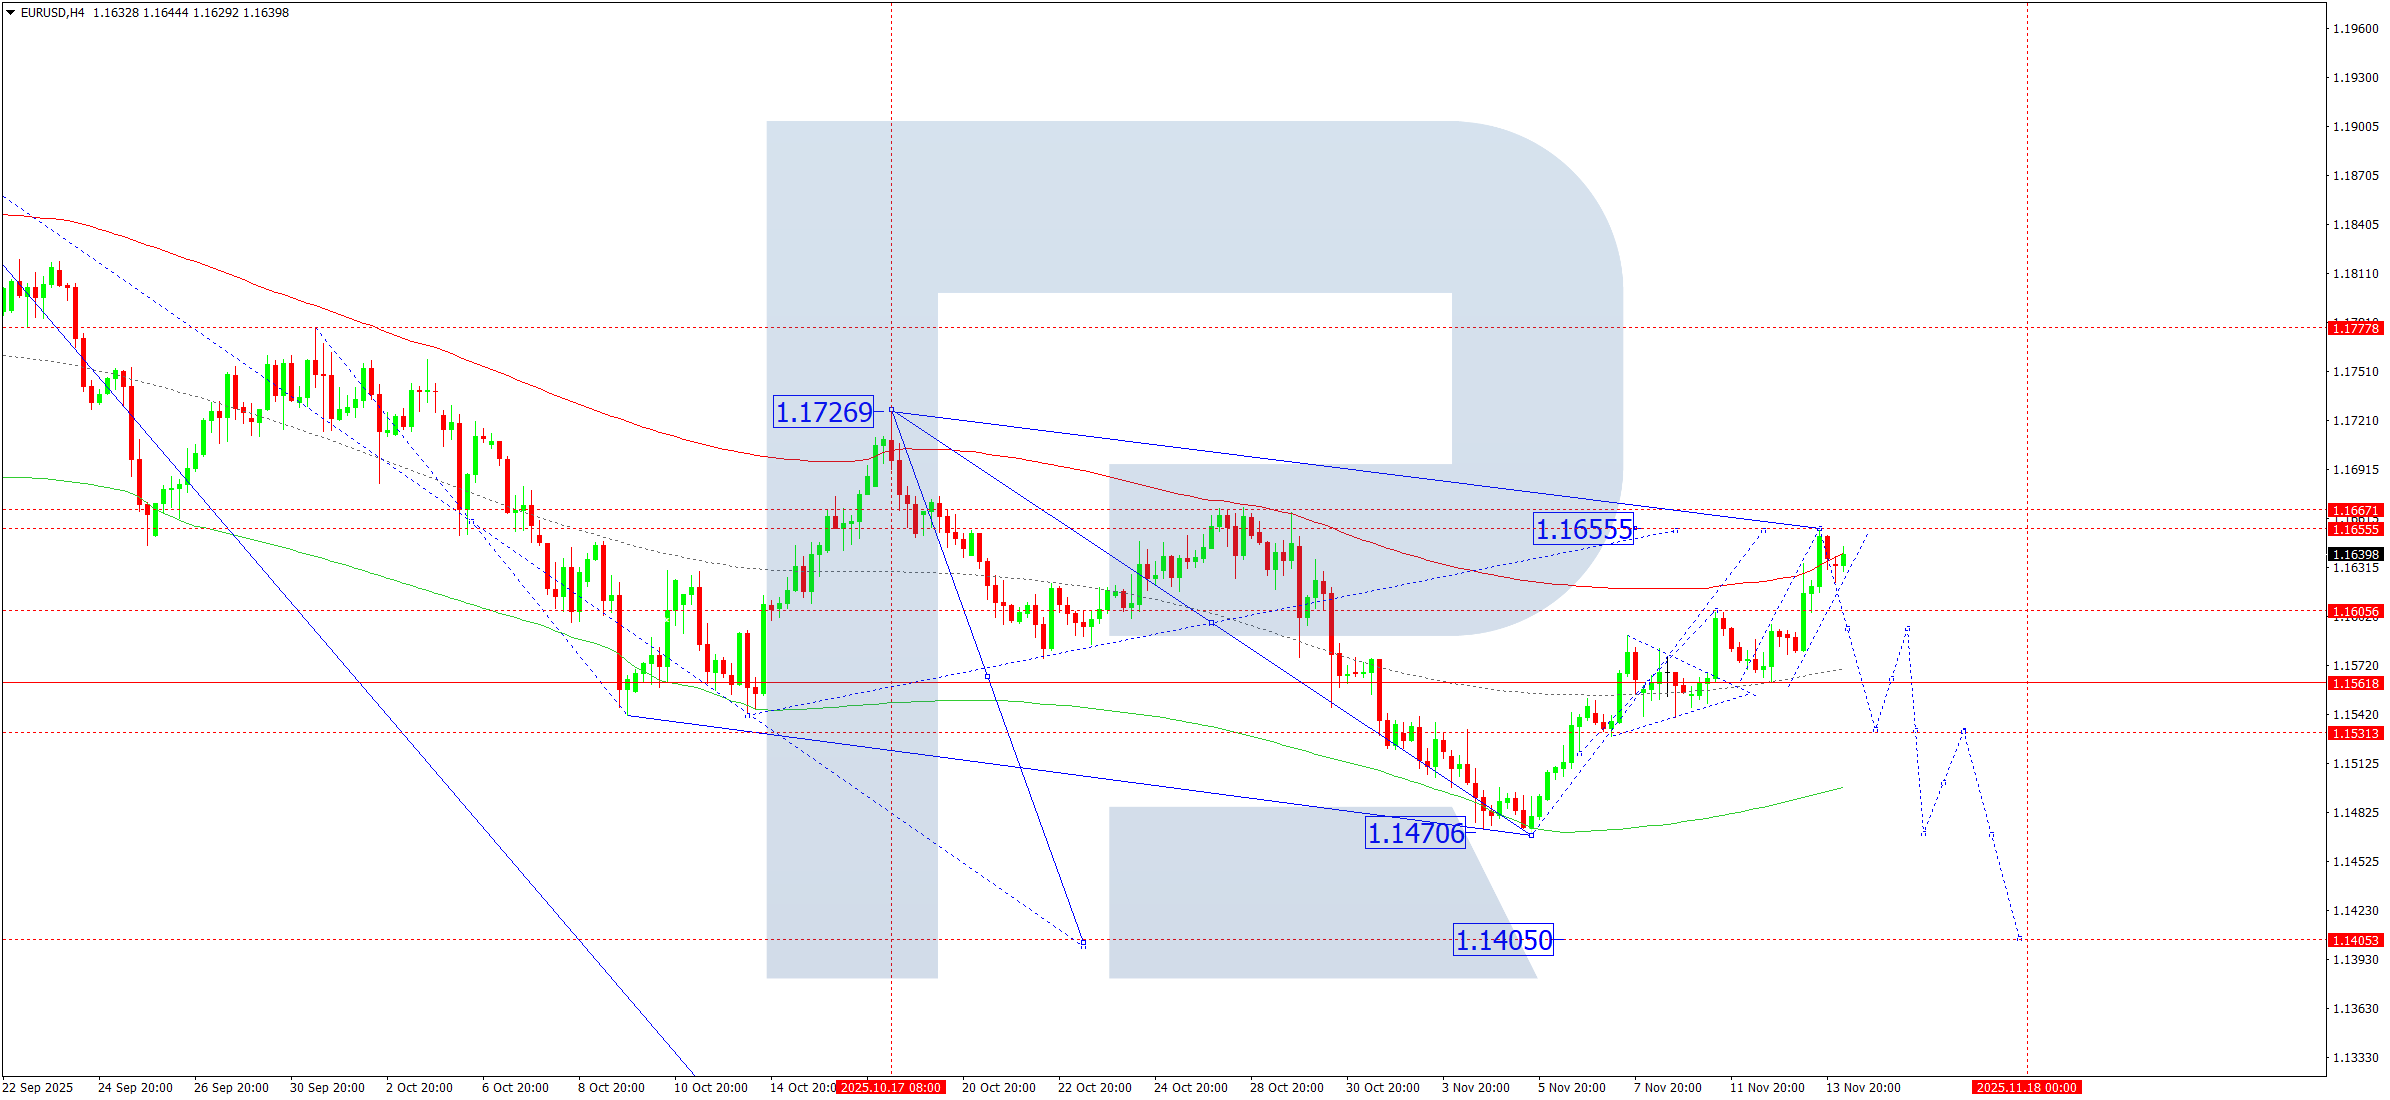
On the H4 chart of EURUSD, the market formed a narrow consolidation range around 1.1562 and broke upwards. On 14 November 2025, after receiving support at 1.1605, the market completed another corrective structure, reaching 1.1655. A downward impulse towards 1.1622 has formed, followed by a correction to 1.1644. A breakout downwards opens the potential for a continued decline towards 1.1533, with scope to extend the trend to 1.1405. If breaking upwards, the pair could reach the current correction high at 1.1666. Afterwards, the likely scenario is the beginning of a downward wave towards 1.1405.
The Elliott wave structure and the downward wave matrix with a pivot point at 1.1660 confirm this scenario as the key structural element for EURUSD. Currently, the market has completed a correction wave towards the upper boundary of the Price Envelope at 1.1655. Today, a downward wave is expected to begin, aiming for the lower boundary of the Price Envelope at 1.1450, with scope to extend the trend to 1.1405.
Technical indicators for today’s EURUSD forecast suggest a decline towards 1.1533.
USDJPY forecast
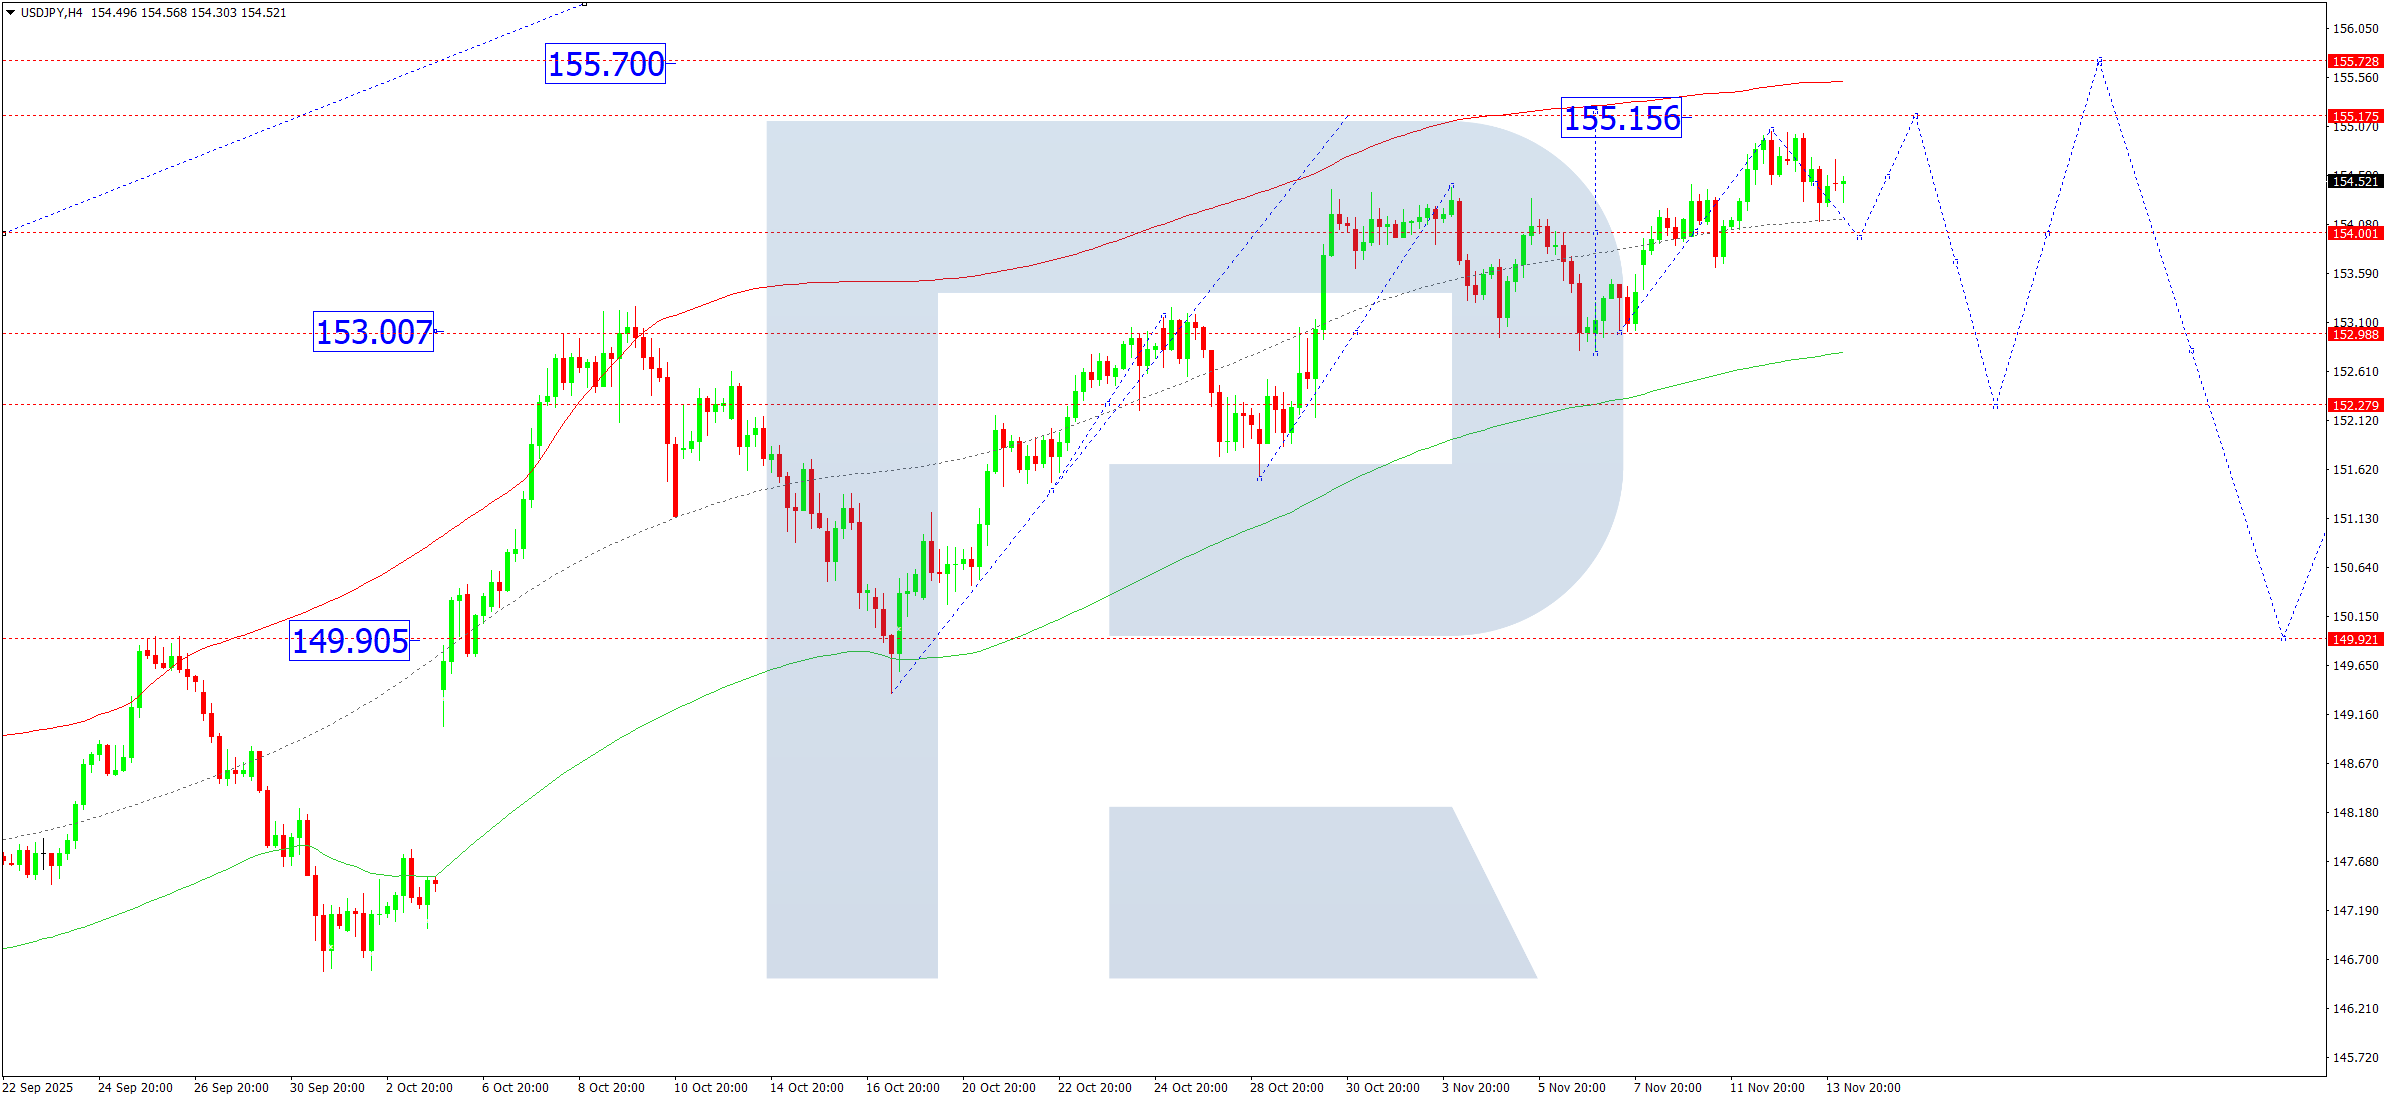
On the H4 chart of USDJPY, the market continues to form a correction towards 154.00. On 14 November 2025, the correction may complete, followed by the beginning of an upward wave towards 155.15. The market will effectively outline a new consolidation range around 154.00. A breakout upwards opens the potential for the continuation of the upward wave towards 155.70, with an extension towards 157.57. The target is local and estimated. A breakout downwards may trigger a corrective move towards at least 152.22, followed by growth towards 155.70.
The Elliott wave structure and the upward wave matrix with a pivot point at 152.22 confirm this scenario as the key structure of the wave. At the moment, the market forms a consolidation range around the central line of the Price Envelope at 154.00. The expectation includes a rise towards its upper boundary at 155.15, followed by a possible correction towards its lower boundary at 153.00, and then a rise towards 155.70.
Technical indicators for today’s USDJPY forecast suggest a rise towards 155.15.
GBPUSD forecast
On the H4 chart of GBPUSD, the market completed a correction towards 1.3215. On 14 November 2025, the market is developing a downward impulse towards 1.3131. A breakout below this level would place the next target at 1.3065, with the potential to extend the trend to 1.2915. The target is local, within the third wave of the downtrend.
The Elliott wave structure and the downward wave matrix with a pivot point at 1.3188 confirm this scenario as the key structural element. Currently, the market has completed a correction wave towards the upper boundary of the Price Envelope at 1.3215 (testing from below). Today, a downward wave could start, aiming for the lower boundary at 1.2915.
Technical indicators for today’s GBPUSD forecast suggest the beginning of a downward wave towards 1.2915.

AUDUSD forecast
On the H4 chart of AUDUSD, the market completed a correction towards 0.6579. On 14 November 2025, a downward wave towards 0.6515 is expected, followed by an upward move towards 0.6545. The market will effectively outline a new consolidation range around 0.6555. A breakout upwards may extend the correction towards 0.6585. A breakout downwards would open the potential for the continuation of the trend towards 0.6454.
The Elliott wave structure and the downward wave matrix in AUDUSD with a pivot point at 0.6520 confirm this scenario as the key structure for this wave. At the moment, the market completed a correction towards the upper boundary of the Price Envelope at 0.6579. The expectation includes the start of a decline towards its central line at 0.6515, followed by a continuation of the third wave to its lower boundary at 0.6454.
Technical indicators for today’s AUDUSD forecast suggest the beginning of a downward wave towards 0.6454.

USDCAD forecast
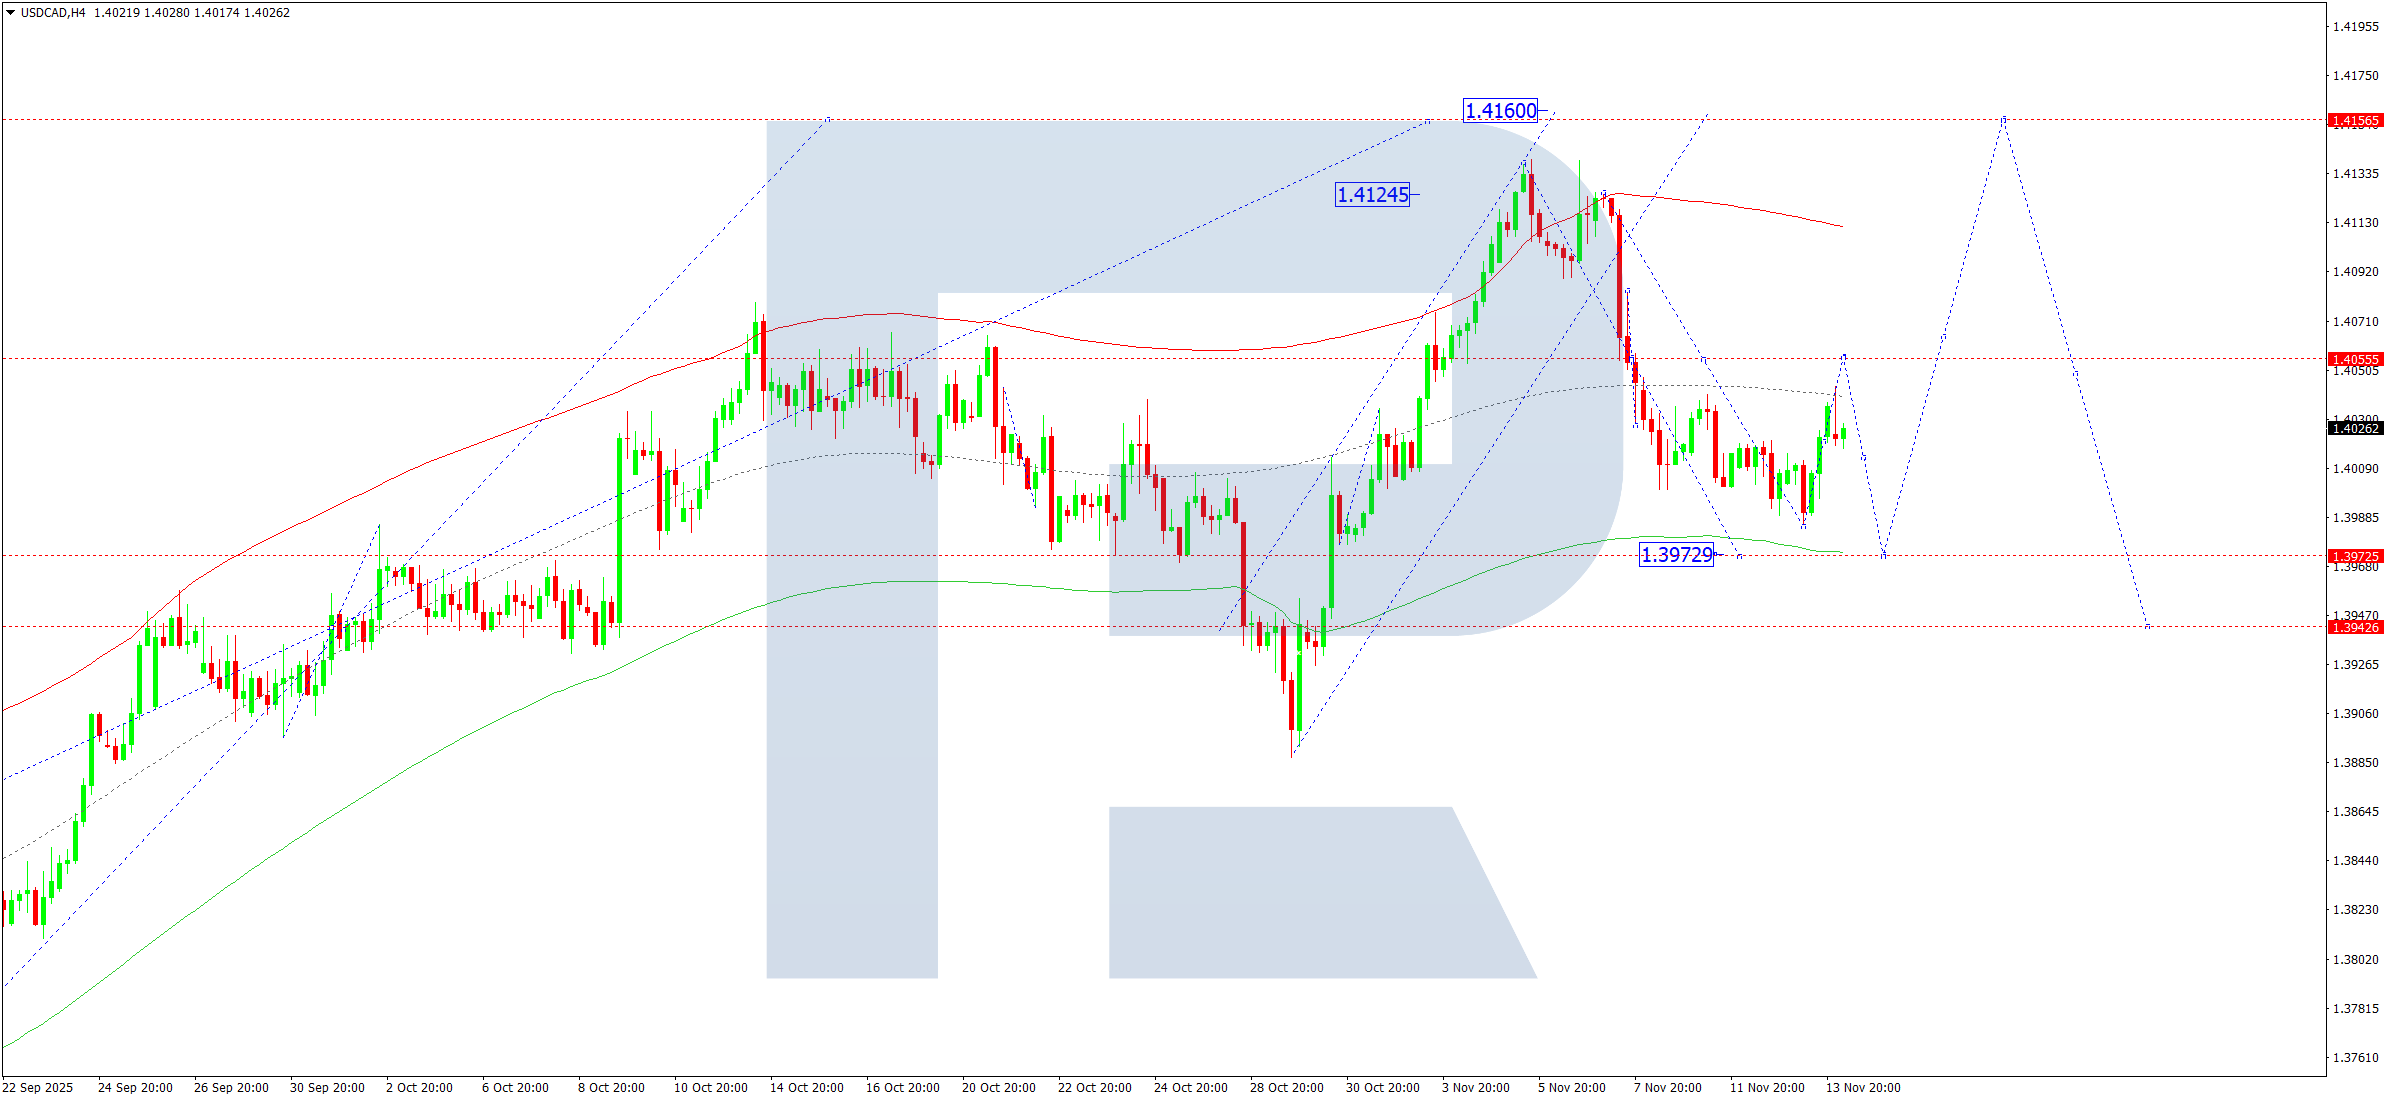
On the H4 chart of USDCAD, the market completed a correction towards 1.3985. On 14 November 2025, an upward move towards 1.4055 is forming. Afterwards, another downward leg towards 1.3973 is possible. This level will fully exhaust the correction potential. Then an upward wave towards the local target of 1.4160 may begin.
The Elliott wave structure and the upward wave matrix with a pivot point at 1.3939 confirm this scenario as the key structure for USDCAD. At the moment, the market continues its correction towards the lower boundary of the Price Envelope at 1.3973. Today, consider the completion of the correction and the beginning of an upward wave towards its upper boundary at 1.4160.
Technical indicators for today’s USDCAD forecast suggest a continued upward movement towards 1.4160.
XAUUSD forecast
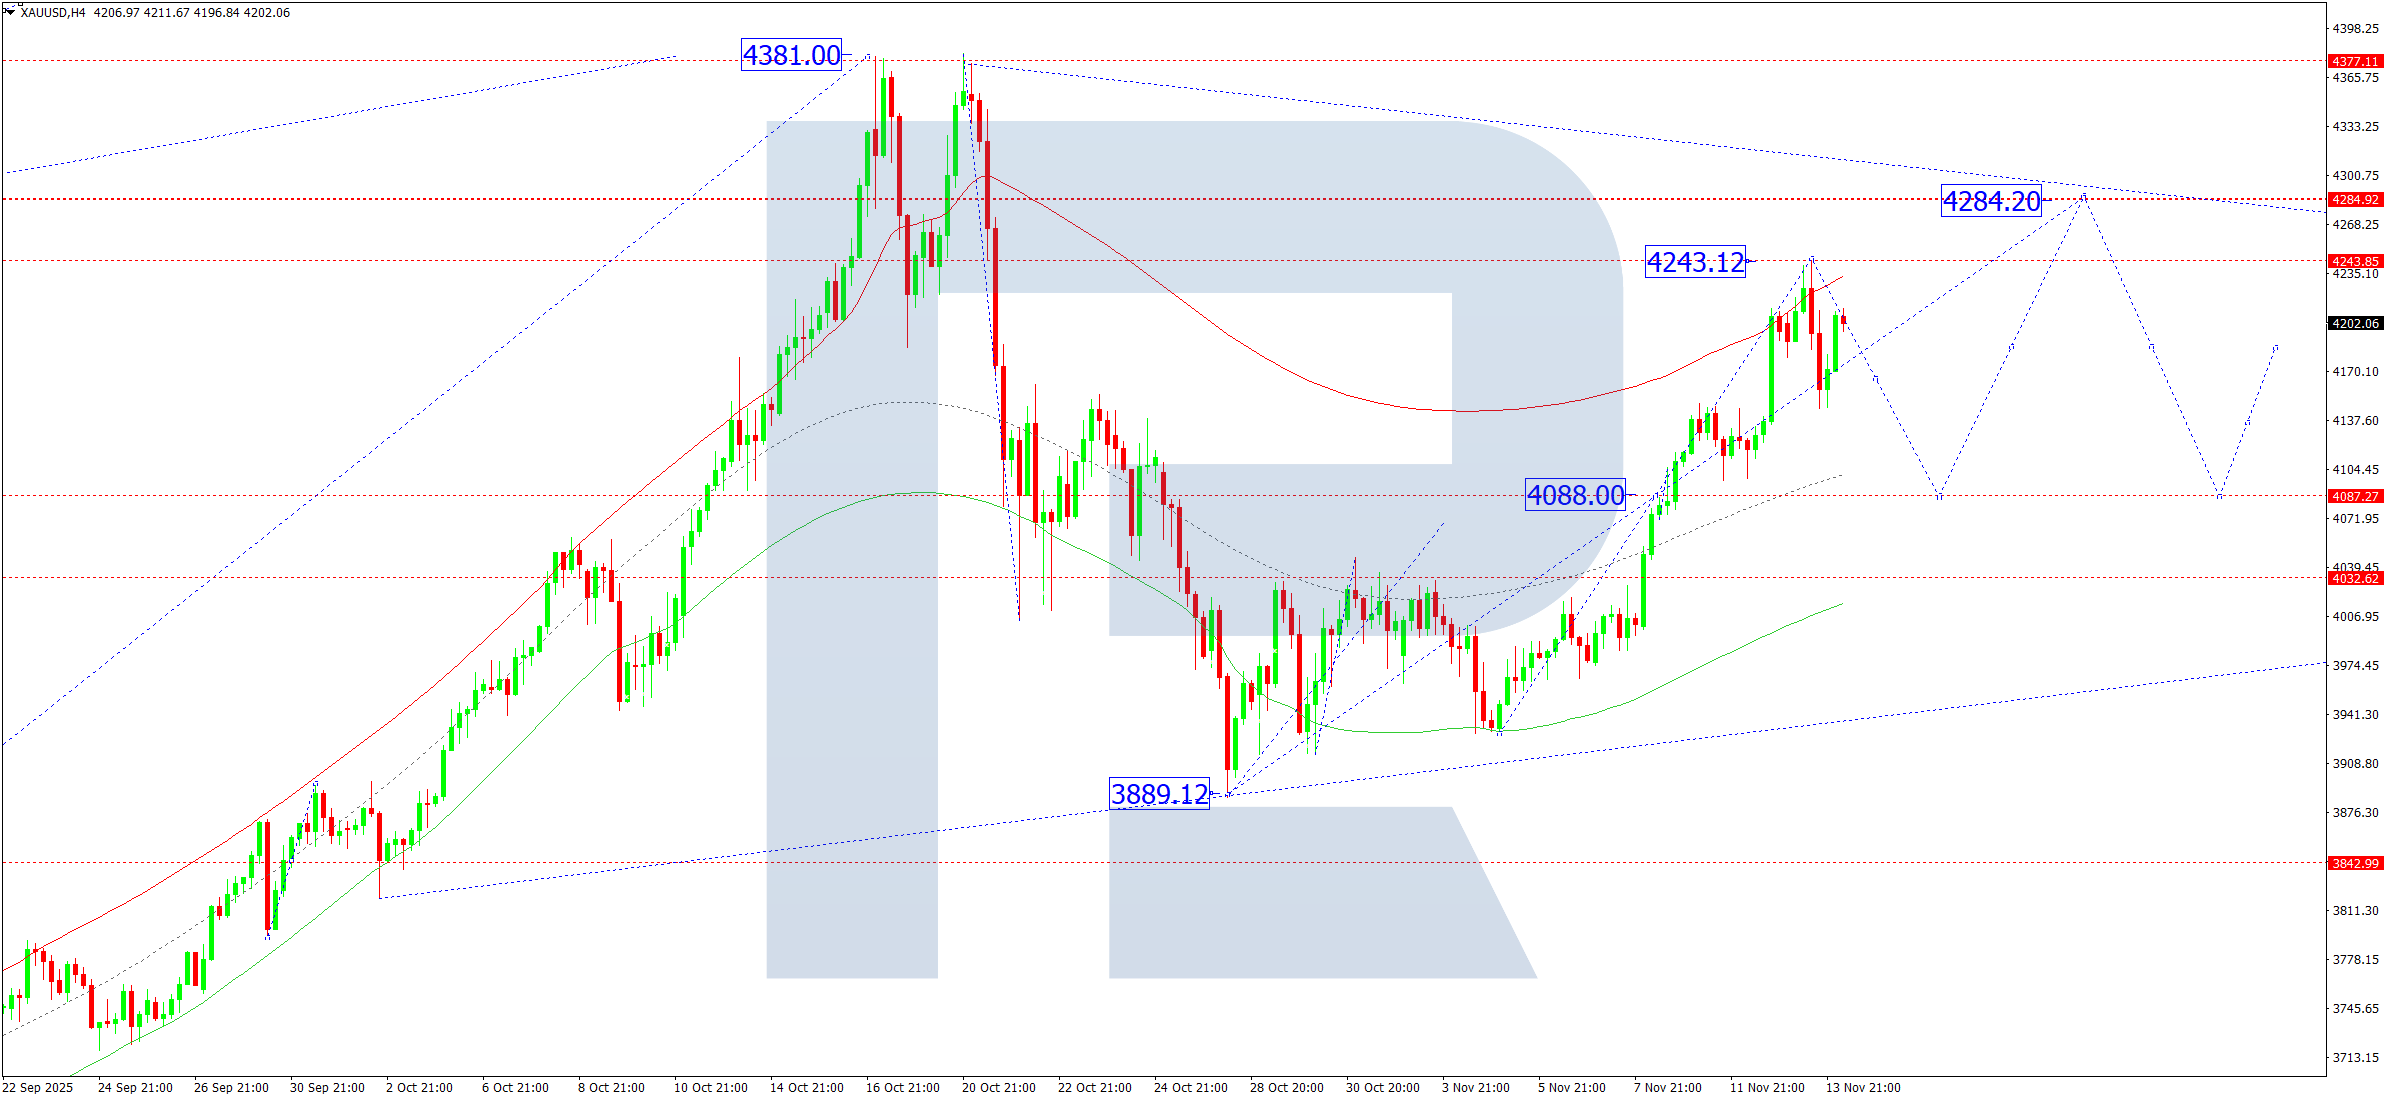
On the H4 chart of XAUUSD, the market completed a growth wave towards 4,243, a local target. On 14 November 2025, a consolidation range is expected to form below this level. A breakout downwards opens the potential for a decline towards 4,088. A breakout upwards suggests the extension of the growth wave towards 4,284.
The Elliott wave structure and the upward wave matrix with a pivot point at 4,088 confirm this scenario as the key structure for XAUUSD. At the moment, the market forms a consolidation range below the upper boundary of the Price Envelope at 4,243. Today’s relevant scenario includes a move towards its central line at 4,088, followed by growth towards its upper boundary at 4,284.
Technical indicators for today’s XAUUSD forecast suggest a correction towards 4,088, followed by an upward wave towards 4,215 and 4,284.
Brent forecast
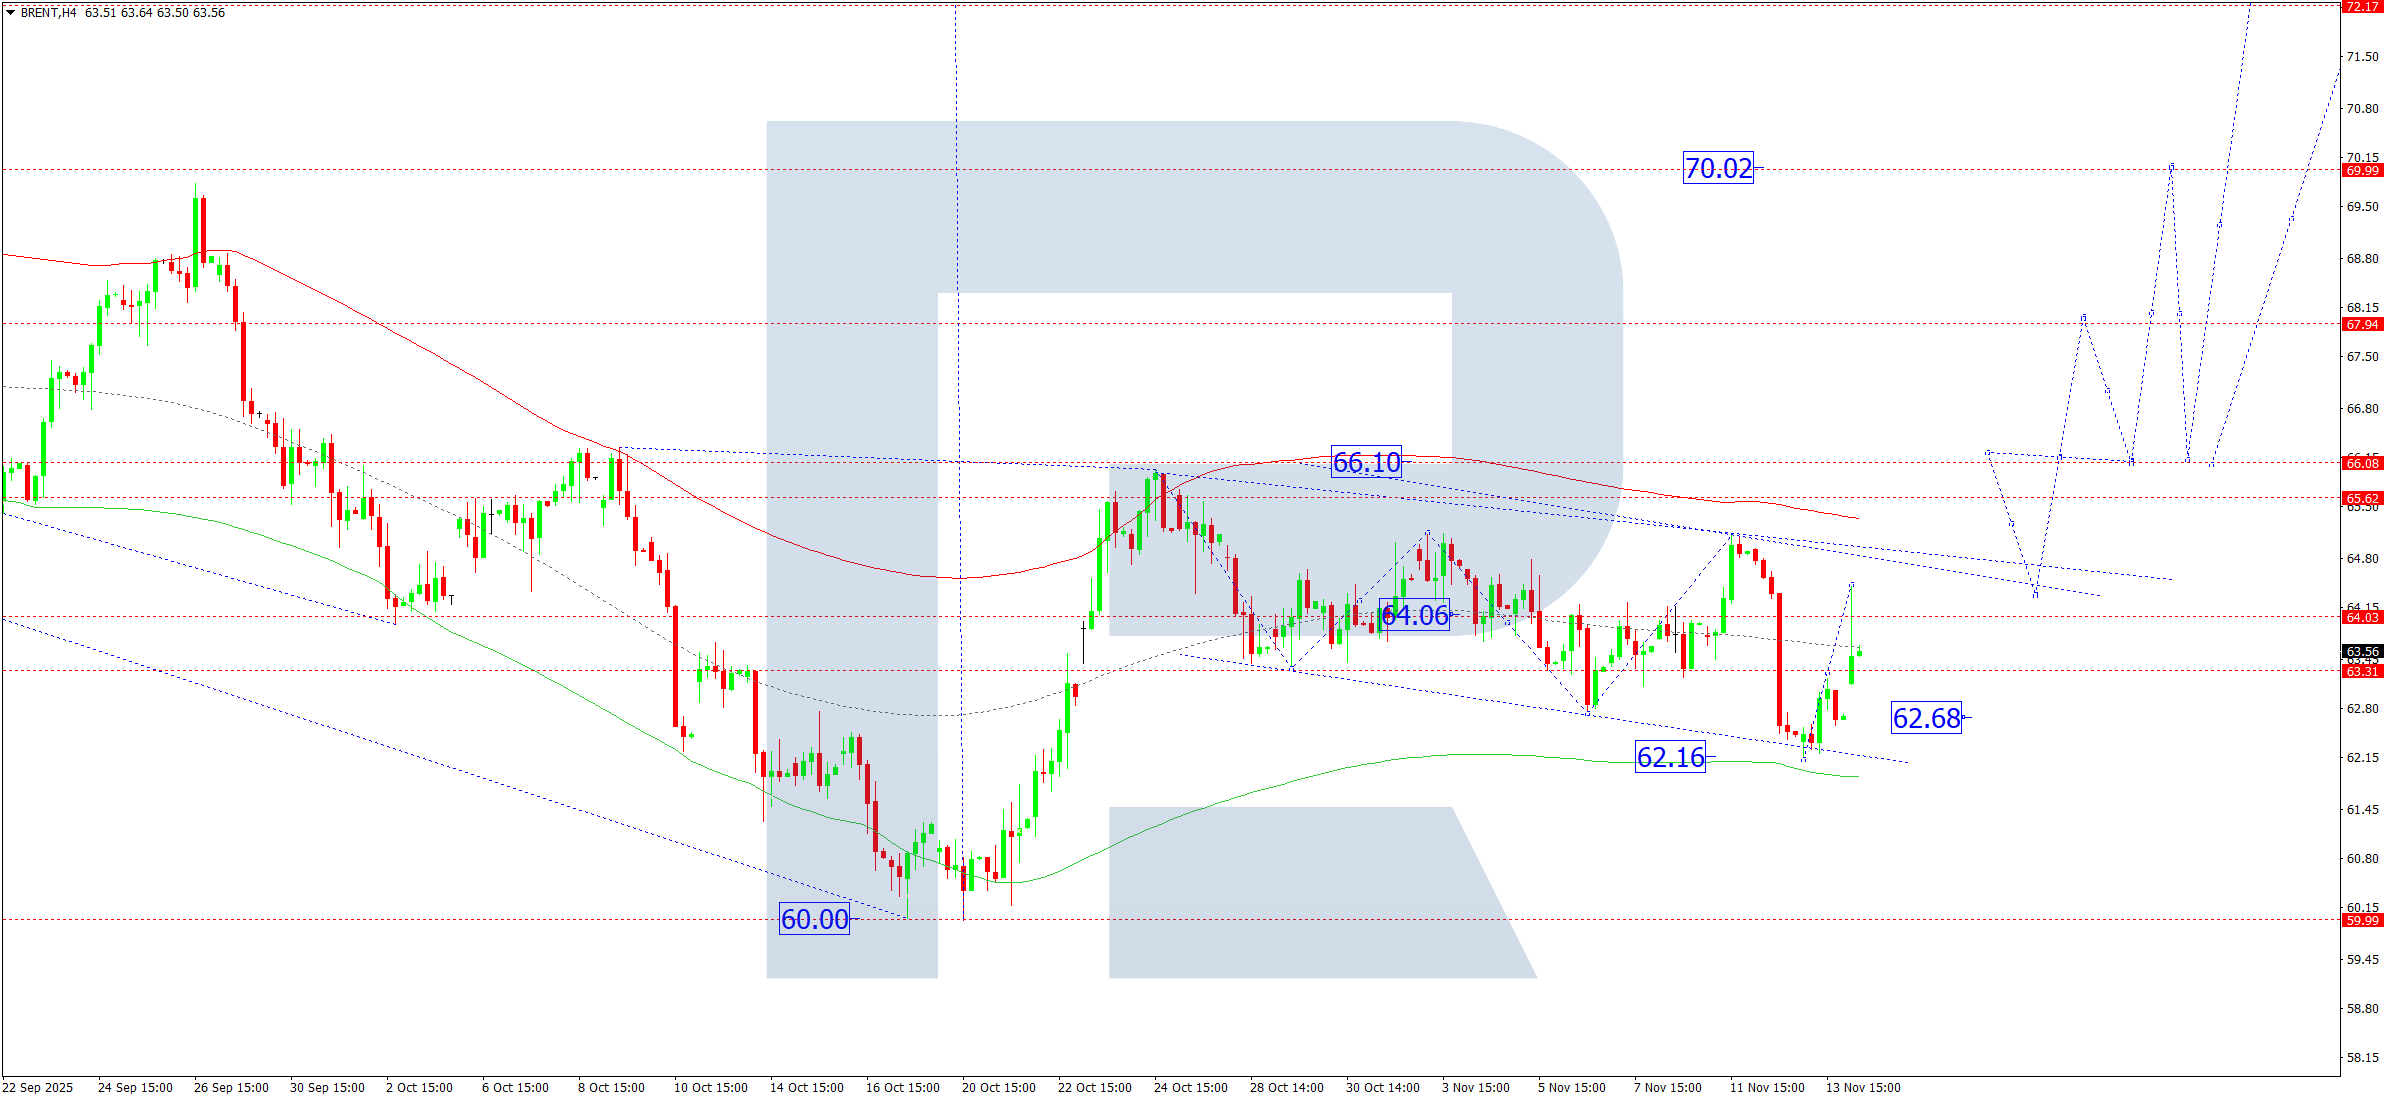
On the H4 chart of Brent crude, the market completed an upward impulse towards 64.44. On 14 November 2025, a corrective move towards 63.33 is possible. The market will effectively outline a new consolidation range. A breakout upwards opens the potential for the continuation of the upward wave towards 66.10. A breakout above 66.10 opens the potential for the trend to extend towards 70.00 as a local target.
The Elliott wave structure and the upward wave matrix with a pivot point at 62.15 confirm this scenario as the key structure for Brent. Currently, the market has completed a correction towards the lower boundary of the Price Envelope at 62.15. Today, an upward movement could start, aiming for its upper boundary at 66.10.
Technical indicators in today’s Brent forecast suggest the beginning of a rise towards 66.10.
Forecasts presented in this section only reflect the author’s private opinion and should not be considered as guidance for trading. RoboForex bears no responsibility for trading results based on trading recommendations described in these analytical reviews.