Daily technical analysis and forecast for 24 November 2025
Here is a detailed daily technical analysis and forecast for EURUSD, USDJPY, GBPUSD, AUDUSD, USDCAD, XAUUSD and Brent for 24 November 2025.
EURUSD forecast
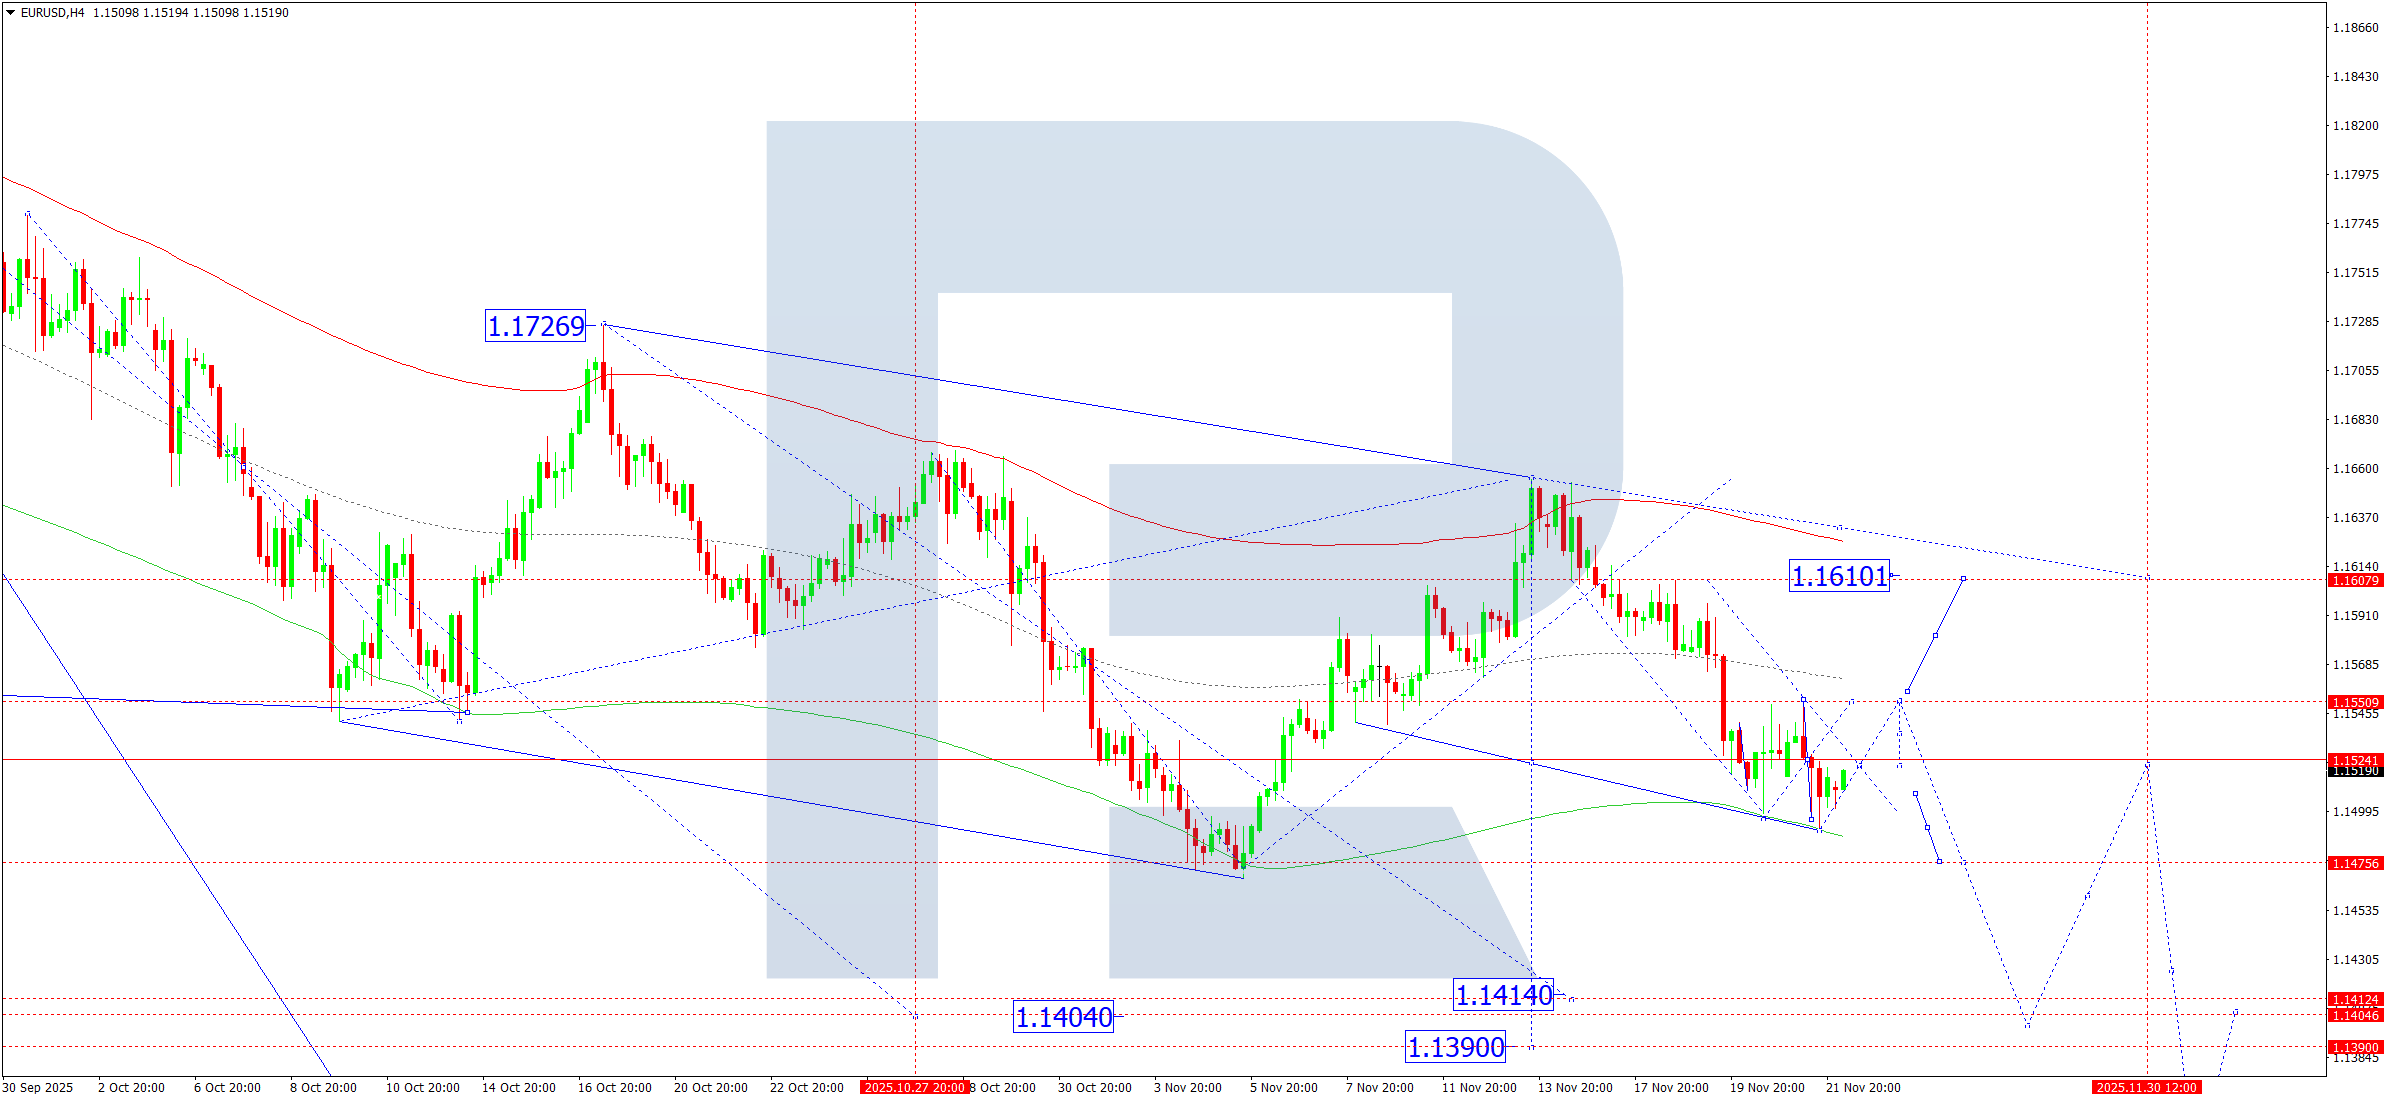
On the H4 chart of EURUSD, the market completed a downward wave towards 1.1491. On 24 November 2025, a compact consolidation range is forming above this level. If the price breaks upwards out of this range, the market opens the potential for a correction towards 1.1550. A downward breakout would open the way for the continuation of the third downward wave along the trend towards 1.1414, 1.1404, and 1.1390.
The Elliott wave structure and the downward wave matrix with a pivot point at 1.1660 confirm this scenario and act as the key elements in the EURUSD wave structure. At the moment, the market completed a downward wave towards the lower boundary of the Price Envelope at 1.1491. Today, the outlook includes a corrective leg towards its central line at 1.1550 at a minimum. A rise towards its upper boundary at 1.1610 cannot be excluded. Afterwards, the scenario includes a new downward wave towards the lower boundary of the Price Envelope at 1.1414.
Technical indicators for today’s EURUSD forecast suggest a corrective move towards 1.1550.
USDJPY forecast
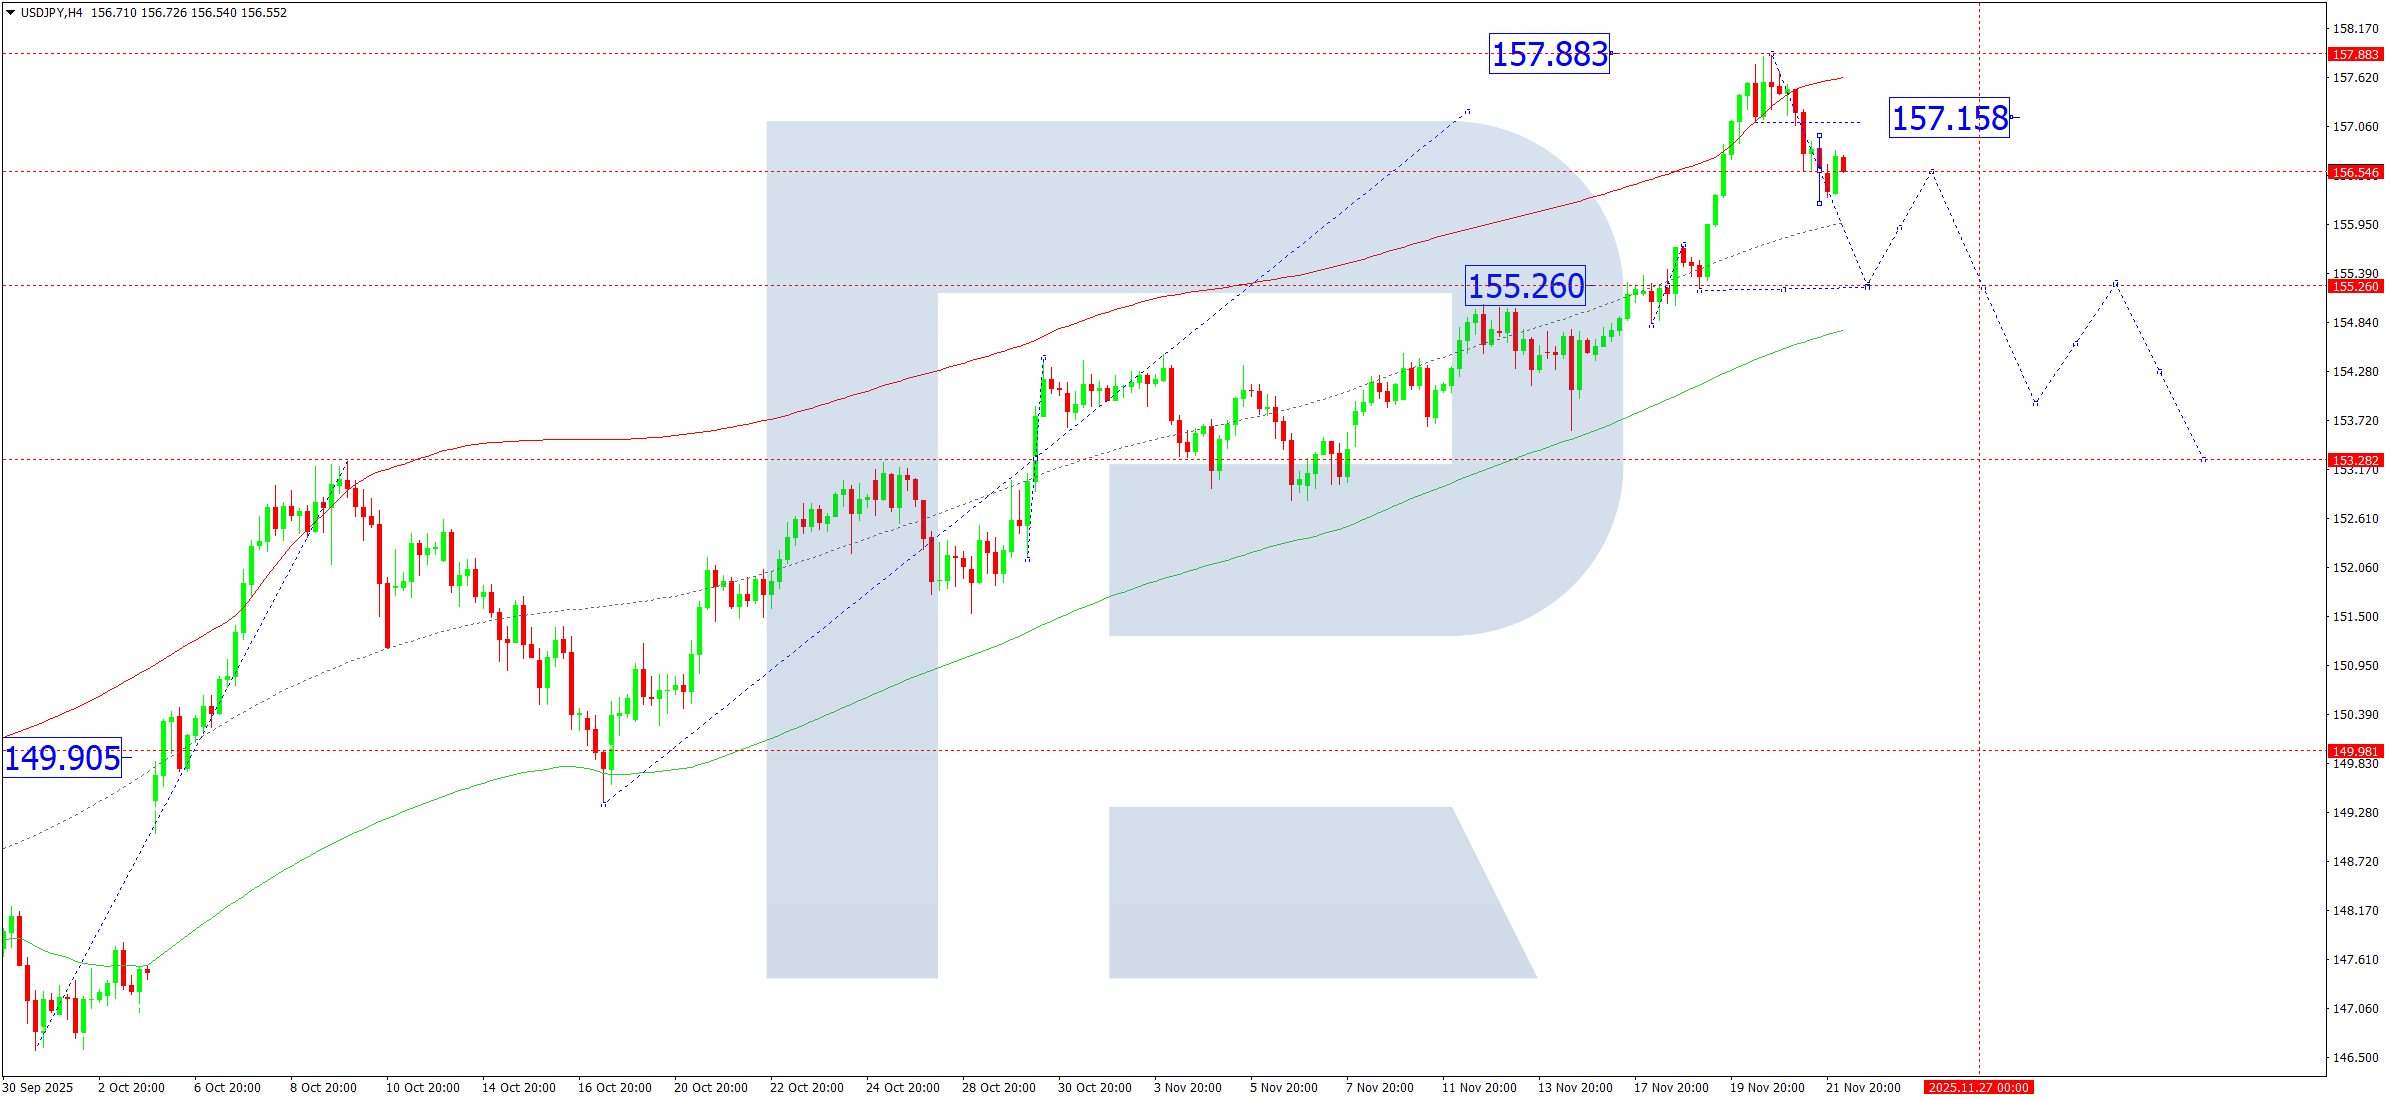
On the H4 chart of USDJPY, the market completed a downward impulse towards 156.19. On 24 November 2025, a compact consolidation range may form above this level. An upward breakout would trigger a correction towards at least 157.15. If the price breaks downwards, the second half of the impulse towards 155.26 (testing from above) remains possible.
The Elliott wave structure and the upward wave matrix with a pivot point at 155.26 confirm this scenario and act as the key elements in this wave structure. At the moment, the market forms a downward wave towards the lower boundary of the Price Envelope at 155.26. Afterwards, a rise towards its central line at 156.56 becomes possible.
Technical indicators for today’s USDJPY forecast suggest a correction towards 155.26.
GBPUSD forecast
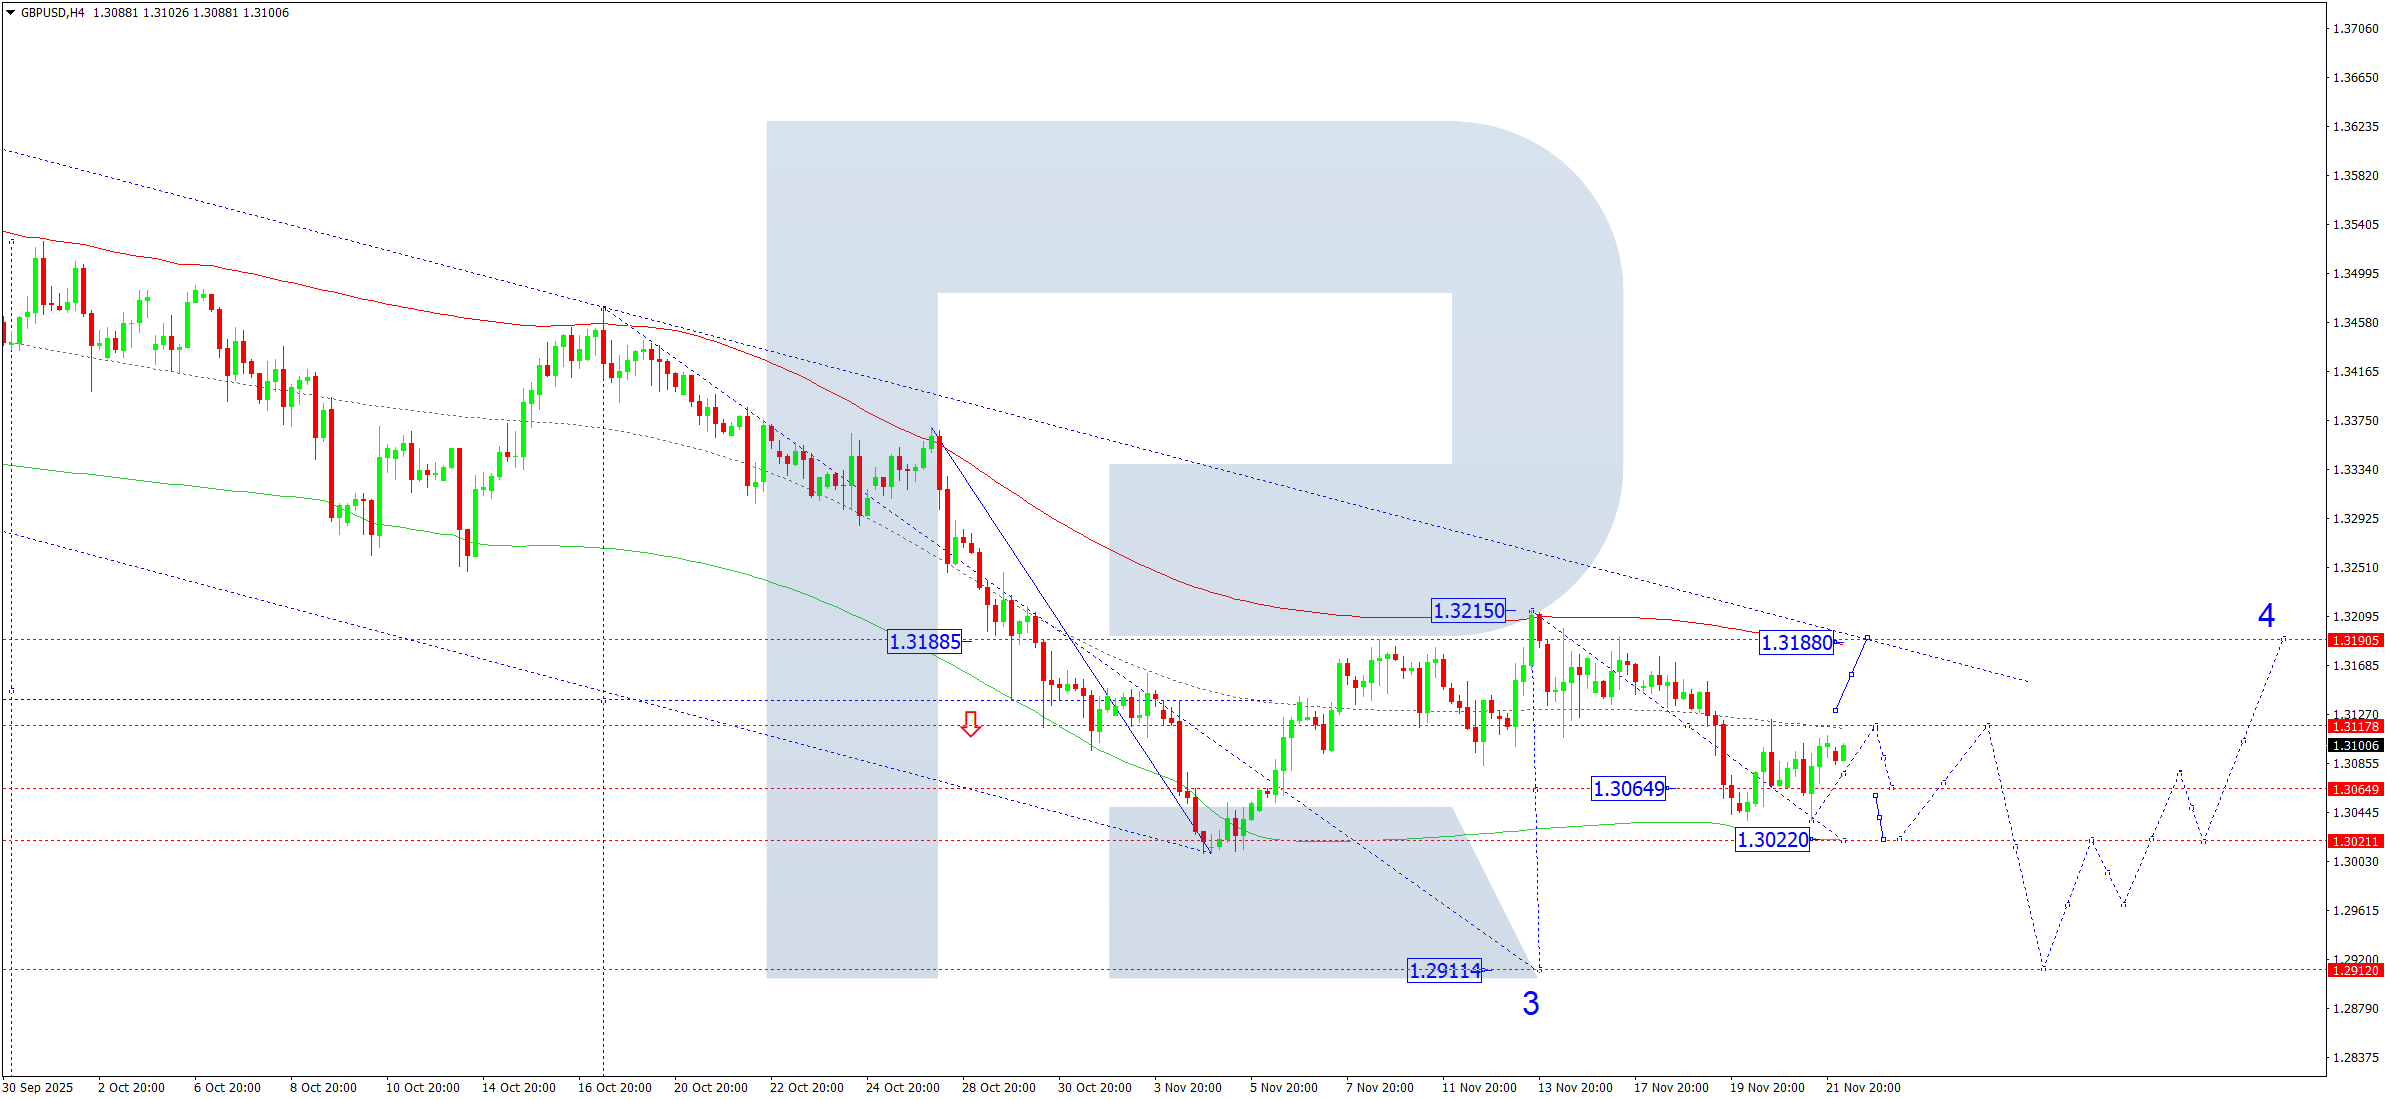
On the H4 chart of GBPUSD, the market completed a downward wave towards 1.3038. On 24 November 2025, a correction towards 1.3118 is expected. The market effectively outlined a new consolidation range around 1.3118. If the price breaks upwards from the range, the market opens the potential for a continued correction towards 1.3188. If the price breaks downwards, the market opens the potential for a wave towards 1.3022, with the potential to extend the trend towards 1.2911 as a local target.
The Elliott wave structure and the downward wave matrix with a pivot point at 1.3188 confirm this scenario and act as the key elements in this wave structure. Today, the scenario includes a continued downward movement towards the lower boundary of the Price Envelope at 1.3022, with the potential to extend the trend towards 1.2990. After this wave completes, a correction towards 1.3118 may follow.
Technical indicators for today’s GBPUSD forecast suggest a continued downward wave towards 1.3022.
AUDUSD forecast
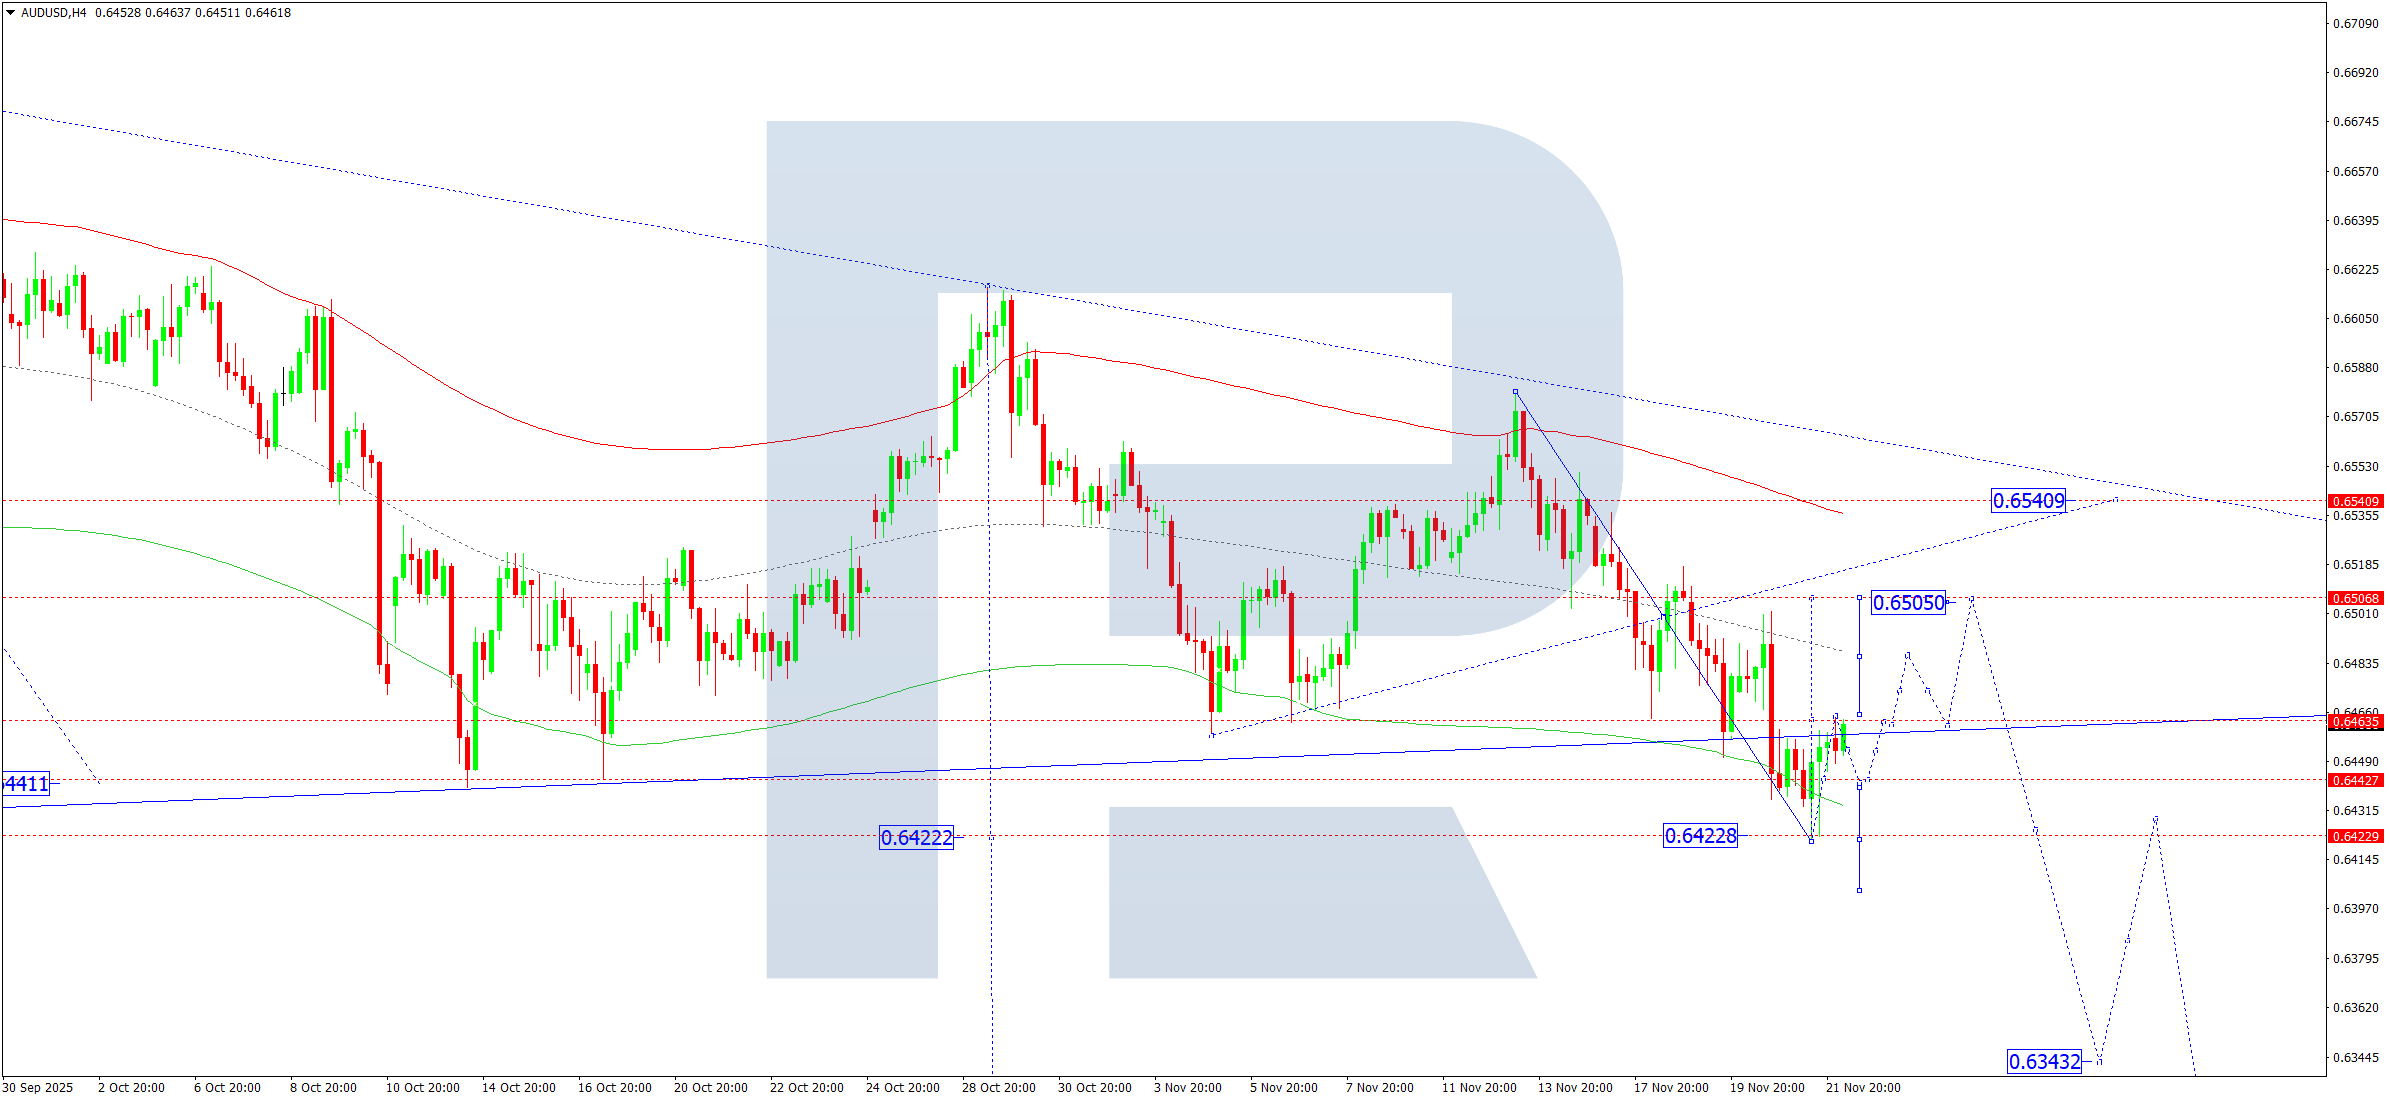
On the H4 chart of AUDUSD, the market reached the local target of the downward wave at 0.6422. On 24 November 2025, the market completed an upward impulse towards 0.6464. A corrective move towards 0.6444 is expected. In this way, the market outlines the boundaries of a new consolidation range. An upward breakout would open the way for a growth wave towards 0.6505, while a downward breakout would open the potential for the continuation of the trend towards 0.6400, with the third downward wave potentially extending towards 0.6343.
The Elliott wave structure and the downward wave matrix in AUDUSD with a pivot point at 0.6505 confirm this scenario and act as the key elements in this wave structure. At the moment, the market completed a downward wave towards the lower boundary of the Price Envelope at 0.6422. Today, the outlook includes a corrective leg towards its central line at 0.6444, followed by continued downward movement towards its lower boundary at 0.6400.
Technical indicators for today’s AUDUSD forecast suggest a corrective potential towards 0.6505.
USDCAD forecast
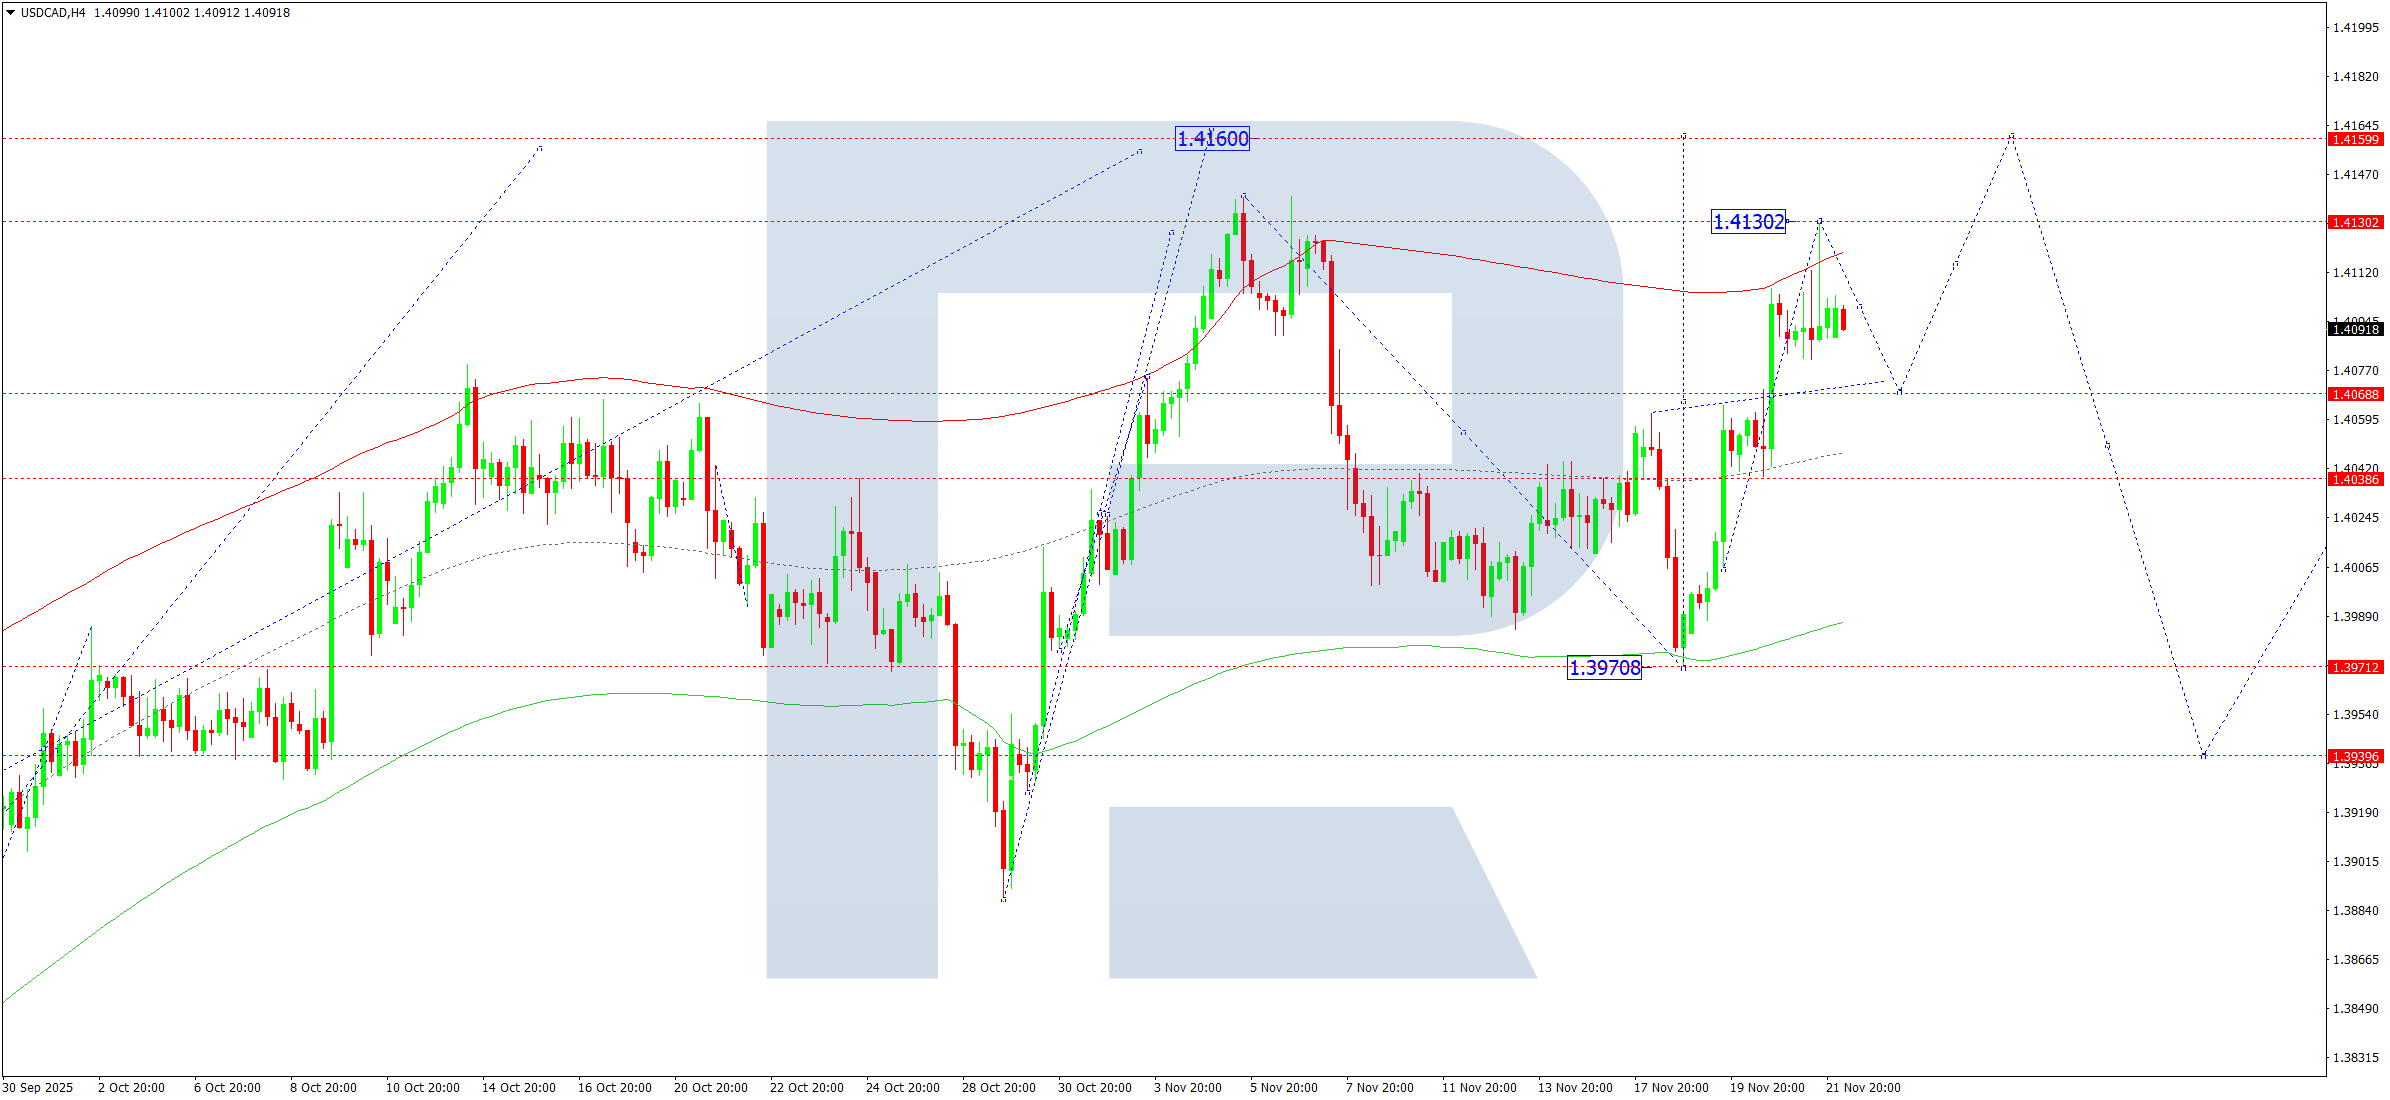
On the H4 chart of USDCAD, the market completed an upward wave towards 1.4132. On 24 November 2025, a compact consolidation range may form below this level. If the price breaks downwards, a corrective move towards 1.4070 becomes possible. An upward breakout would open the potential for an upward wave towards 1.4160 as a local target.
The Elliott wave structure and the upward wave matrix with a pivot point at 1.3939 confirm this scenario and act as the key elements for USDCAD in this wave structure. At the moment, the market completed a wave towards the upper boundary of the Price Envelope at 1.4132. Today, the scenario includes a corrective move towards its central line at 1.4070, followed by an upward wave towards the upper boundary at 1.4160.
Technical indicators for today’s USDCAD forecast suggest a correction towards 1.4070 and a continued upward wave towards 1.4160.
XAUUSD forecast
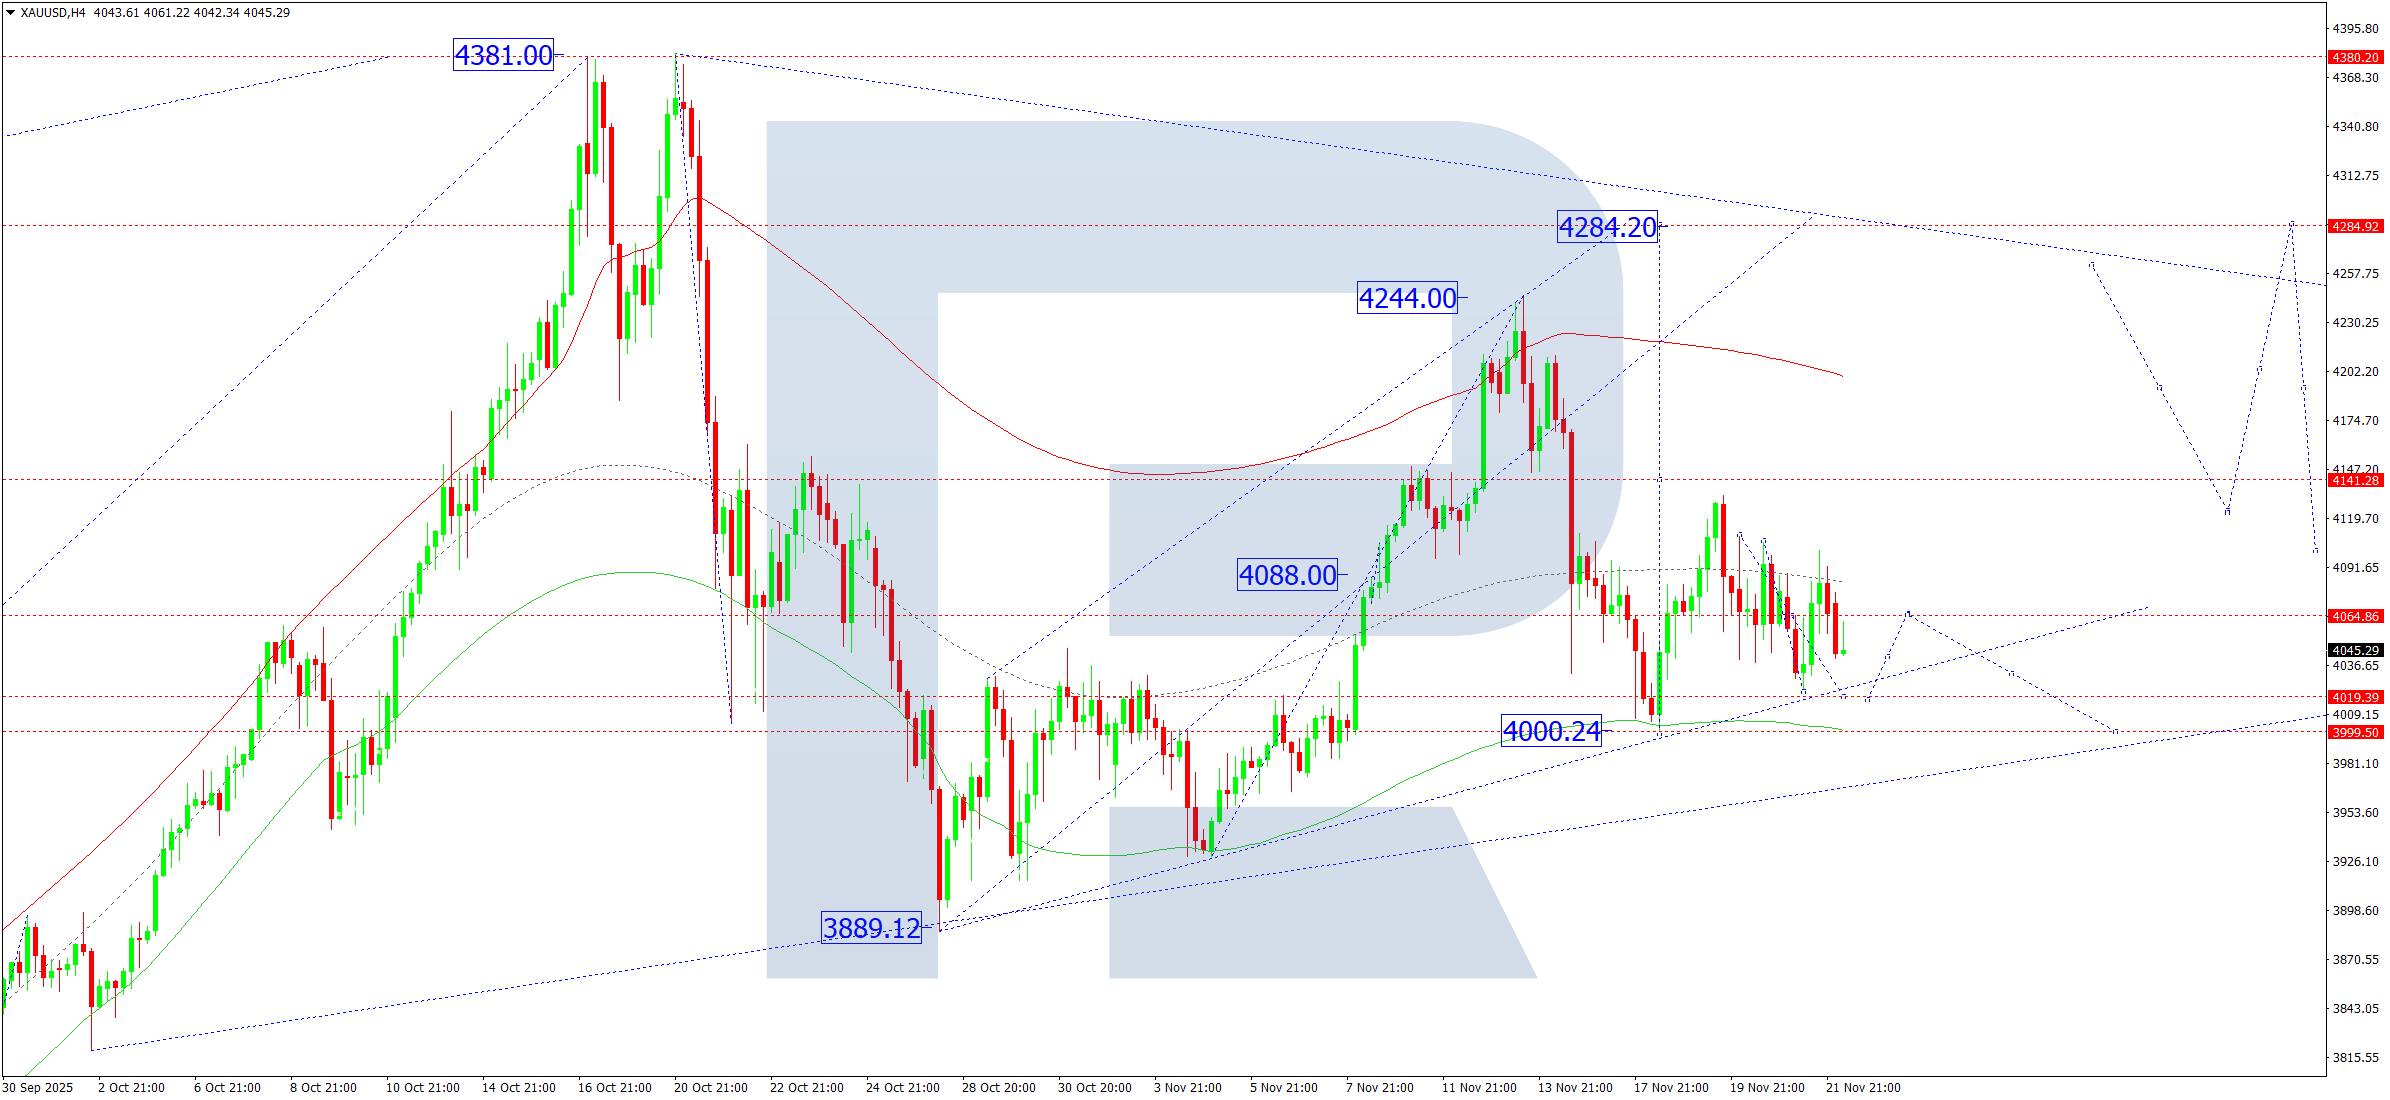
On the H4 chart of XAUUSD, the market forms a consolidation range around 4,064 without a clear directional trend. On 24 November 2025, the market may decline towards 4,019, with the potential to continue the correction towards 4,000. Afterwards, an upward wave towards 4,285 may begin.
The Elliott wave structure and the upward wave matrix with a pivot point at 4,088 confirm this scenario and act as the key elements for XAUUSD in this wave. At the moment, the market continues the correction towards the lower boundary of the Price Envelope at 4,000. Once this correction is complete, an upward wave towards its upper boundary at 4,285 may begin.
Technical indicators for today’s XAUUSD forecast suggest a correction towards 4,000, followed by a rise towards 4,141, 4,208, and 4,284.
Brent forecast
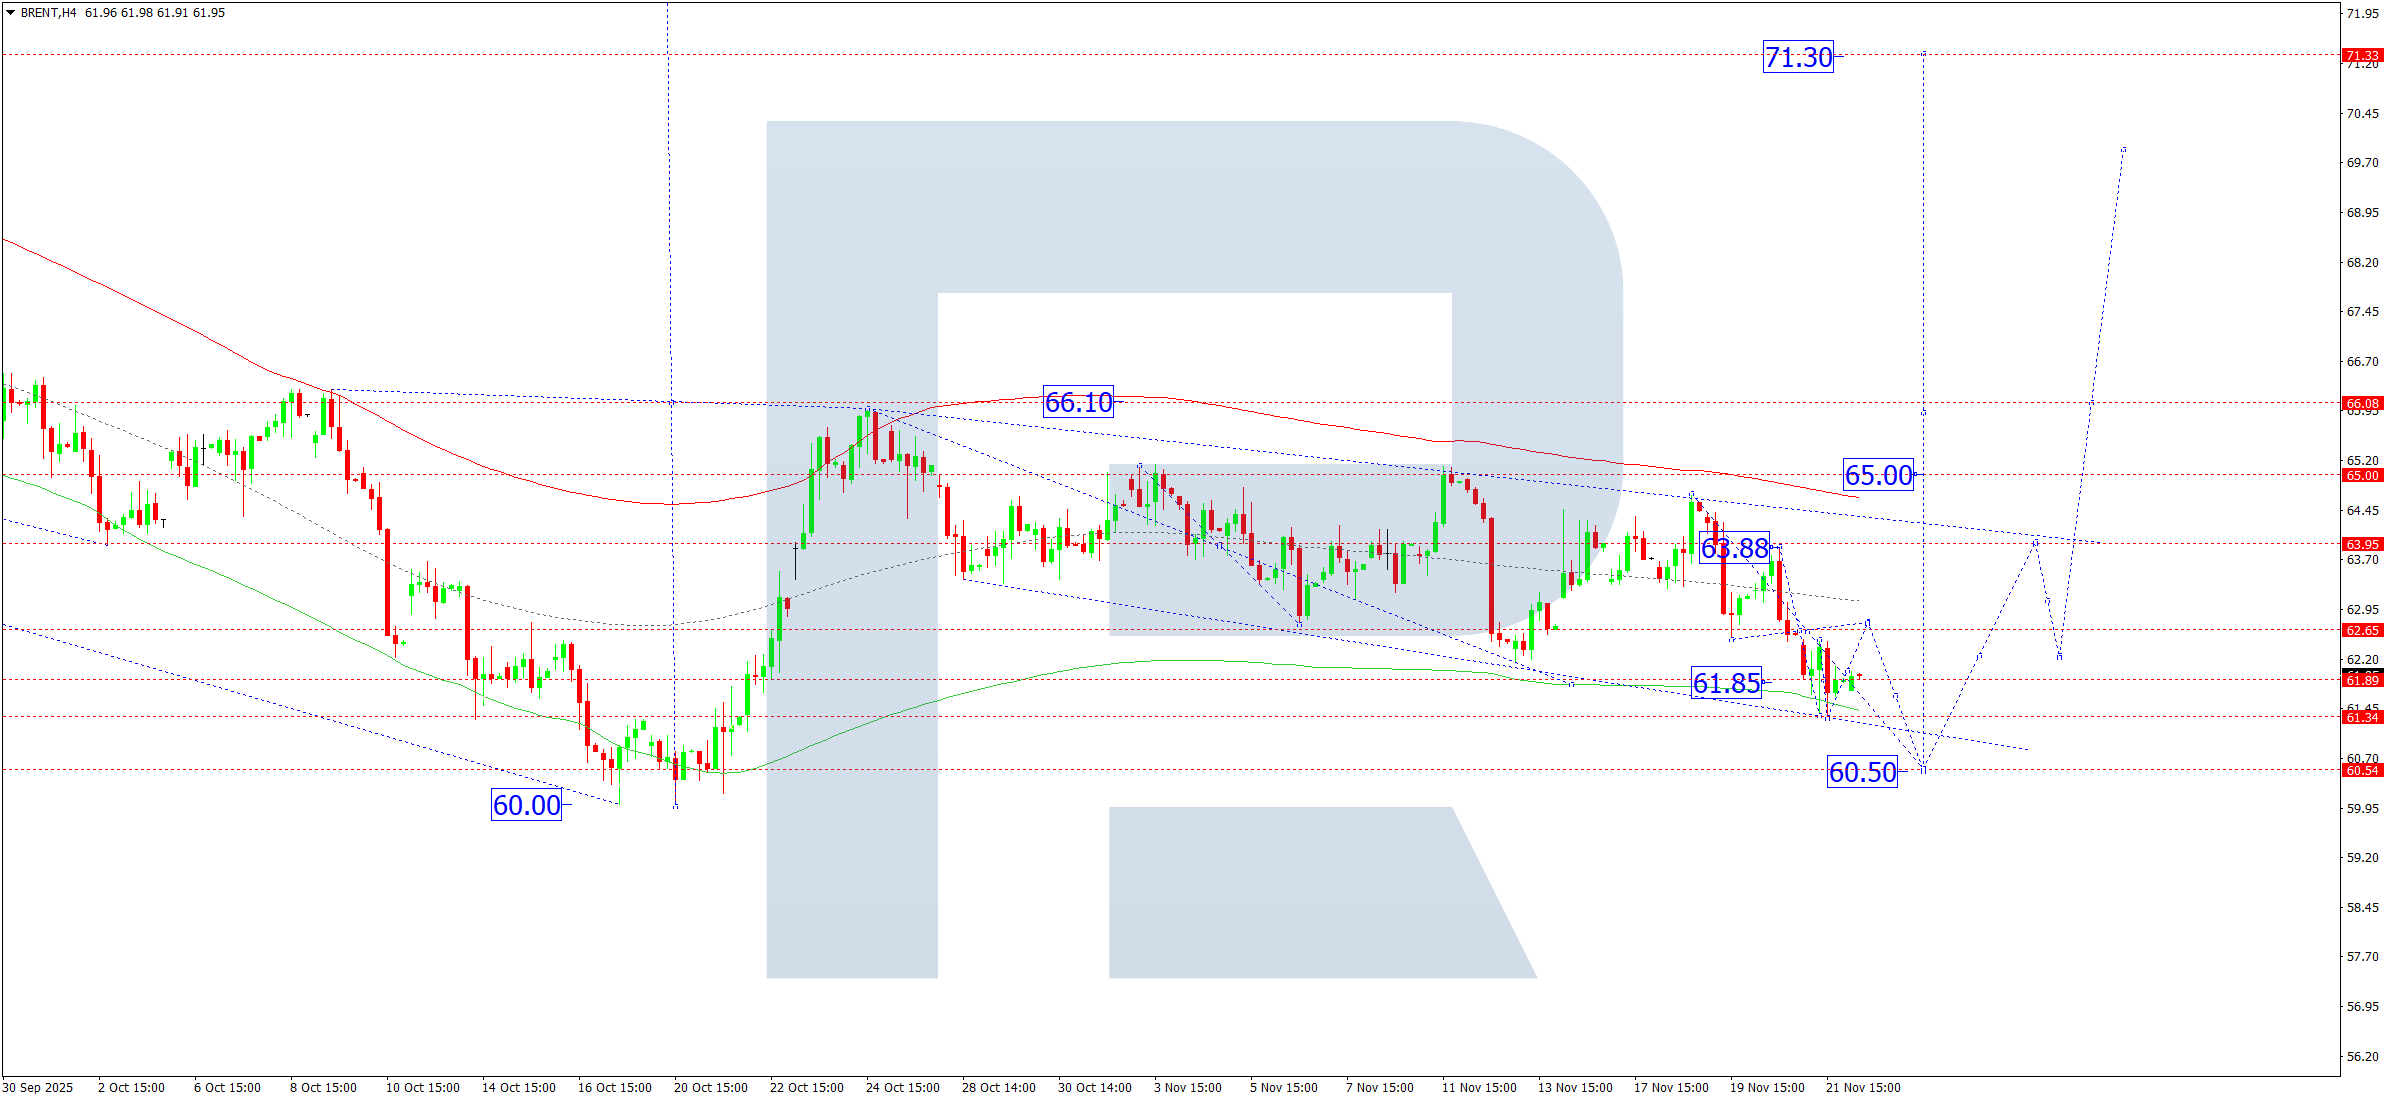
On the H4 chart of Brent crude, the market forms a consolidation range around 61.85. On 24 November 2025, if the price breaks upwards from the range, this would open the door for a continued upward wave towards 66.10, with the potential to extend the wave towards 70.30. A downward breakout could lead to another corrective downward move in the correction towards 60.50. After this correction ends, a rise towards 70.30 becomes possible.
The Elliott wave structure and the upward wave matrix with a pivot point at 64.00 confirm this scenario and act as the key elements for Brent in this wave. The market currently continues the correction towards the lower boundary of the Price Envelope at 60.50. The market formed a consolidation range around 62.62, and today, after a downward breakout, the correction is expected to continue towards its lower boundary at 60.50. If the price breaks upwards out of the range, the market opens the potential for an upward wave towards the upper boundary at 66.10.
Technical indicators for today’s Brent forecast suggest a decline towards 60.50 and a rise towards 66.10.
Forecasts presented in this section only reflect the author’s private opinion and should not be considered as guidance for trading. RoboForex bears no responsibility for trading results based on trading recommendations described in these analytical reviews.