Daily technical analysis and forecast for 27 November 2025
Here is a detailed daily technical analysis and forecast for EURUSD, USDJPY, GBPUSD, AUDUSD, USDCAD, XAUUSD and Brent for 27 November 2025.
EURUSD forecast
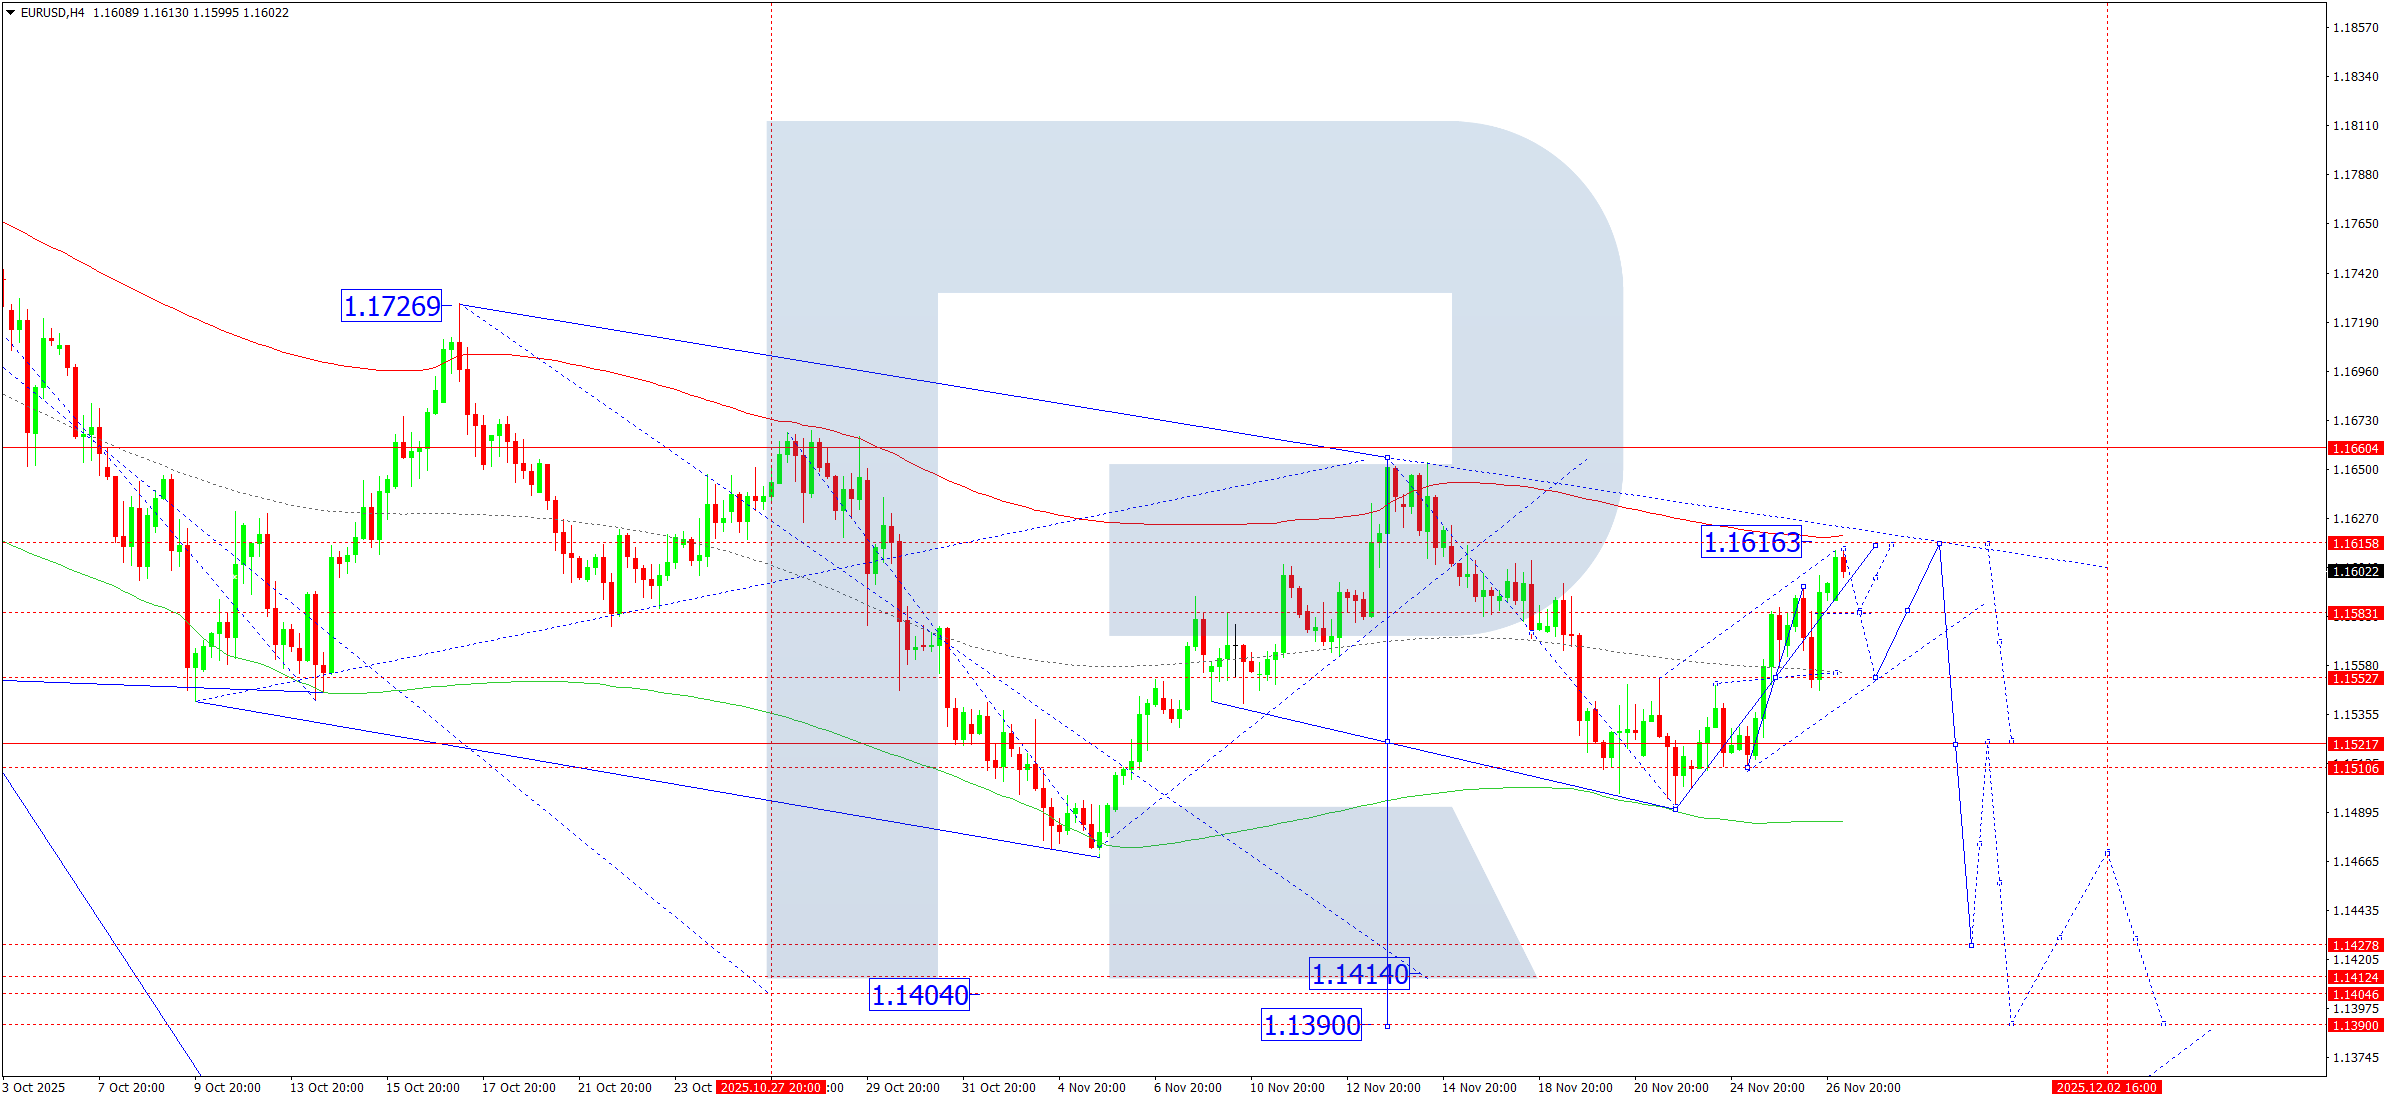
On the H4 chart of EURUSD, the market completed a downward move towards 1.1547 and, after finding support, formed an upward wave towards 1.1613. A compact consolidation range is forming below this level. On 27 November 2025, a downward move towards 1.1583 (testing from above) remains possible, possibly extending towards 1.1555. Afterwards, another upward wave towards 1.1616 becomes likely. This movement will exhaust the correction potential. After the correction completes, the downtrend will continue, with the next downside target at 1.1430 at a minimum.
The Elliott wave structure and the downward wave matrix with a pivot point at 1.1660 confirm this scenario and act as the key elements in the EURUSD wave structure. At the moment, the market forms an upward wave towards the upper boundary of the Price Envelope at 1.1616. Today’s relevant scenario includes the completion of this corrective wave and the start of a decline towards its central line at 1.1555 at a minimum. The wave may also continue towards its lower boundary at 1.1430.
Technical indicators for today’s EURUSD forecast suggest the correction may complete at 1.1616.
USDJPY forecast
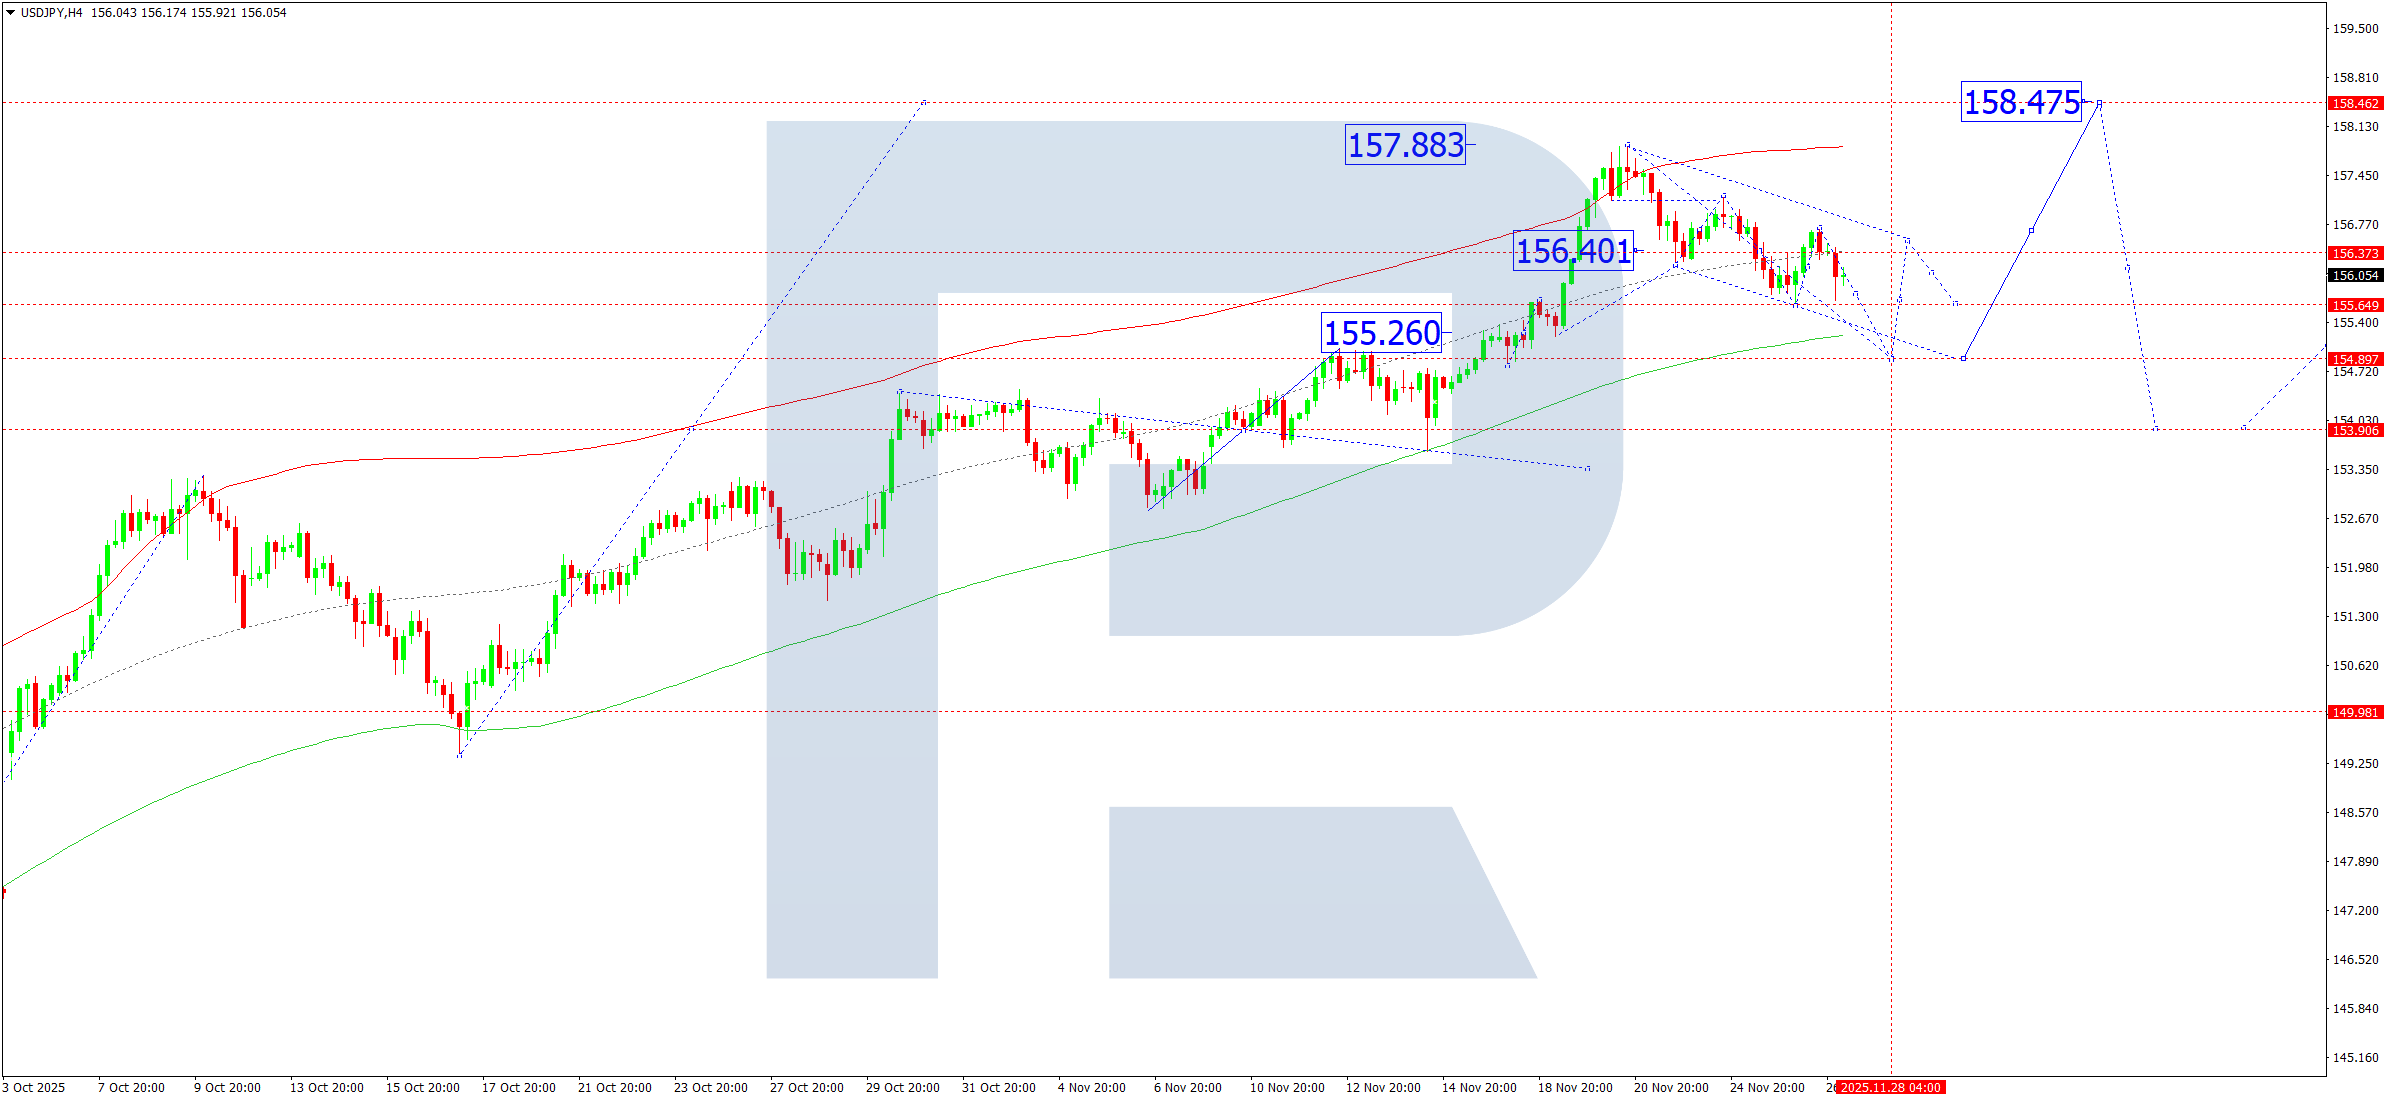
On the H4 chart of USDJPY, the market continues to develop a consolidation range around 156.40. On 27 November 2025, a downward move towards 154.89 remains possible, marking the end of the correction potential. After the correction completes, a new upward wave towards 158.47 at a minimum will come into focus.
The Elliott wave structure and the upward wave matrix with a pivot point at 153.90 confirm this scenario and act as the key elements in this wave structure. At the moment, the market forms a corrective wave towards the lower boundary of the Price Envelope at 154.89. Afterwards, a rise towards its central line at 156.36 becomes possible.
Technical indicators for today’s USDJPY forecast suggest a correction towards 154.89.
GBPUSD forecast
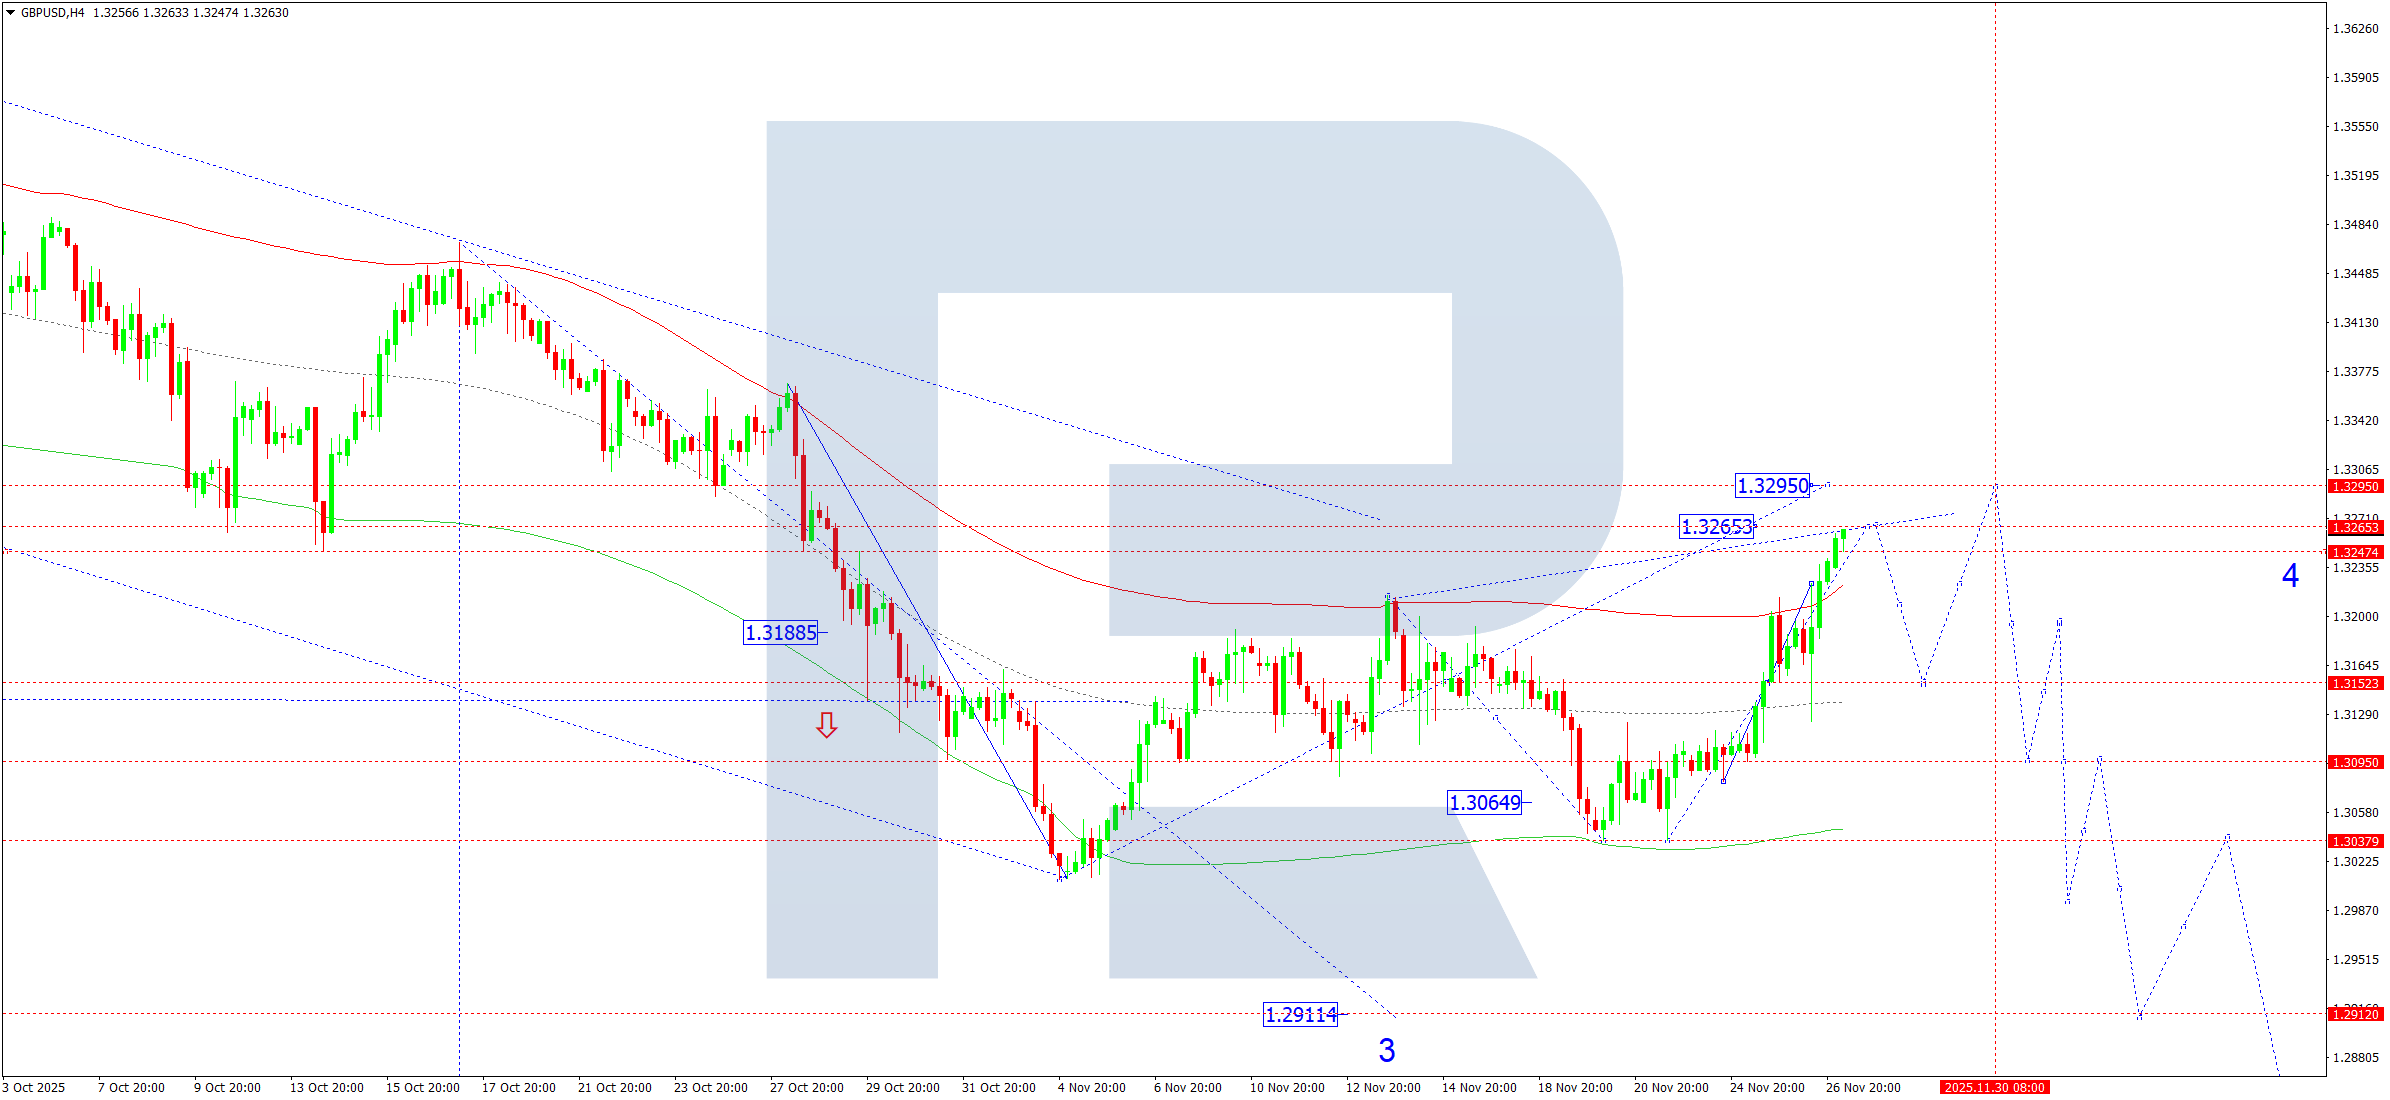
On the H4 chart of GBPUSD, the market built an upward wave structure. On 27 November 2025, the market may achieve the local target at 1.3265 and then start a downward wave towards 1.3150. Afterwards, another rise towards 1.3295 remains possible. This movement will exhaust the correction potential. Once this correction ends, the downtrend will continue. The next target stands at 1.3030, with the potential to extend the wave towards 1.2911 at a minimum.
The Elliott wave structure and the downward wave matrix with a pivot point at 1.3188 confirm this scenario and act as the key elements in this wave structure. Today’s outlook includes a continued corrective wave towards the upper boundary of the Price Envelope at 1.3295. After this wave completes, a decline towards its lower boundary at 1.3030 may begin.
Technical indicators for today’s GBPUSD forecast suggest a continued rise towards 1.3295, followed by a downward wave towards 1.3030.
AUDUSD forecast
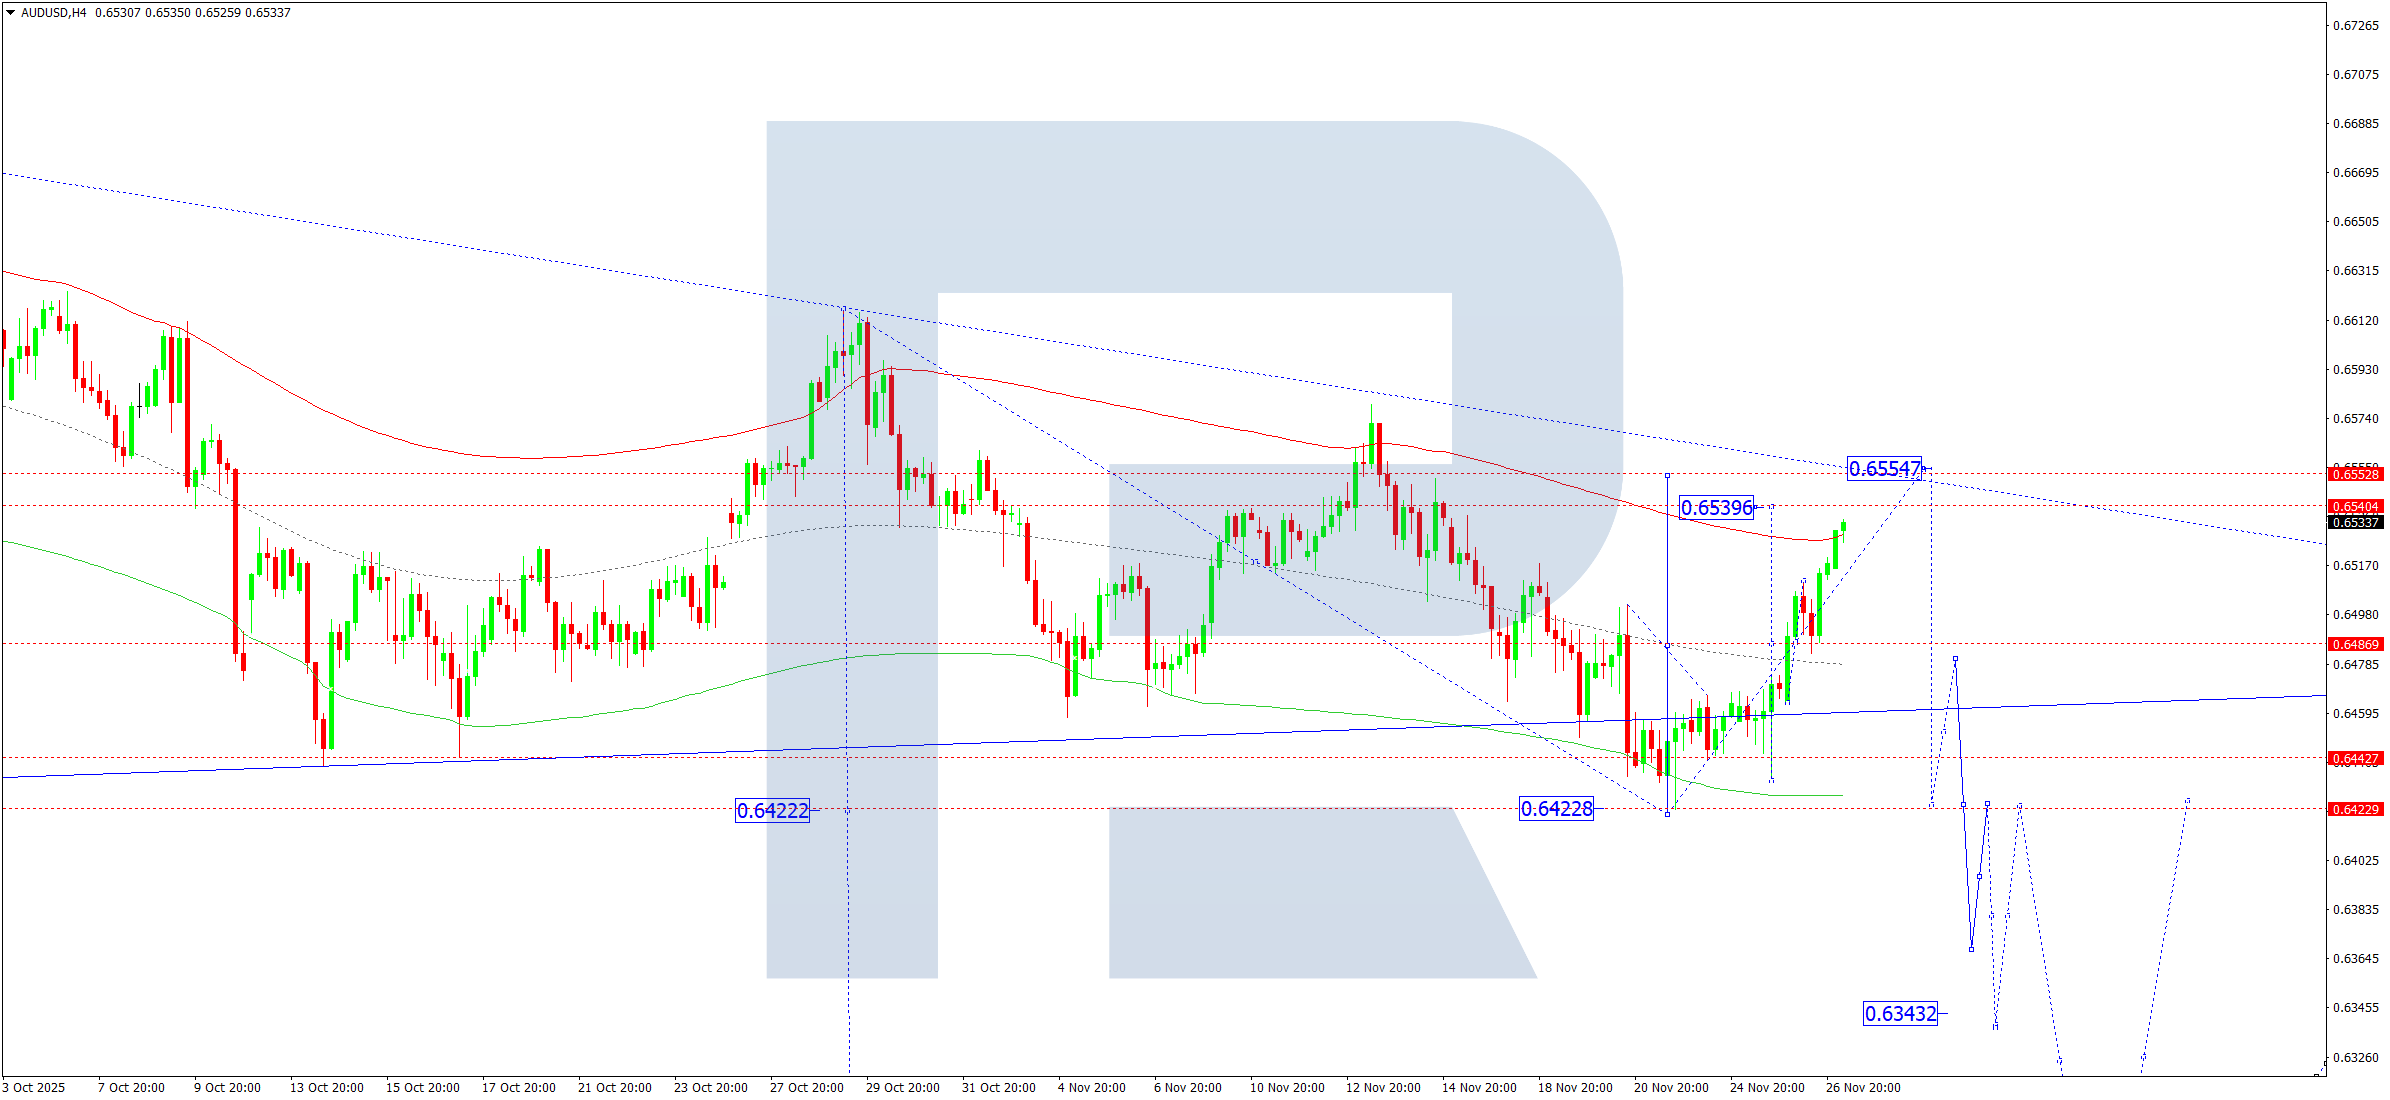
On the H4 chart of AUDUSD, the market continues an upward wave towards 0.6539. On 27 November 2025,the pair is expected to reach this target level. Afterwards, a downward move towards 0.6464 (testing from above) is expected. Then, the market may extend the correction towards 0.6555. Once this correction completes, a new downward wave towards 0.6420 may follow, with the trend possibly extending towards 0.6343.
The Elliott wave structure and the downward wave matrix with a pivot point at 0.6505 confirm this scenario and act as the key elements in this wave structure. At the moment, the market is undergoing a correction towards the upper boundary of the Price Envelope at 0.6555. Today’s expectation includes the completion of this correction and the start of a downward wave towards its lower boundary at 0.6420.
Technical indicators for today’s AUDUSD forecast suggest a correction towards 0.6555, followed by a decline towards 0.6420.
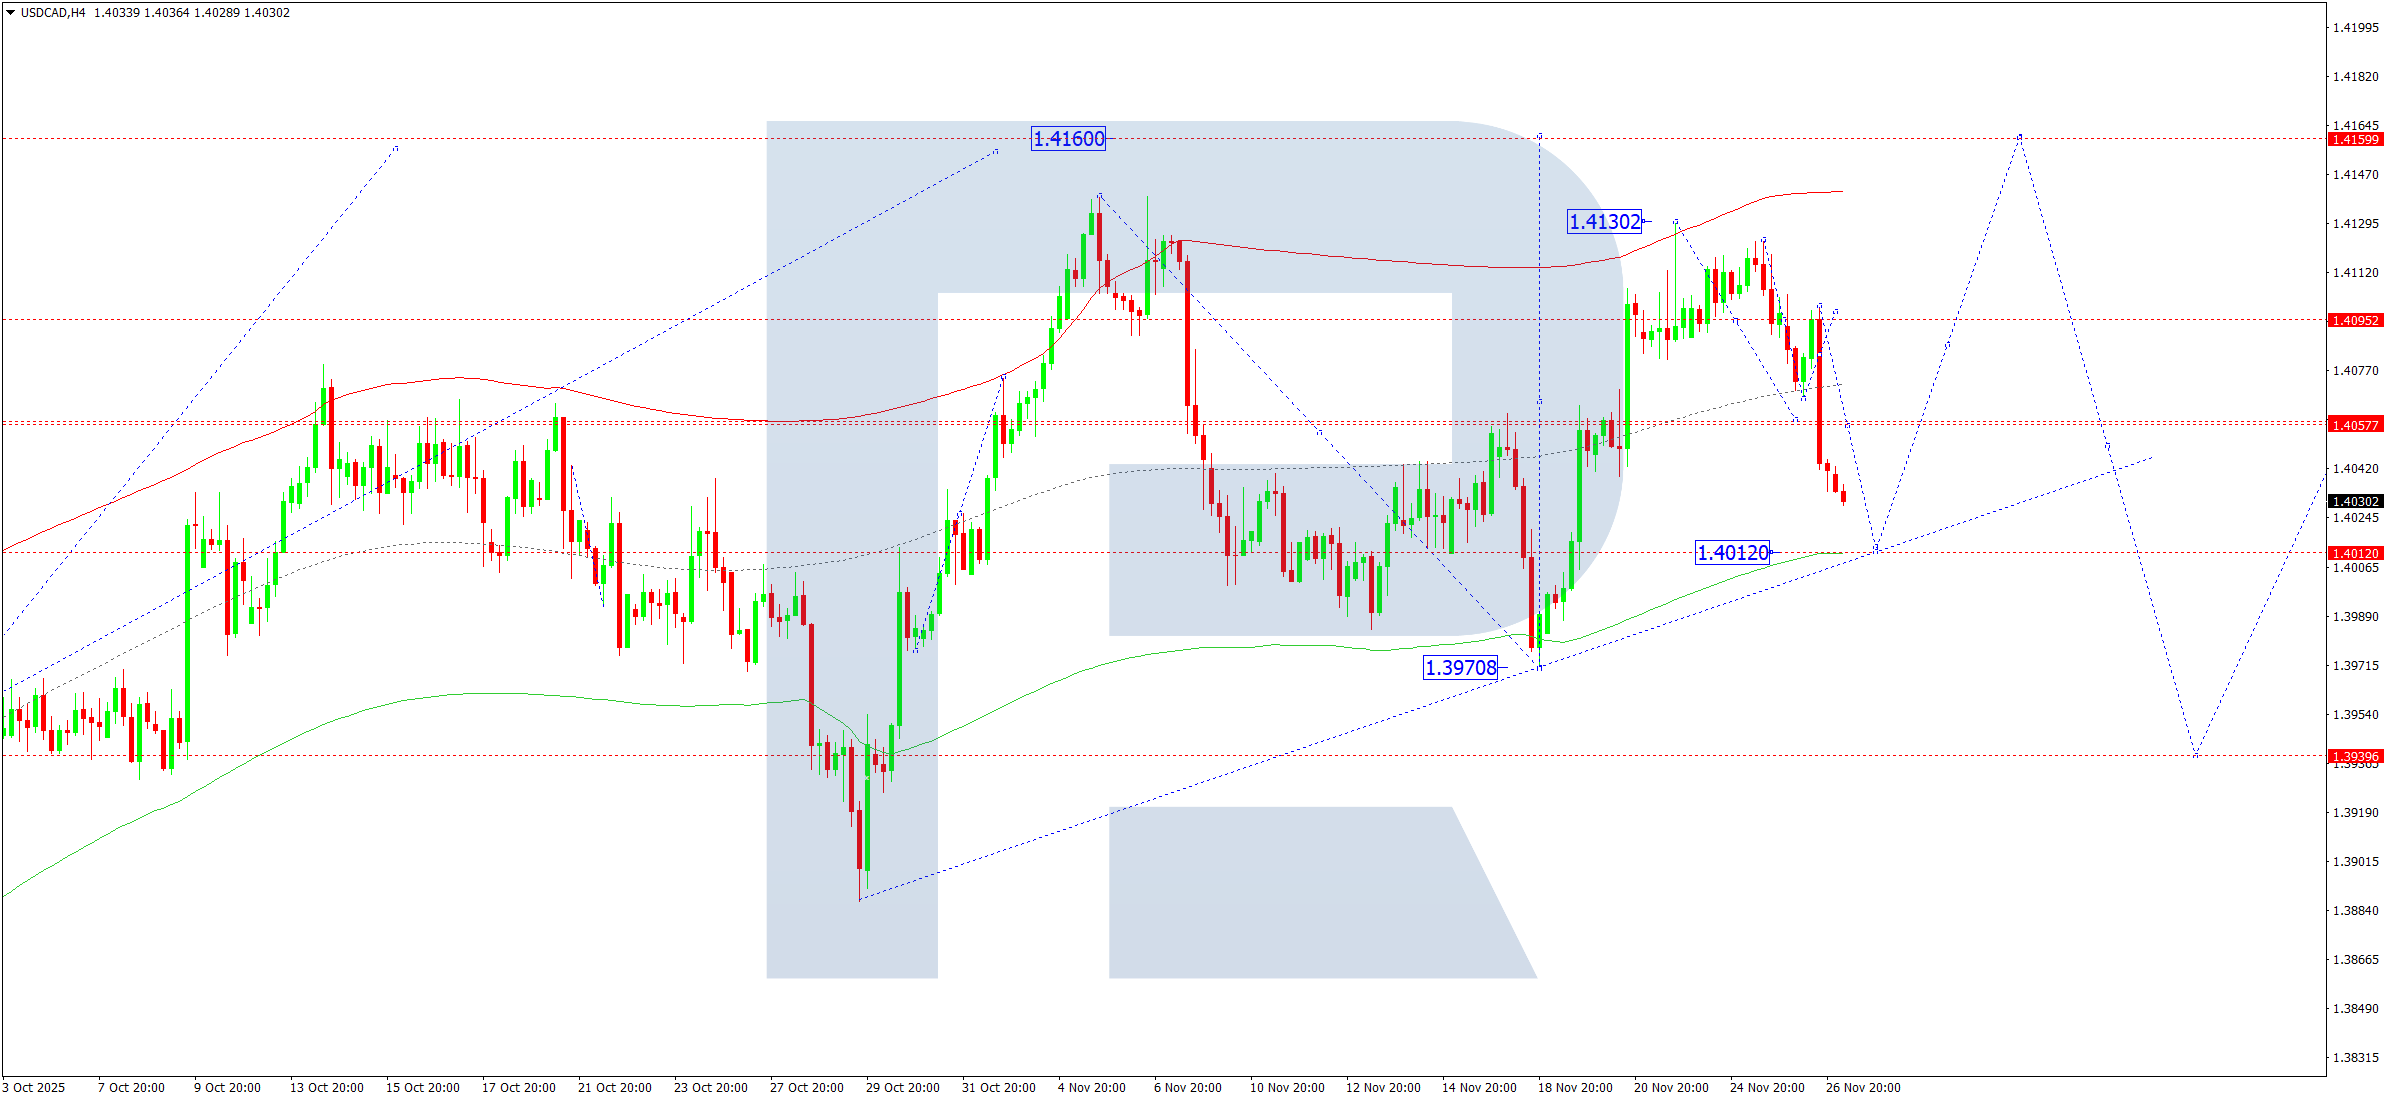
USDCAD forecast
On the H4 chart of USDCAD, the market completed a correction towards 1.4055. On 27 November 2025, a compact consolidation range formed around this level and, after breaking downwards, the correction continues towards 1.4012. After the correction completes, a new upward wave towards 1.4160 as a local target may begin.
The Elliott wave structure and the upward wave matrix with a pivot point at 1.3939 confirm this scenario and act as the key elements for USDCAD in this wave structure. At the moment, the market is undergoing a correction towards the lower boundary of the Price Envelope at 1.4012. After the correction ends, a new upward wave towards its upper boundary at 1.4160 may start.
Technical indicators for today’s USDCAD forecast suggest a correction towards 1.4012, followed by continued upward movement towards 1.4160.
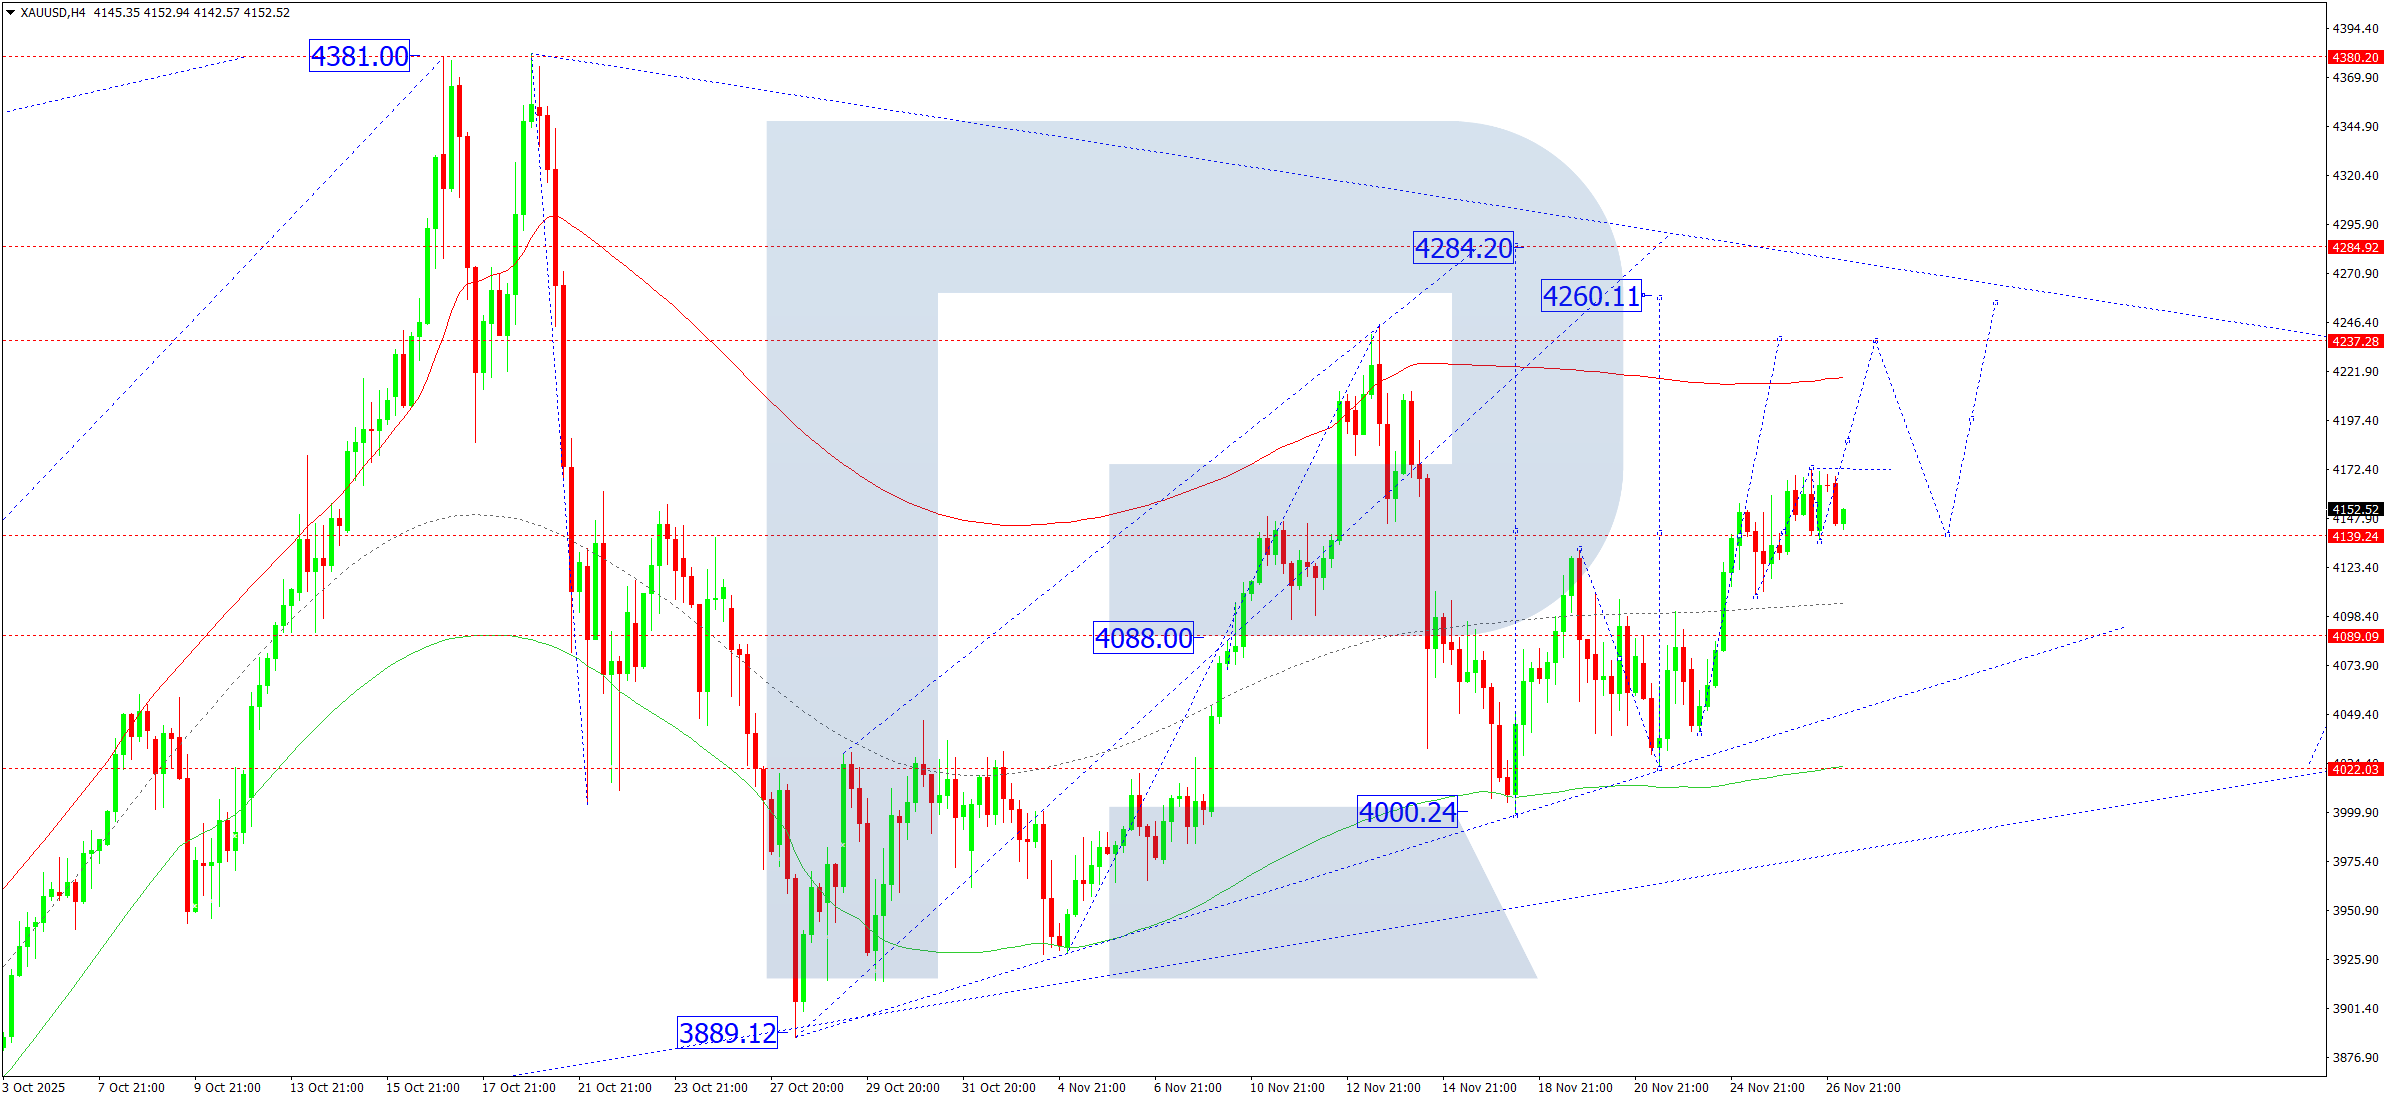
XAUUSD forecast
On the H4 chart of XAUUSD, the market is forming a consolidation range around 4,141 without a clear directional trend. On 27 November 2025, an upward breakout from this range remains possible, with a target at 4,260. Afterwards, a correction towards 4,141 (testing from above) may follow, and then a rise towards 4,285.
The Elliott wave structure and the upward wave matrix with a pivot point at 4,088 confirm this scenario and act as the key elements for XAUUSD in this wave. Currently, the market continues to develop the fifth upward wave towards the upper boundary of the Price Envelope at 4,260. After this level is reached, a correction towards its central line at 4,141 may begin.
Technical indicators for today’s XAUUSD forecast suggest a possible rise towards 4,260.
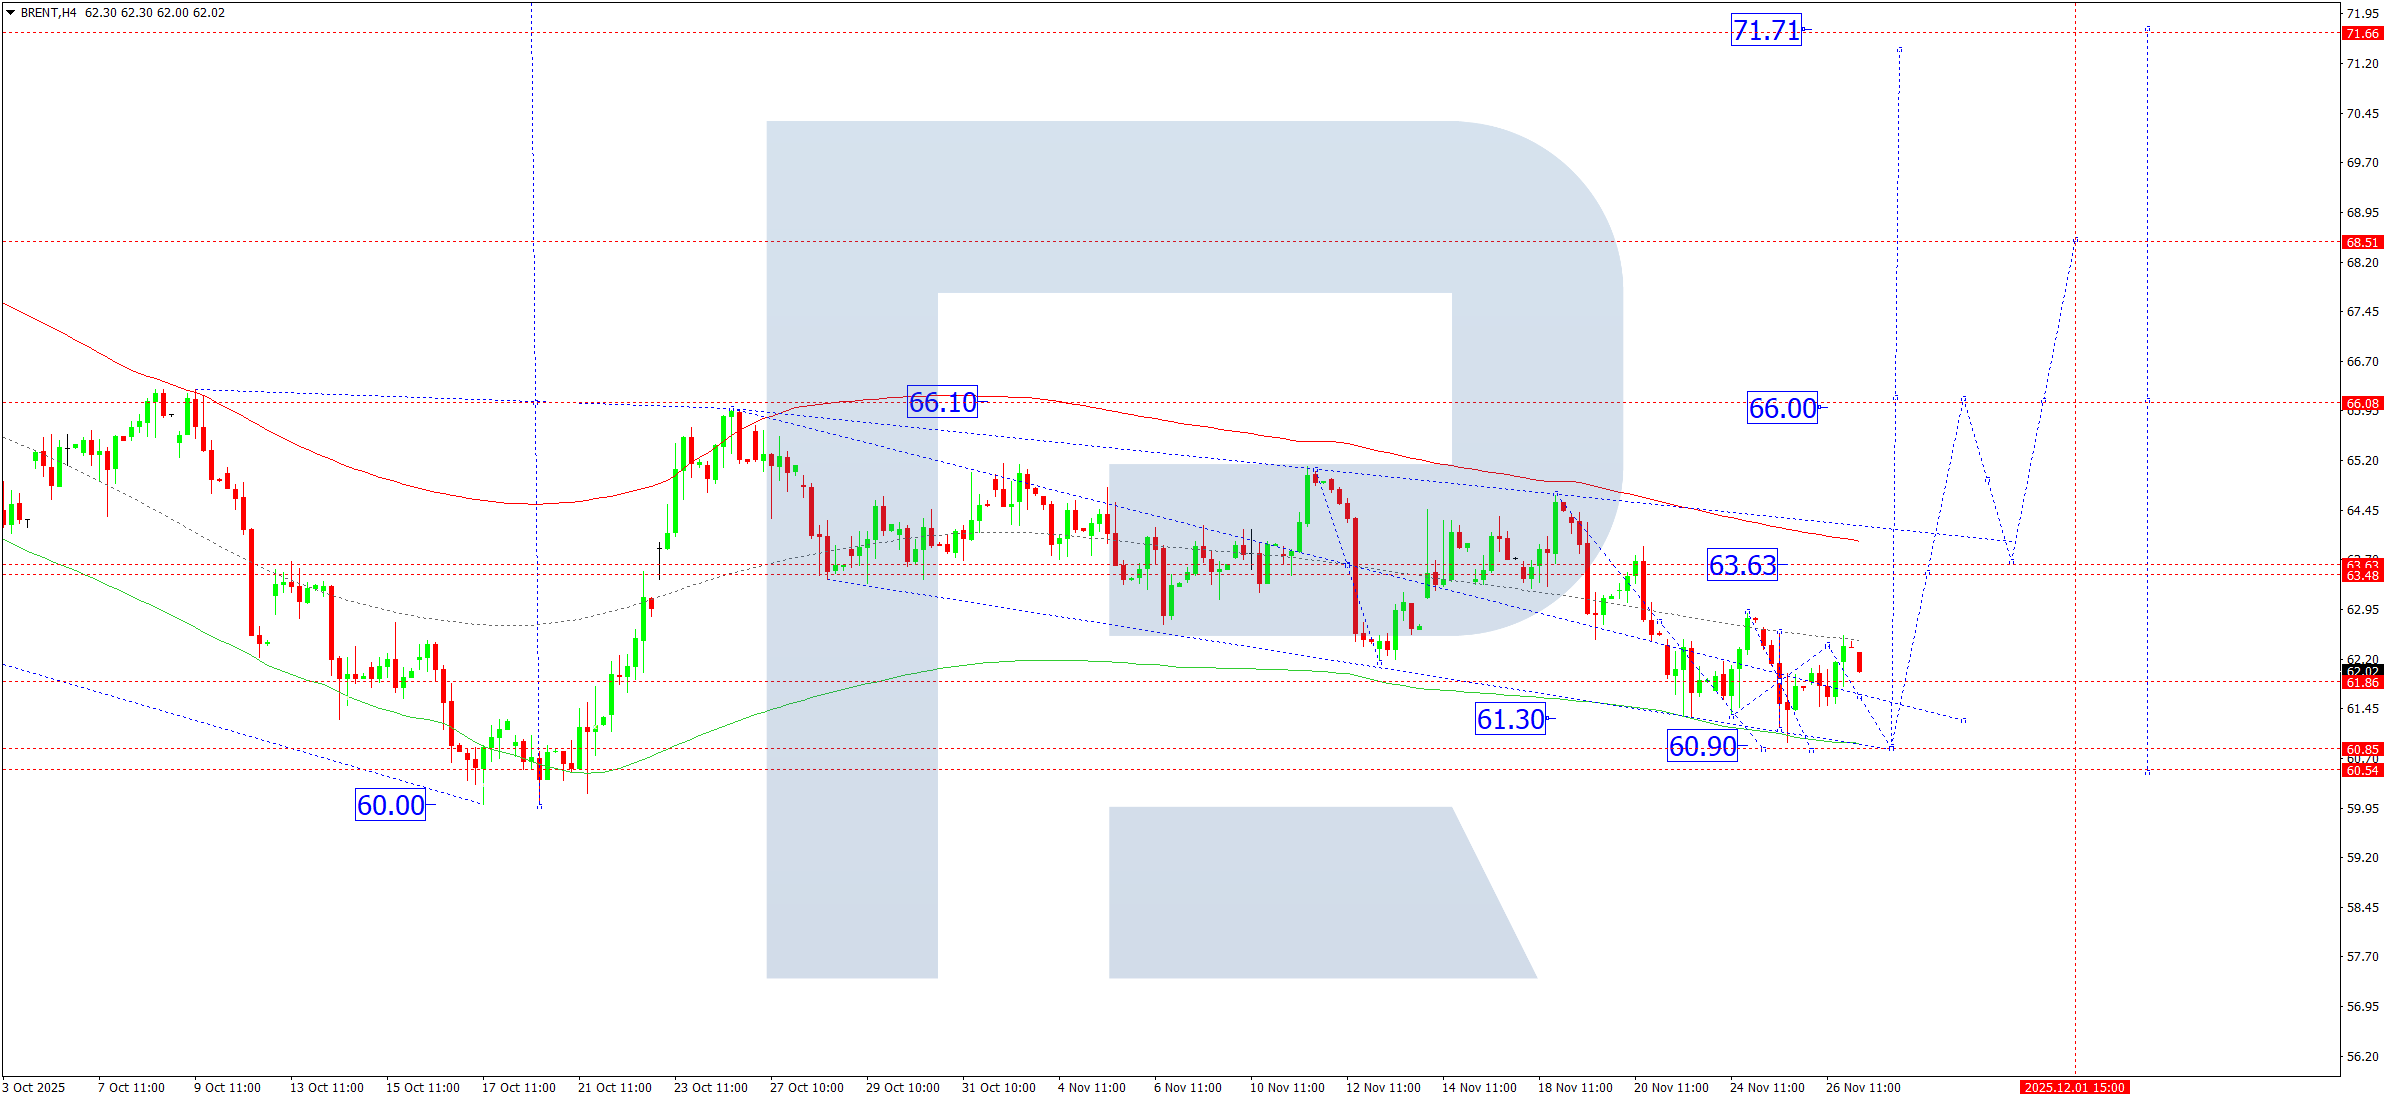
Brent forecast
On the H4 chart of Brent crude, the market forms a consolidation range around 61.86 without a clear directional trend. On 27 November 2025, if the price breaks upwards from this range, the market may continue the upward wave towards 66.00, with the potential to extend the wave towards 71.71. A downward breakout could lead to another corrective move lower towards 60.90. After this correction completes, a rise towards 65.00 may follow.
The Elliott wave structure and the upward wave matrix with a pivot point at 64.00 confirm this scenario and act as the key elements for Brent in this wave. Currently, the market is forming a consolidation range above the lower boundary of the Price Envelope around 61.86. If the price breaks downwards, the wave may stretch towards its lower boundary at 60.90. Conversely, an upward breakout would open the potential for an upward wave towards its upper boundary at 65.00.
Technical indicators for today’s Brent forecast suggest a rise towards 63.00 and 65.00.
Forecasts presented in this section only reflect the author’s private opinion and should not be considered as guidance for trading. RoboForex bears no responsibility for trading results based on trading recommendations described in these analytical reviews.