Daily technical analysis and forecast for 28 November 2025
Here is a detailed daily technical analysis and forecast for EURUSD, USDJPY, GBPUSD, AUDUSD, USDCAD, XAUUSD and Brent for 28 November 2025.
EURUSD forecast
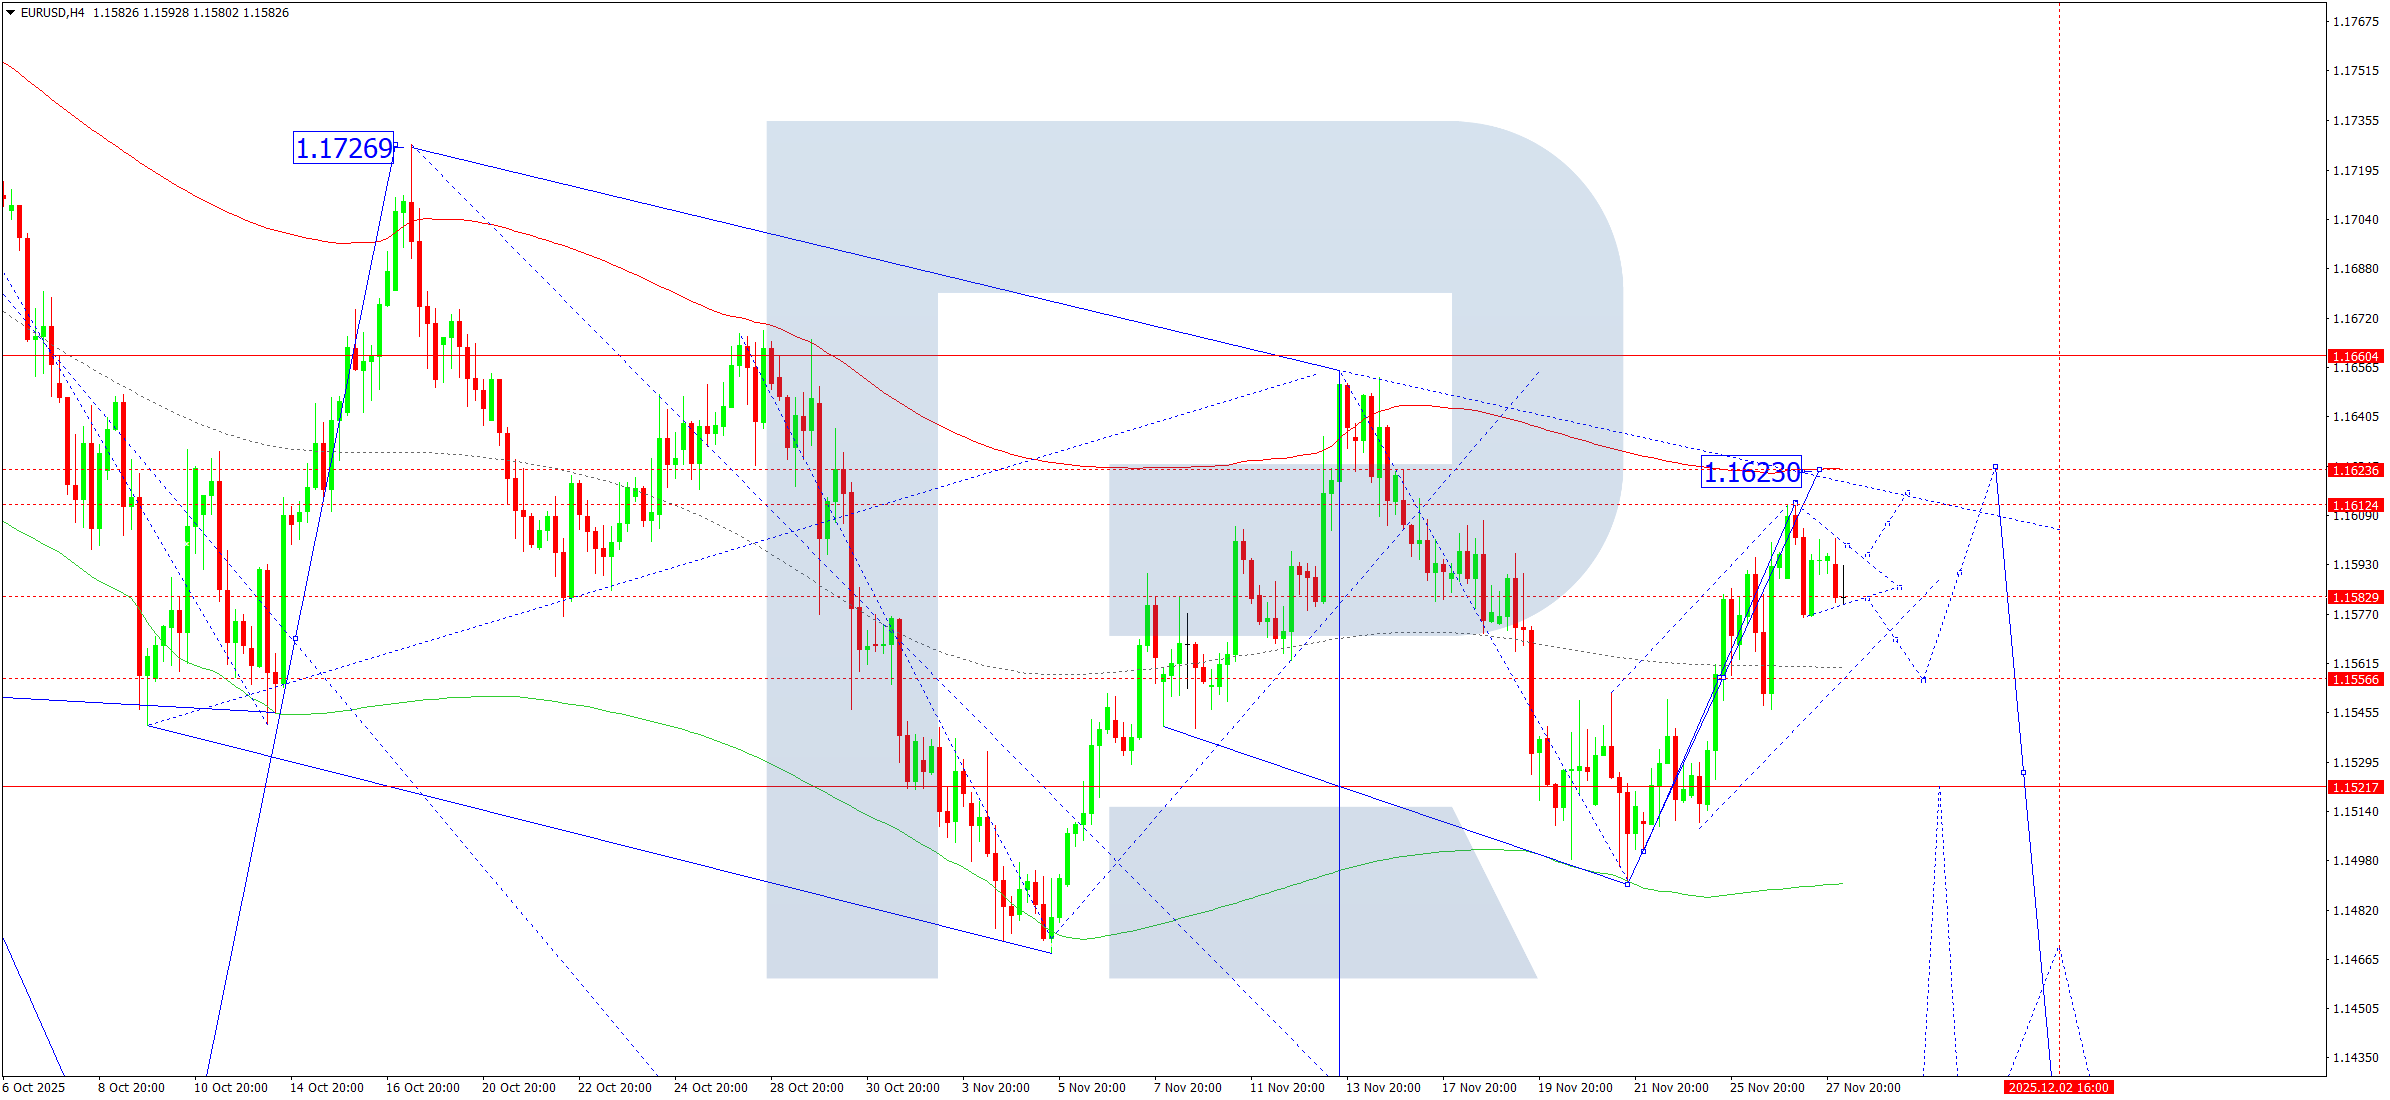
On the H4 chart of EURUSD, the market continues to form a consolidation range around 1.1582. On 28 November 2025, a downward breakout remains possible, with a decline towards 1.1555 (testing from above). Afterwards, another upward wave towards 1.1616–1.1623 may develop. This movement will complete the entire corrective phase. Once the correction ends, the downtrend will resume, with the next downside target at 1.1430 at a minimum.
The Elliott wave structure and the downward wave matrix with a pivot point at 1.1660 confirm this scenario and act as the key elements in the EURUSD wave structure. At the moment, the market is forming an upward wave towards the upper boundary of the Price Envelope at 1.1623. Today, the pair is expected to complete this corrective wave and start declining towards the central line at 1.1555 at a minimum. The wave may also extend towards the lower boundary at 1.1430.
Technical indicators for today’s EURUSD forecast suggest the correction may complete at 1.1623.
USDJPY forecast
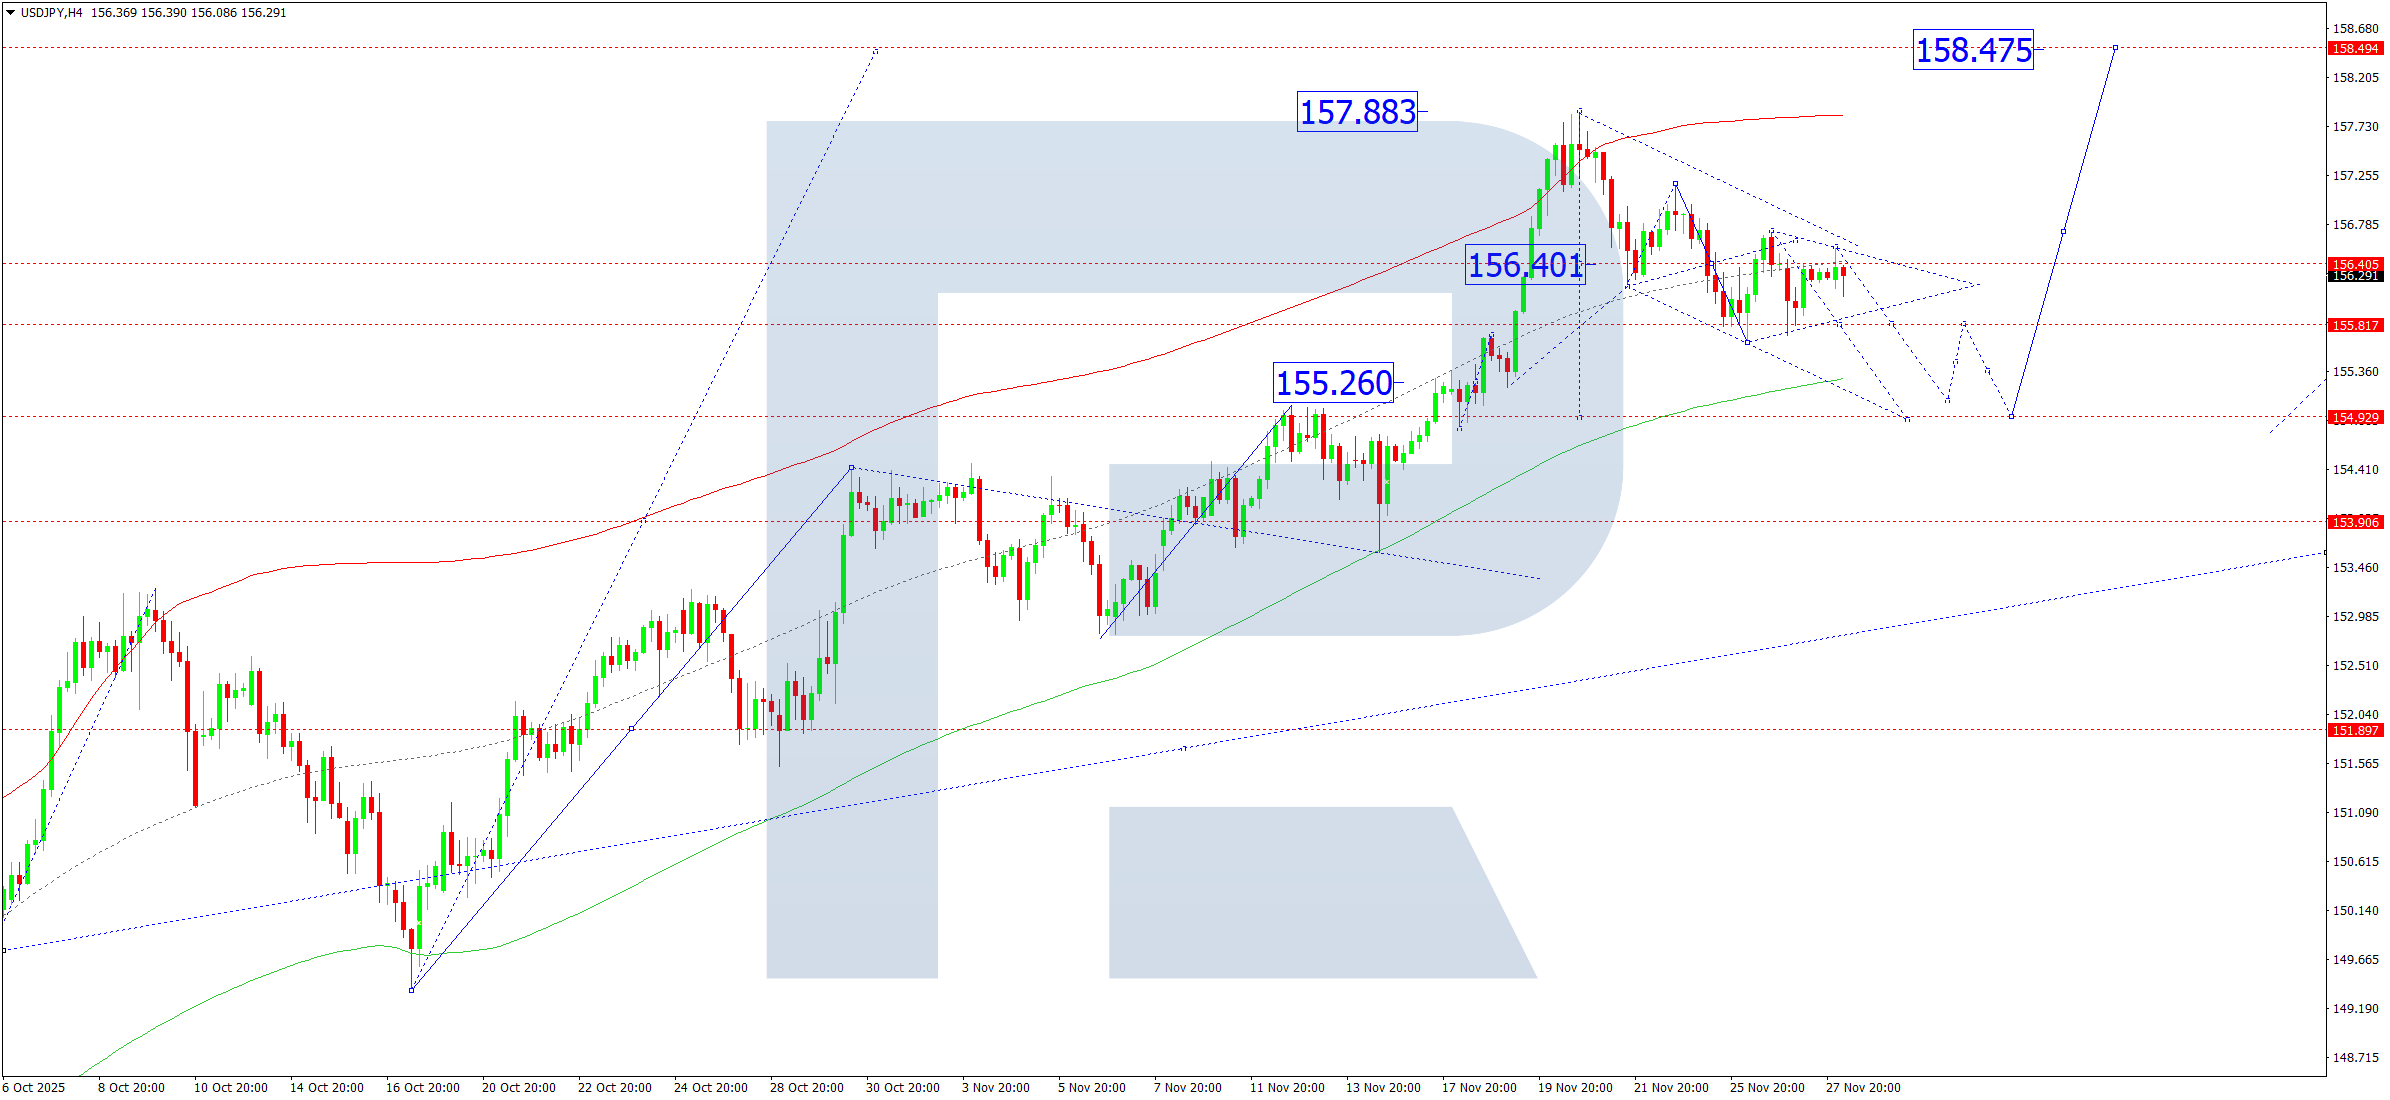
On the H4 chart of USDJPY, the market continues to develop a consolidation range around 156.40. On 28 November 2025, a downward leg towards 154.90 remains possible. This move will complete the ongoing correction. Once the correction ends, the market may begin a new upward wave towards 158.47 at a minimum.
The Elliott wave structure and the upward wave matrix with a pivot point at 153.90 confirm this scenario and act as the key elements in this wave structure. At the moment, the market forms a corrective leg towards the lower boundary of the Price Envelope at 154.90. Afterwards, a rise towards its central line at 156.40 becomes possible.
Technical indicators for today’s USDJPY forecast suggest a correction towards 154.90.
GBPUSD forecast
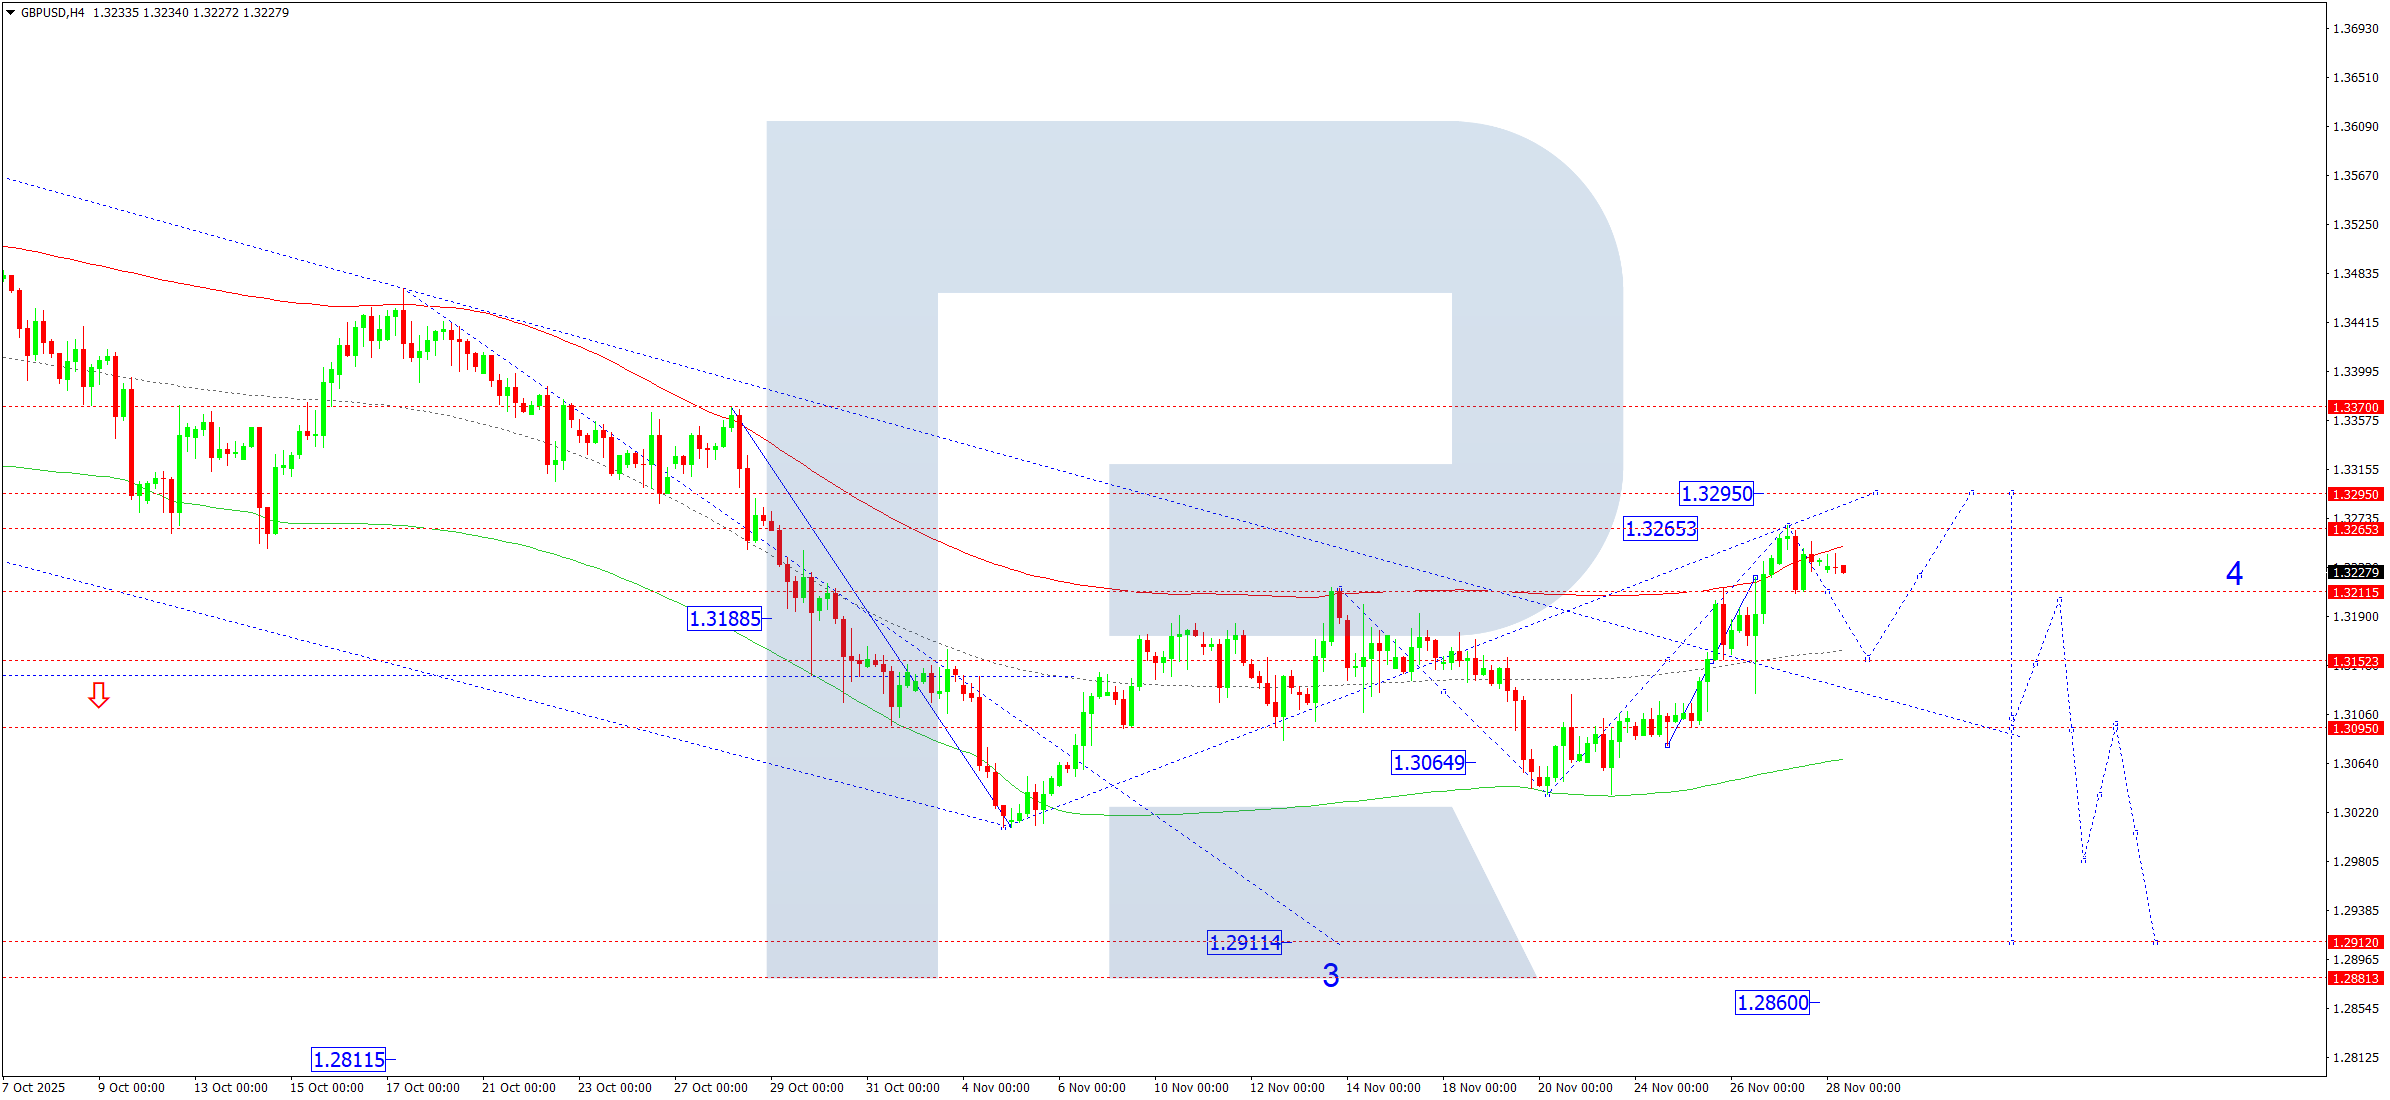
On the H4 chart of GBPUSD, the market completed an upward wave towards 1.3265. On 28 November 2025, a downward wave towards 1.3155 (testing from above) is expected. Afterwards, another upward leg towards 1.3295 may develop. This movement will complete the entire corrective phase. Once the correction finishes, the downtrend will resume, with the next target at 1.3030 and potential continuation towards 1.2911 at a minimum.
The Elliott wave structure and the downward wave matrix with a pivot point at 1.3188 confirm this scenario and act as the key elements in this wave structure. Today, the corrective wave is expected to continue towards the upper boundary of the Price Envelope at 1.3295. Once this wave completes, a decline towards its lower boundary at 1.3030 becomes possible.
Technical indicators for today’s GBPUSD forecast suggest further growth towards 1.3295 and the beginning of a downward wave towards 1.3155.
AUDUSD forecast
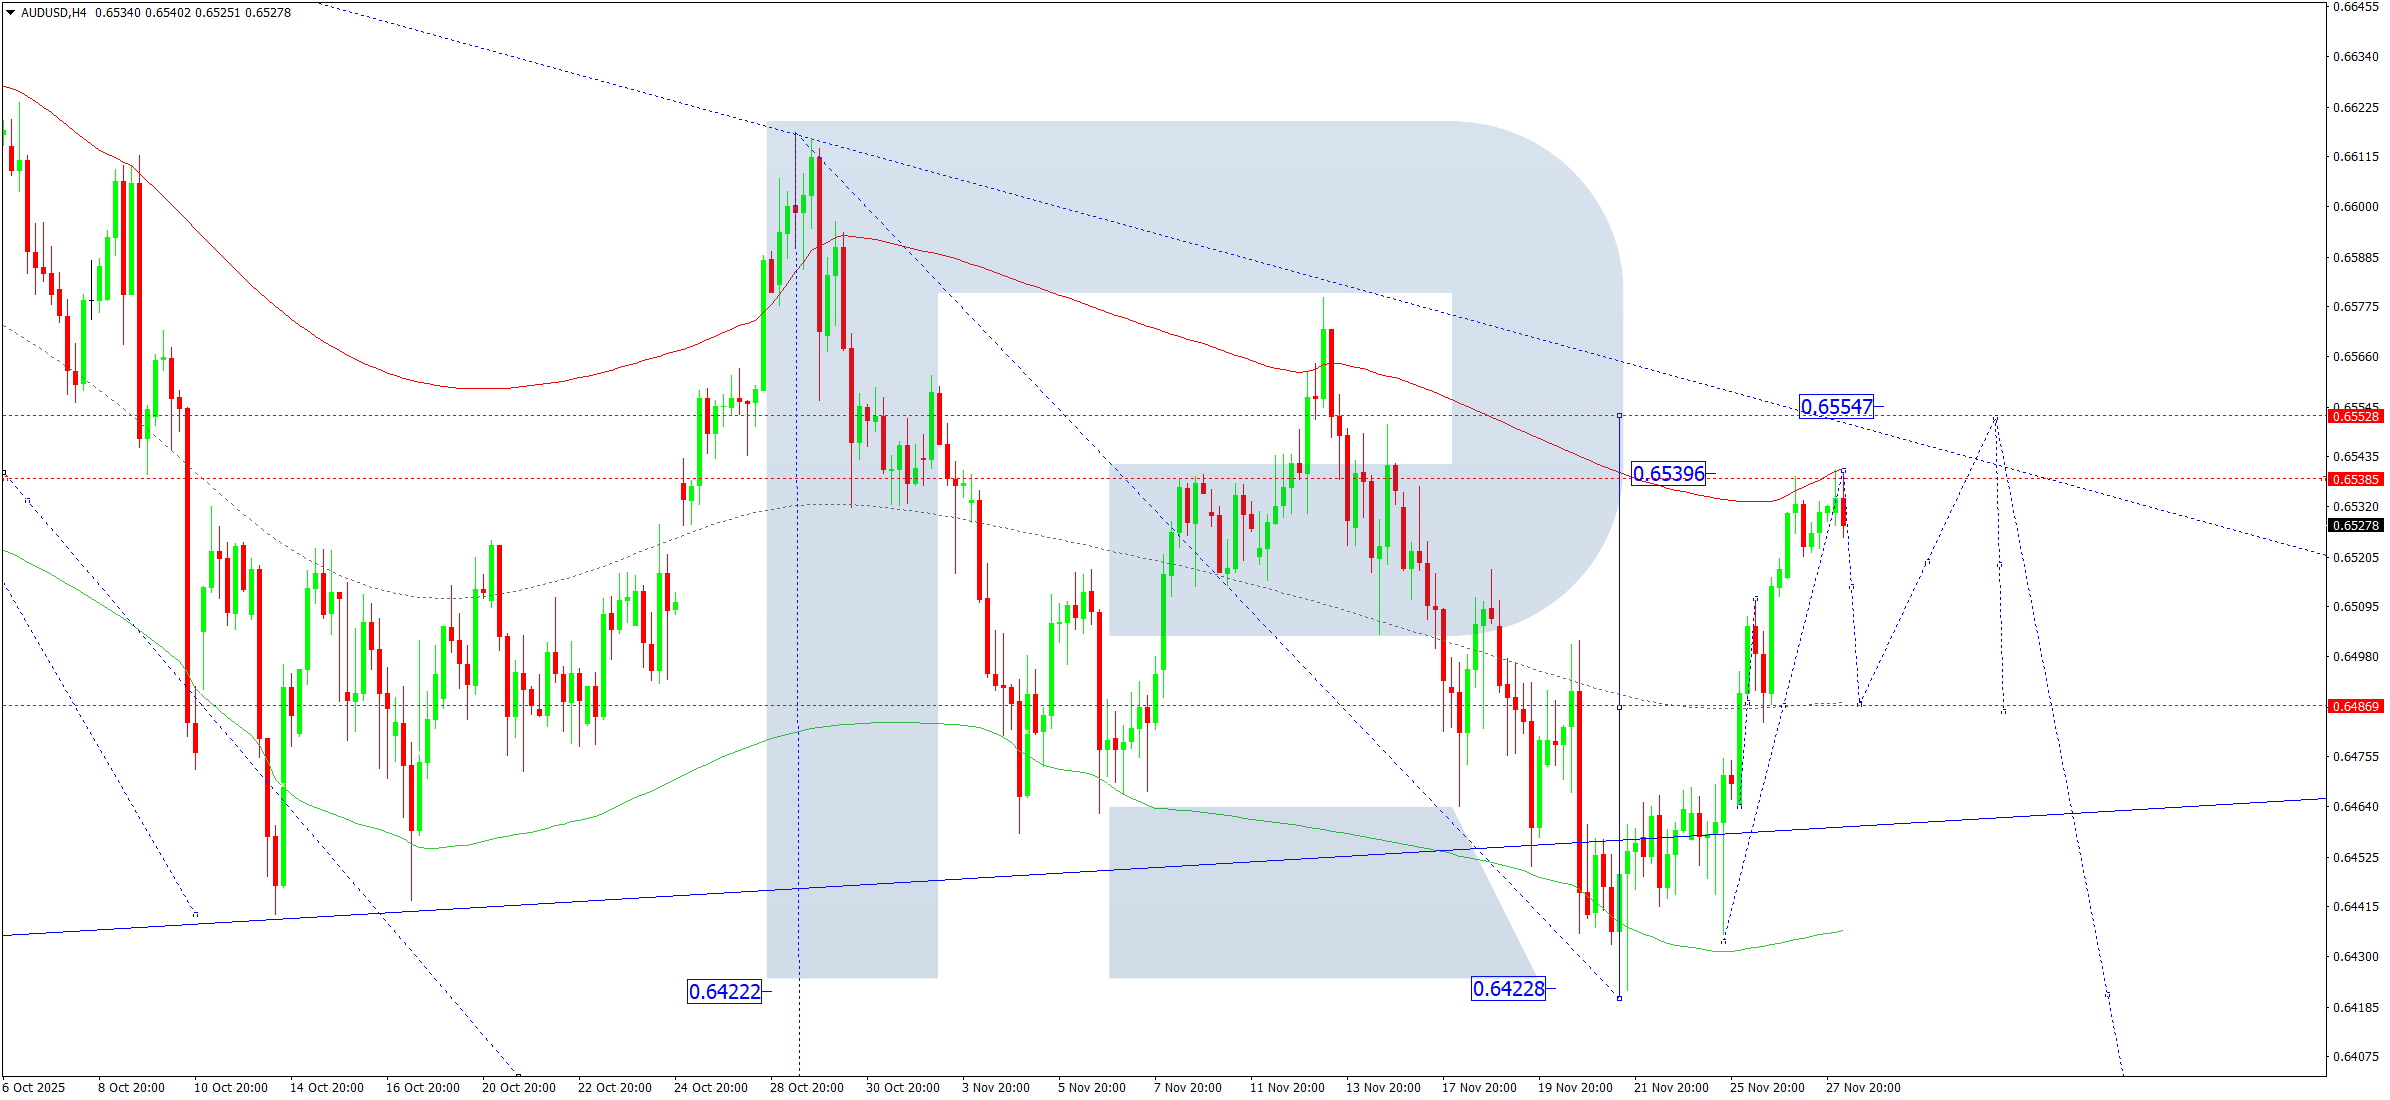
On the H4 chart of AUDUSD, the market completed an upward wave towards 0.6539. On 28 November 2025, a downward move towards 0.6490 (testing from above) is expected. Afterwards, the correction may extend towards 0.6555. Once this correction ends, a new downward wave towards 0.6490 may begin, with the broader trend aiming at 0.6343.
The Elliott wave structure and the downward wave matrix in AUDUSD with a pivot point at 0.6505 confirm this scenario and act as the key elements in this wave structure. At the moment, the market continues to form a corrective wave towards the upper boundary of the Price Envelope at 0.6555. Today, the pair is expected to complete this correction and decline towards the lower boundary at 0.6490.
Technical indicators for today’s AUDUSD forecast suggest a correction towards 0.6555 and a decline towards 0.6490.
USDCAD forecast
On the H4 chart of USDCAD, the market completed a correction towards 1.4024. On 28 November 2025, a compact consolidation range formed above this level. An upward breakout towards 1.4075 remains possible. Afterwards, the market may extend the correction towards 1.4012. After this correction ends, a new upward wave may begin, aiming for 1.4160 as a local target.
The Elliott wave structure and the upward wave matrix with a pivot point at 1.3939 confirm this scenario and act as the key elements in this wave structure. At the moment, the market is forming a corrective wave towards the lower boundary of the Price Envelope at 1.4012. Once the correction completes, a new upward wave towards its upper boundary at 1.4160 may start.
Technical indicators for today’s USDCAD forecast suggest a correction towards 1.4012 and a continued rise towards 1.4160.

XAUUSD forecast
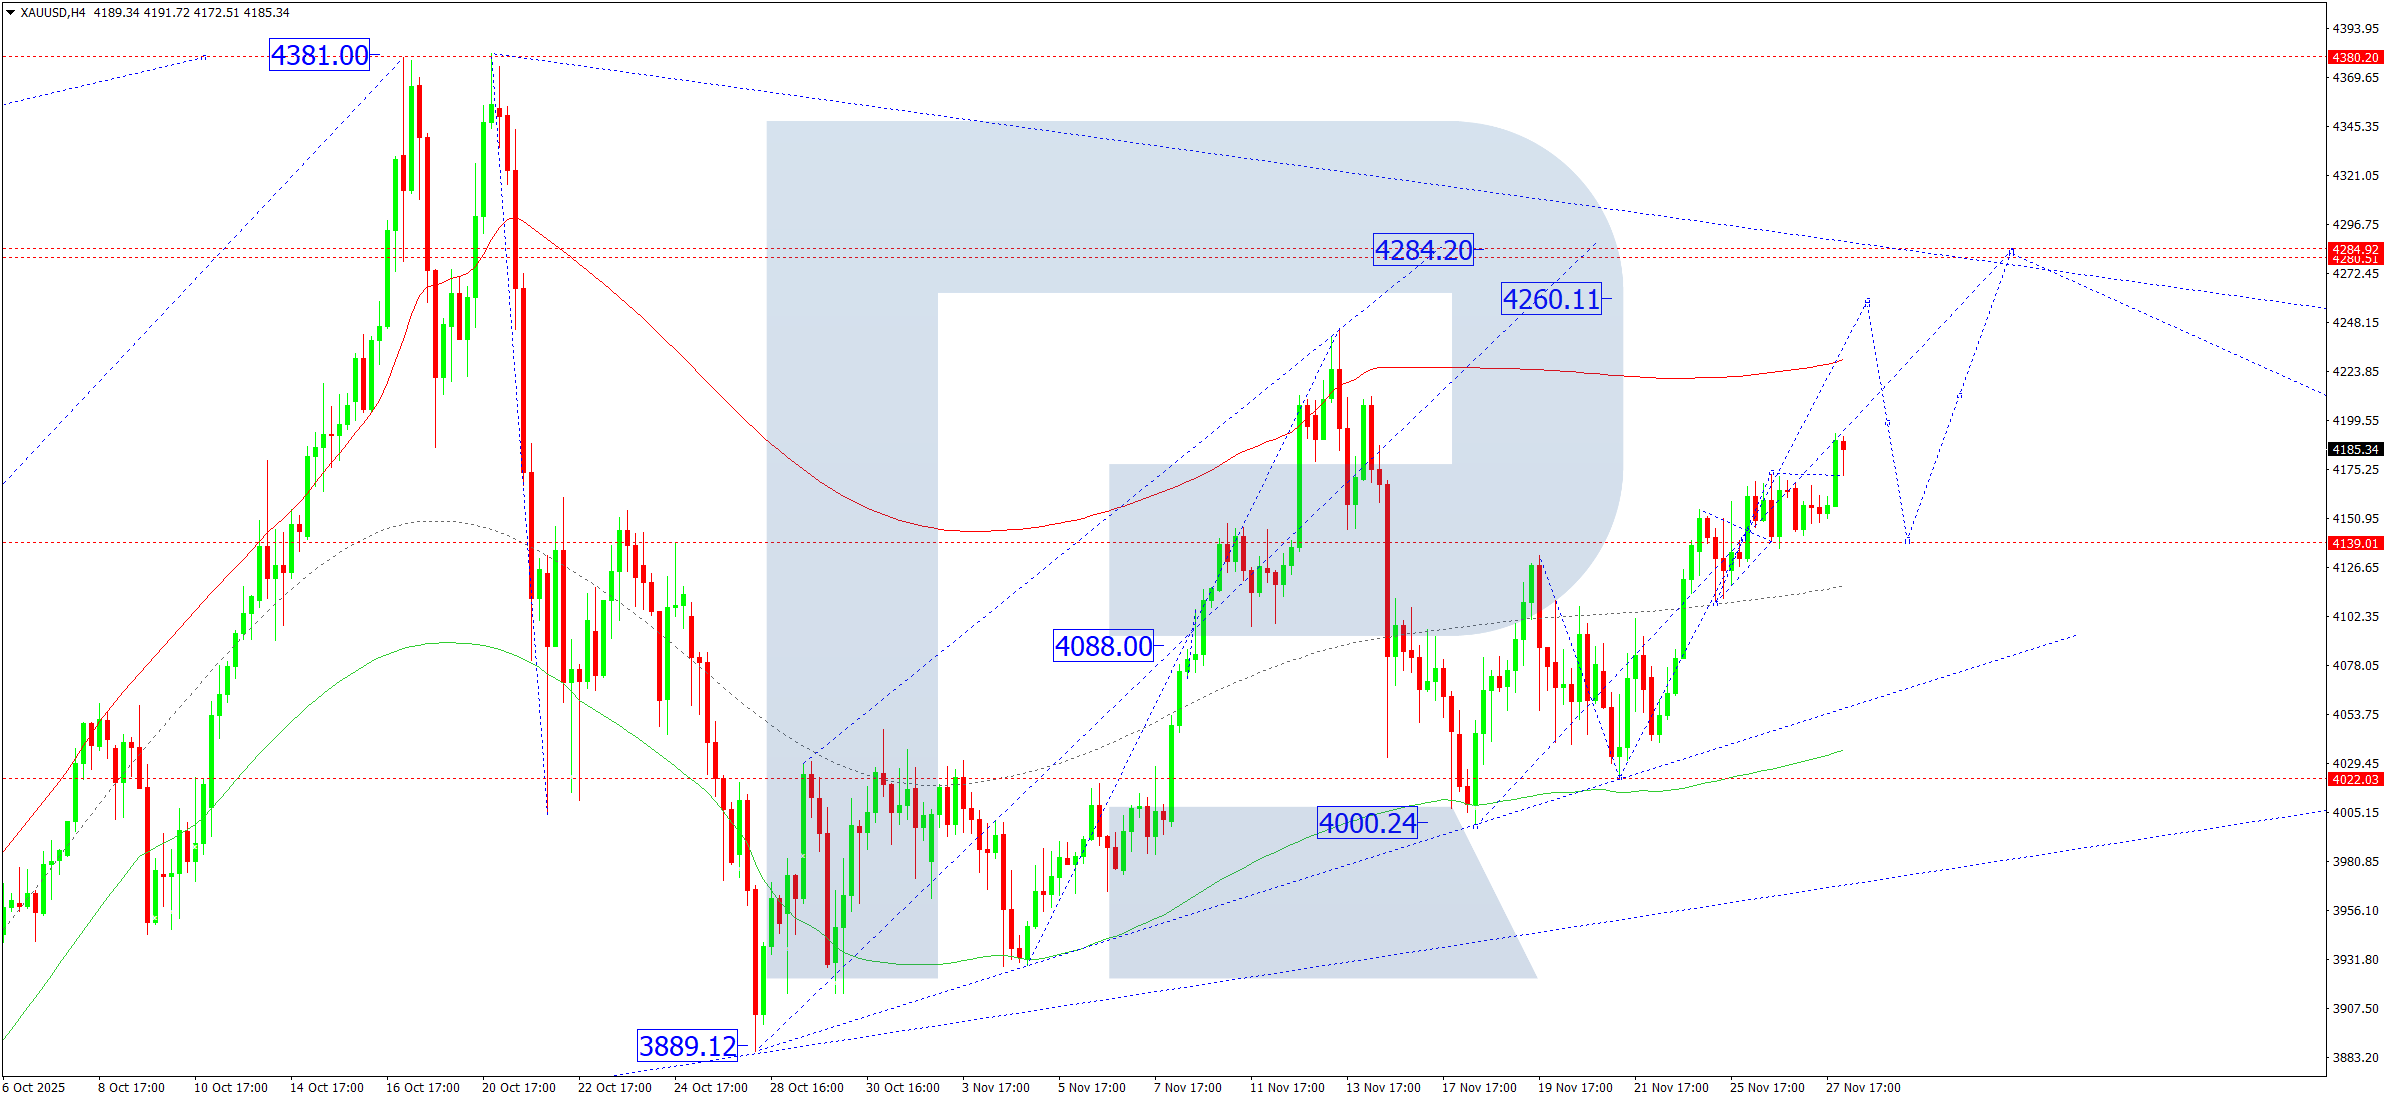
On the H4 chart of XAUUSD, the market broke out upwards from the consolidation range. This breakout opens the potential for a continued upward wave towards 4,260. On 28 November 2025, reaching this target remains possible. Afterwards, a correction towards 4,141 (testing from above) may follow, and then a rise towards 4,285.
The Elliott wave structure and the upward wave matrix with a pivot point at 4,141 confirm this scenario and act as the key elements in this wave. At the moment, the market continues to develop the fifth upward wave towards the upper boundary of the Price Envelope at 4,260. After reaching this level, the market may correct towards its central line at 4,141.
Technical indicators for today’s XAUUSD forecast indicate a possible rise towards 4,260.
Brent forecast
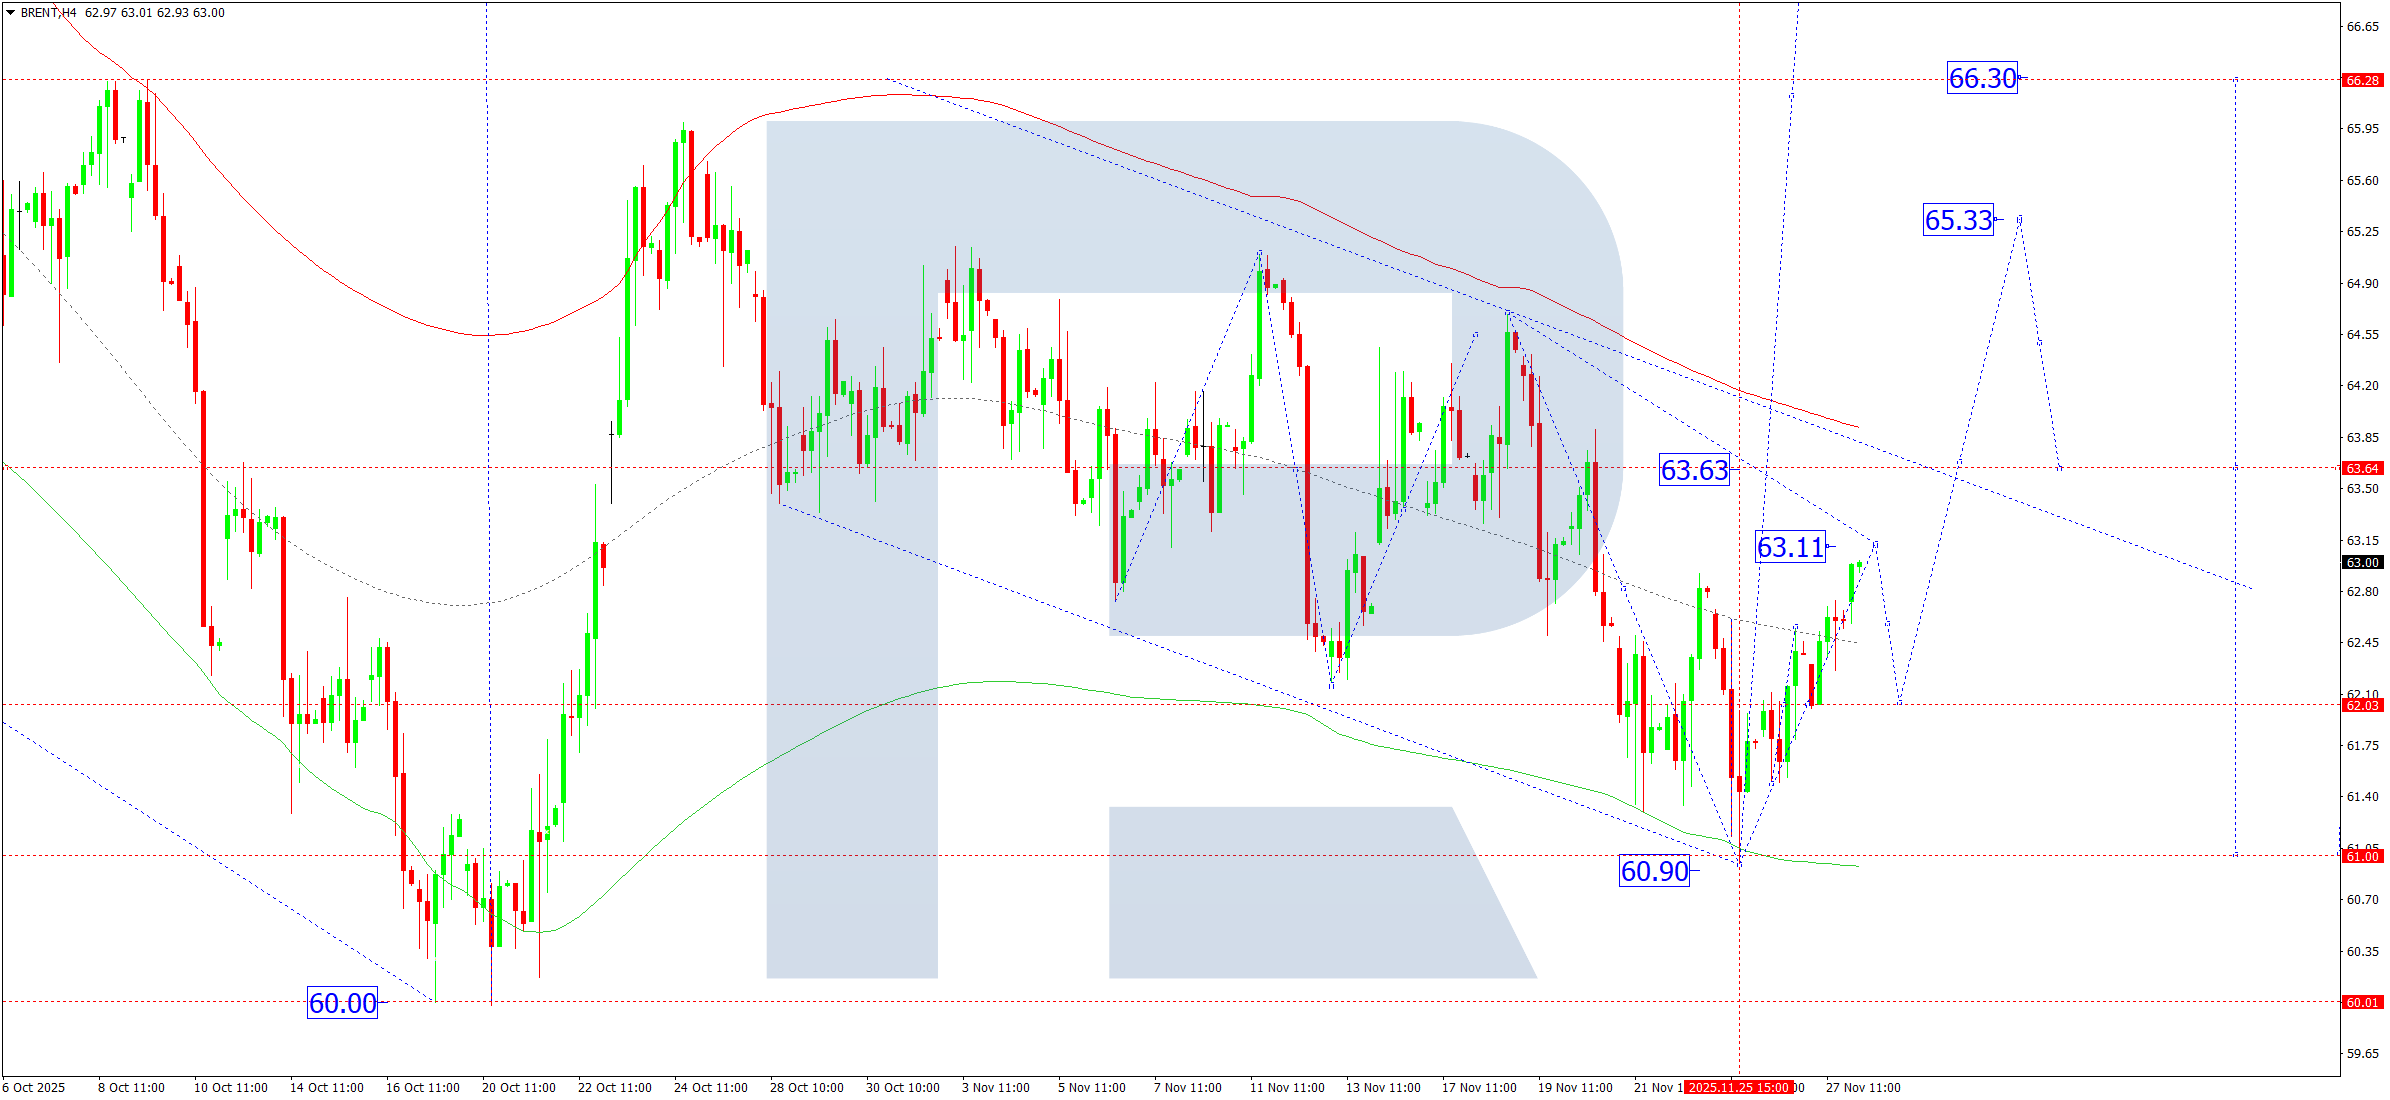
On the H4 chart of Brent crude, the market formed a consolidation range around 62.03. On 28 November 2025, the market may extend the upward wave towards 63.11. Afterwards, a decline towards 62.03 (testing from above) may follow. This movement will outline the boundaries of a new consolidation range. An upward breakout would open the potential for an upward wave towards 63.63. With a breakout above this level, the trend may continue towards 65.33.
The Elliott wave structure and the upward wave matrix with a pivot point at 64.00 confirm this scenario and act as the key elements for Brent in this wave. At the moment, the market is forming a consolidation range around the central line of the Price Envelope at 62.03. If the price breaks downwards, the wave may stretch towards the lower boundary at 60.90. Conversely, an upward breakout could open the door to an upward wave towards the upper boundary at 63.63.
Technical indicators for today’s Brent forecast suggest a rise towards 63.11 and 63.63.
Forecasts presented in this section only reflect the author’s private opinion and should not be considered as guidance for trading. RoboForex bears no responsibility for trading results based on trading recommendations described in these analytical reviews.